Proteins Combined Score Prediction Based on Improved Gene Expression Programming Algorithm and Protein-Protein Interaction Network Characterization
- PMID: 40522017
- PMCID: PMC12168228
- DOI: 10.1049/syb2.70024
Proteins Combined Score Prediction Based on Improved Gene Expression Programming Algorithm and Protein-Protein Interaction Network Characterization
Abstract
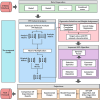
Predicting the combined score in protein-protein interaction (PPI) networks represents a critical research focus in bioinformatics, as it contributes to enhancing the accuracy of PPI data and uncovering the inherent complexity of biological systems. However, existing intelligent algorithms encounter significant challenges in effectively integrating heterogeneous data sources, capturing the nonlinear dependencies within PPI networks, and improving model generalizability. To address these limitations, this study introduces an enhanced gene expression programming (DF-GEP) algorithm that incorporates dynamic factor optimization. The proposed DF-GEP framework integrates Spearman correlation analysis with kernel ridge regression (SC-KRR) to extract and assign refined weights to key PPI network features. Additionally, the algorithm adaptively regulates selection, crossover, mutation and fitness evaluation processes via dynamic factor adjustment, thereby improving adaptability and predictive precision. Experimental results show that the DF-GEP algorithm consistently outperforms baseline models in both predictive accuracy and stability. Beyond its application to PPI-combined score prediction, the proposed algorithm also exhibits strong potential for addressing complex nonlinear problems in other domains.
Keywords: biology computing; data mining; genetic algorithms; principal component analysis.
© 2025 The Author(s). IET Systems Biology published by John Wiley & Sons Ltd on behalf of The Institution of Engineering and Technology.
Conflict of interest statement
The authors declare no conflicts of interest.
Figures


Similar articles
-
An End-to-End Knowledge Graph Fused Graph Neural Network for Accurate Protein-Protein Interactions Prediction.IEEE/ACM Trans Comput Biol Bioinform. 2024 Nov-Dec;21(6):2518-2530. doi: 10.1109/TCBB.2024.3486216. Epub 2024 Dec 10. IEEE/ACM Trans Comput Biol Bioinform. 2024. PMID: 39446541
-
Advancing edge-based clustering and graph embedding for biological network analysis: a case study in RASopathies.Brief Bioinform. 2025 Jul 2;26(4):bbaf320. doi: 10.1093/bib/bbaf320. Brief Bioinform. 2025. PMID: 40619812 Free PMC article.
-
Stabilizing machine learning for reproducible and explainable results: A novel validation approach to subject-specific insights.Comput Methods Programs Biomed. 2025 Sep;269:108899. doi: 10.1016/j.cmpb.2025.108899. Epub 2025 Jun 21. Comput Methods Programs Biomed. 2025. PMID: 40570739
-
Diagnostic tests and algorithms used in the investigation of haematuria: systematic reviews and economic evaluation.Health Technol Assess. 2006 Jun;10(18):iii-iv, xi-259. doi: 10.3310/hta10180. Health Technol Assess. 2006. PMID: 16729917
-
Home treatment for mental health problems: a systematic review.Health Technol Assess. 2001;5(15):1-139. doi: 10.3310/hta5150. Health Technol Assess. 2001. PMID: 11532236
References
Publication types
MeSH terms
Grants and funding
- 2023IT024/China University Industry Research Innovation Foundation-New Generation Information Technology Innovation Project
- Research Capacity Enhancement Program for Young and Middle-Aged University, Faculty in Guangxi
- 2024KY1033/Project of Improving the Basic Scientific Research Ability of Young and Middle-Aged Teachers in Guangxi Universities
- 2025KY1208/Applied Research on Predicting Dynamic Protein Functional Modules for Disease Treatment
- Guangxi Science and Technology Program Guangxi Key R&D Program
LinkOut - more resources
Full Text Sources
Miscellaneous

