

Polygonati Rhizoma Prevents Glucocorticoid-Induced Growth Inhibition of Muscle via Promoting Muscle Angiogenesis Through Deoxycholic Acid
- PMID: 40522031
- PMCID: PMC12168230
- DOI: 10.1002/jcsm.13853
Polygonati Rhizoma Prevents Glucocorticoid-Induced Growth Inhibition of Muscle via Promoting Muscle Angiogenesis Through Deoxycholic Acid
Abstract
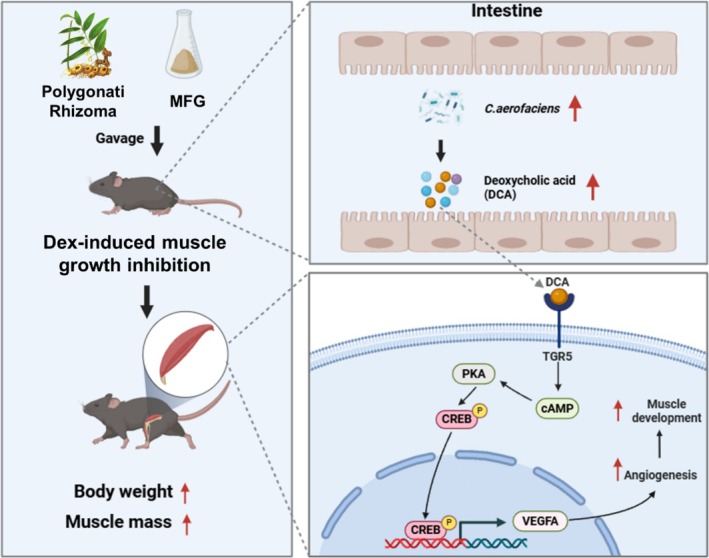
Background: Glucocorticoids are commonly used in clinical treatments but can cause muscle growth inhibition and weakness at high doses. The mechanisms and treatments for glucocorticoid-induced muscle growth inhibition remain poorly understood. This study aims to investigate the anti-atrophic effects of Polygonati Rhizoma (PR) and a mixture of low-dose fructose and glucose (MFG, an active component mimic in PR) on skeletal muscle.
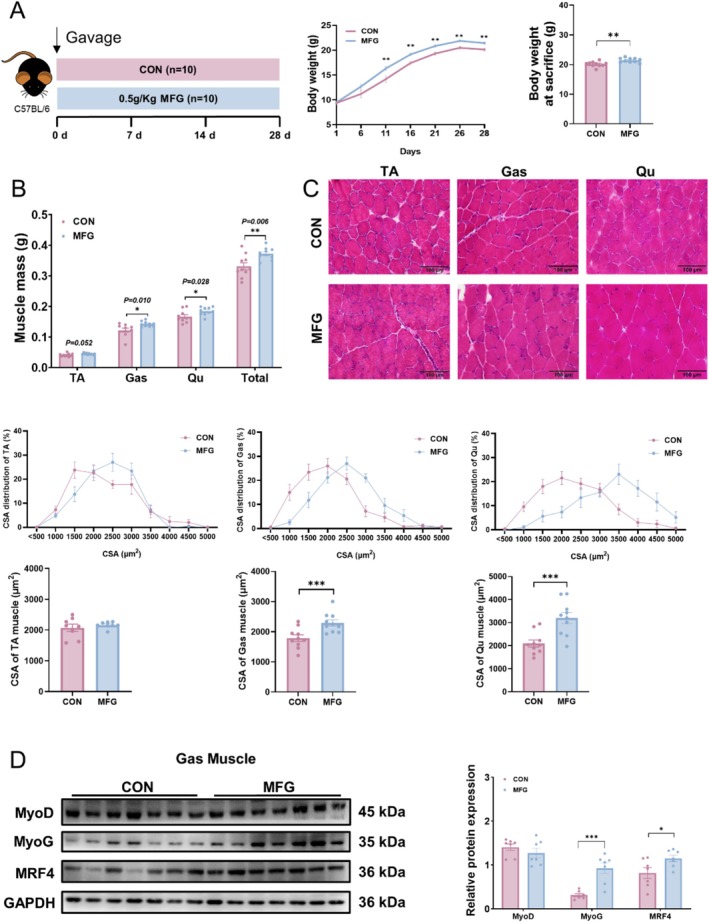
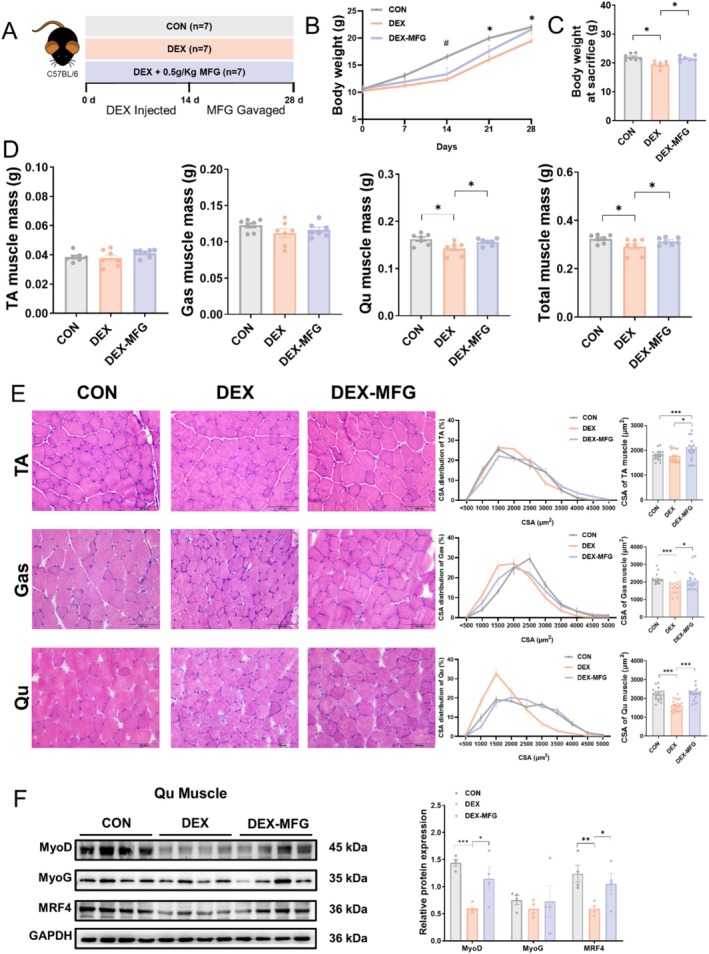
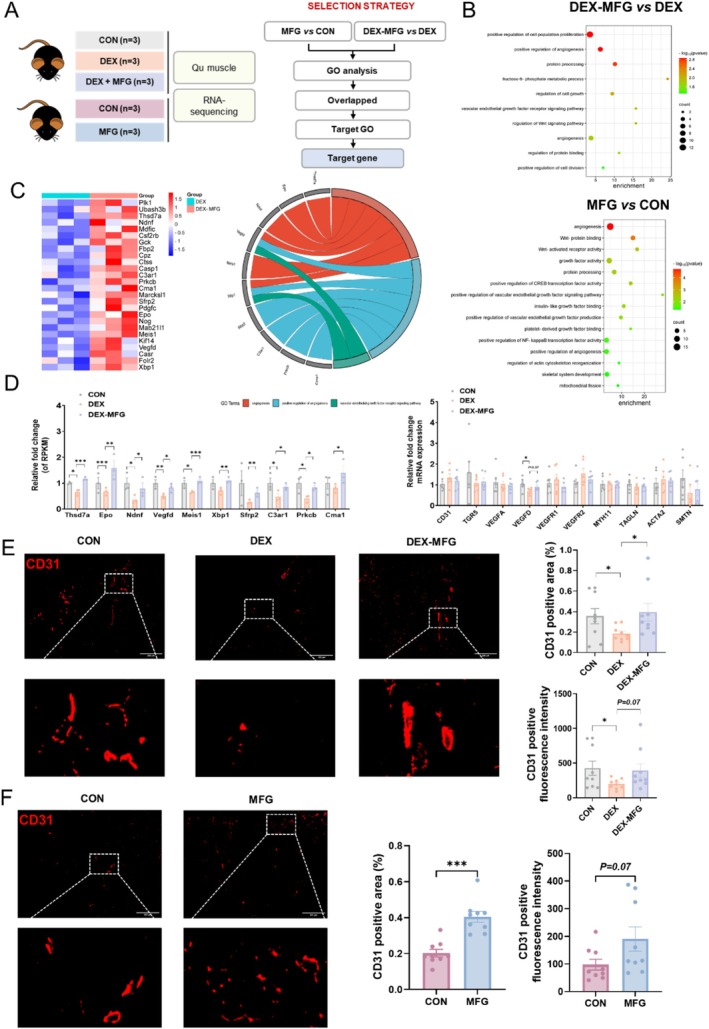
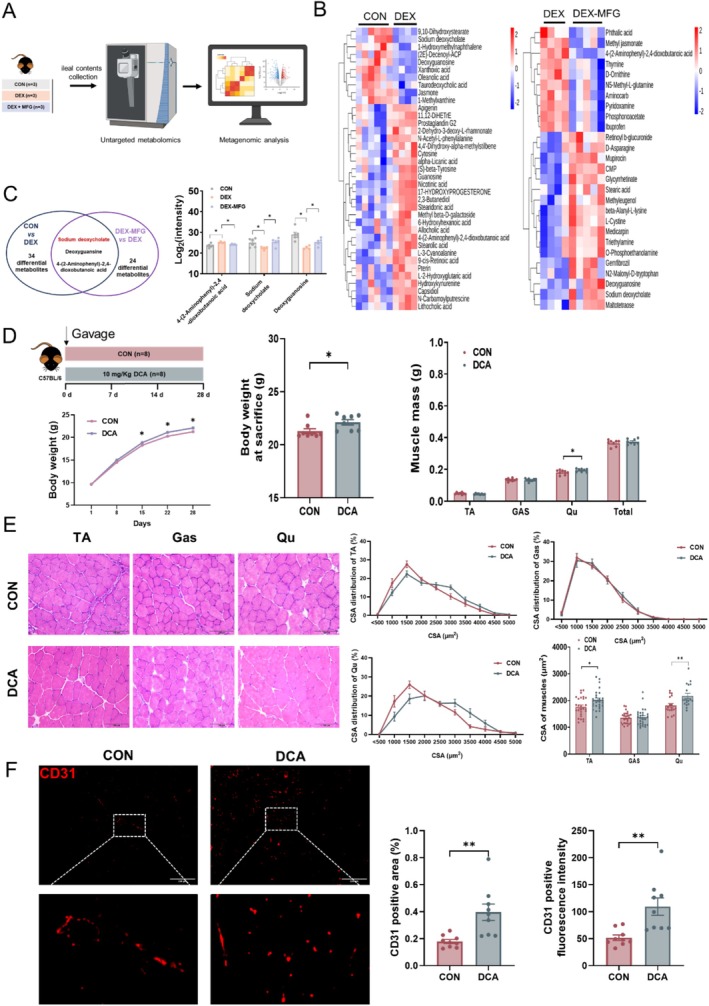
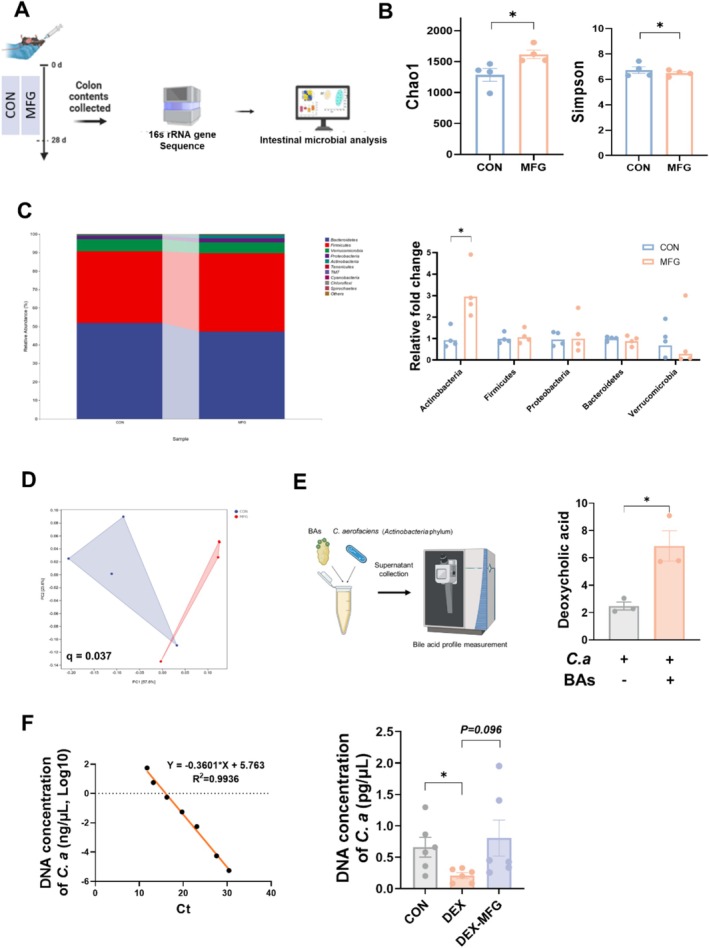
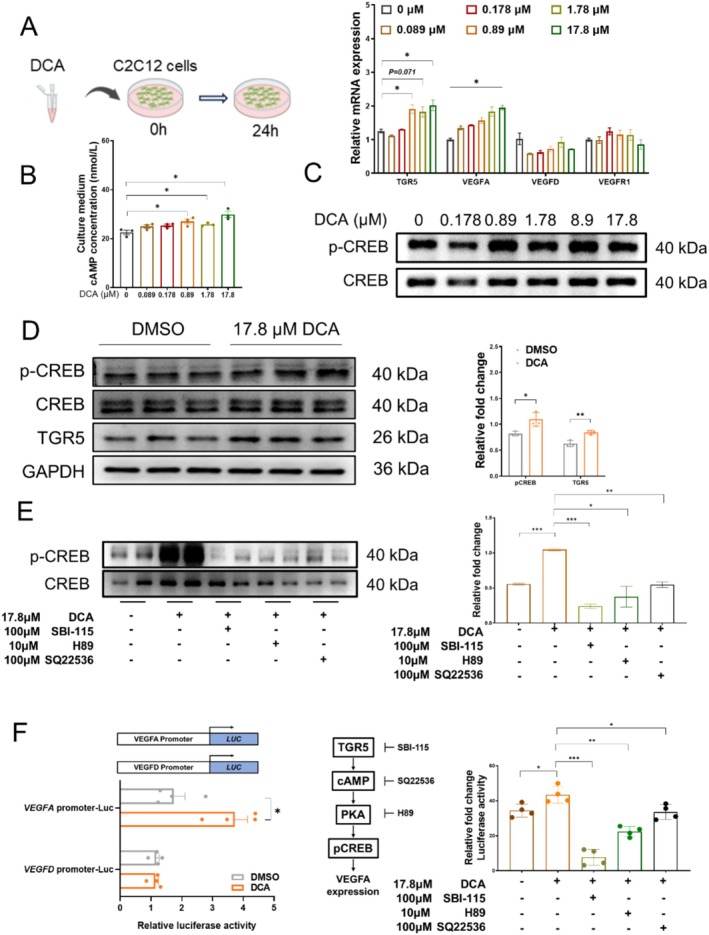
Methods: Male C57BL/6 mice (3-week-old, n = 8) were gavaged with aqueous extract of PR (AEPR). MFG was used to gavage normal male C57BL/6 mice (3-week-old, n = 10) and male C57BL/6 mice with dexamethasone (DEX)-induced muscle growth inhibition (3-week-old, n = 7). After 2 weeks of gavage, the body weight and muscle mass of the mice were measured. Intestinal content was collected, the concentration of deoxycholic acid (DCA) was analysed and gut microbiota changes were assessed through 16S rRNA gene sequencing. Muscle angiogenesis was examined through the expression of vascular endothelial growth factors (VEGFs), focusing on the DCA-activated TGR5/cAMP/PKA/pCREB pathway.
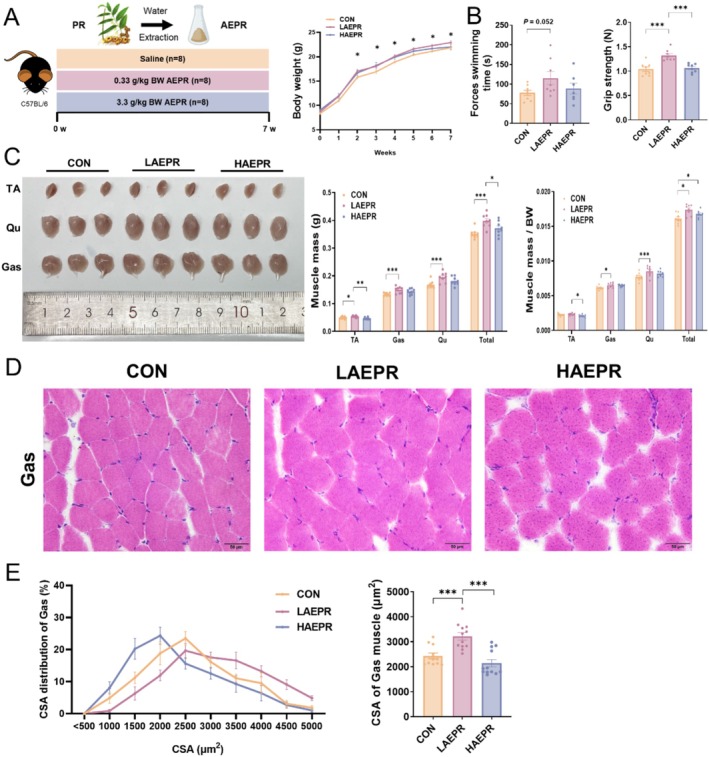
Results: AEPR significantly increased the body weight (22.90 ± 0.90 vs. 21.83 ± 0.87 g, *p < 0.05) and grip strength (1.32 ± 0.11 vs. 1.04 ± 0.12 N, ***p < 0.001) of mice. MFG (0.5 g/kg body weight) also significantly elevated the body weight (21.44 ± 0.71 vs. 20.14 ± 0.82 g, **p < 0.01) and muscle mass (0.37 ± 0.018 vs. 0.33 ± 0.035 g, **p < 0.01) of mice. In the DEX group, MFG restored the DCA level (log2[intensity]) in intestinal content (25.41 ± 1.64 vs. 22.69 ± 0.74, *p < 0.05) and increased the abundance of Collinsella aerofaciens as measured by DNA concentration (0.80 ± 0.64 vs. 0.24 ± 0.09 pg/μL, p = 0.096). Mechanistically, MFG upregulated VEGFs expression and promoted muscle angiogenesis via the TGR5/cAMP/PKA/pCREB pathway.
Conclusions: This study demonstrates that AEPR and its active component mimic MFG can promote muscle growth and MFG mitigates muscle growth inhibition by modulating gut microbiota and enhancing muscle angiogenesis. These findings suggest that fructose-containing treatments are novel strategies to address skeletal muscle dysfunction.
Keywords: Polygonati Rhizoma; angiogenesis; deoxycholic acid; fructose; skeletal muscle.
© 2025 The Author(s). Journal of Cachexia, Sarcopenia and Muscle published by Wiley Periodicals LLC.
Conflict of interest statement
The authors declare no conflicts of interest.
Figures
Similar articles
-
[Protective effect of Polygonati Rhizoma aqueous extract on gastric mucosal injury in mice induced by overtaking pungent substances and alcohol via TRAF1/ASK1/JNK pathway].Zhongguo Zhong Yao Za Zhi. 2024 Oct;49(20):5505-5515. doi: 10.19540/j.cnki.cjcmm.20240701.401. Zhongguo Zhong Yao Za Zhi. 2024. PMID: 39701734 Chinese.
-
[Effects of different fractions of Polygonati Rhizoma on reproductive dysfunction in male mice with kidney essence deficiency].Zhongguo Zhong Yao Za Zhi. 2024 Oct;49(20):5577-5586. doi: 10.19540/j.cnki.cjcmm.20240715.301. Zhongguo Zhong Yao Za Zhi. 2024. PMID: 39701740 Chinese.
-
Network-based pharmacological and experimentally validated study on the therapeutic effects and mechanisms of Polygonatum Rhizoma Ginseng Formula in immunocompromised mice.J Ethnopharmacol. 2025 May 28;348:119821. doi: 10.1016/j.jep.2025.119821. Epub 2025 Apr 16. J Ethnopharmacol. 2025. PMID: 40250634
-
Polygonati Rhizoma polysaccharide suppresses microglial activation and promotes functional recovery of spinal cord via improving intestinal microbiota.Int J Biol Macromol. 2025 Jun;313:143934. doi: 10.1016/j.ijbiomac.2025.143934. Epub 2025 May 7. Int J Biol Macromol. 2025. PMID: 40345303
-
Effects of different steaming times on the composition, structure and immune activity of Polygonatum Polysaccharide.J Ethnopharmacol. 2023 Jun 28;310:116351. doi: 10.1016/j.jep.2023.116351. Epub 2023 Mar 11. J Ethnopharmacol. 2023. PMID: 36914038
References
-
- Barnes P., “Scientific Rationale for Inhaled Combination Therapy with Long‐Acting Β2‐Agonists and Corticosteroids,” European Respiratory Journal 19 (2002): 182–191. - PubMed
-
- Dardevet D., Sornet C., Taillandier D., Savary I., Attaix D., and Grizard J., “Sensitivity and Protein Turnover Response to Glucocorticoids Are Different in Skeletal Muscle From Adult and Old Rats. Lack of Regulation of the Ubiquitin‐Proteasome Proteolytic Pathway in Aging,” Journal of Clinical Investigation 96 (1995): 2113–2119. - PMC - PubMed
-
- Schakman O., Kalista S., Barbé C., Loumaye A., and Thissen J. P., “Glucocorticoid‐Induced Skeletal Muscle Atrophy,” International Journal of Biochemistry & Cell Biology 45 (2013): 2163–2172. - PubMed
-
- Auclair D., Garrel D., Chaouki Zerouala A., and Ferland L., “Activation of the Ubiquitin Pathway in Rat Skeletal Muscle by Catabolic Doses of Glucocorticoids,” American Journal of Physiology. Cell Physiology 272 (1997): C1007–C1016. - PubMed
-
- Yin L., Li N., Jia W., et al., “Skeletal Muscle Atrophy: From Mechanisms to Treatments,” Pharmacological Research 172 (2021): 105807. - PubMed
MeSH terms
Substances
Grants and funding
- 32102561/National Natural Science Foundation of China
- 32472957/National Natural Science Foundation of China
- 32302691/National Natural Science Foundation of China
- 2023YFD1301304/National Key R&D Program of China
- 2022YFC3502200/National Key R&D Program of China
- 2023AFB1052/Hubei Provincial Natural Science Foundation of China
- 20232BBF60014/Key Research and Development Plan Project of Jiangxi Province
- 2024SSY04141/Jiangxi Province Key Laboratory of Animal Green and Healthy Breeding
- 2023020201020354/Knowledge Innovation Program of Wuhan-Shuguang Project
- 2662023DKPY002/Fundamental Research Funds for the Central Universities
- 202310504015/National Innovation and Entrepreneurship Training Program for Undergraduate
LinkOut - more resources
Full Text Sources
Medical
Research Materials
