. 2025 Aug;37(34):e2501788.
doi: 10.1002/adma.202501788. Epub 2025 Jun 16.

Ruddlesden-Popper Defects Act as a Free Surface: Role in Formation and Photophysical Properties of CsPbI3

Affiliations

Ruddlesden-Popper Defects Act as a Free Surface: Role in Formation and Photophysical Properties of CsPbI3

Weilun Li et al. Adv Mater. 2025 Aug.

Abstract

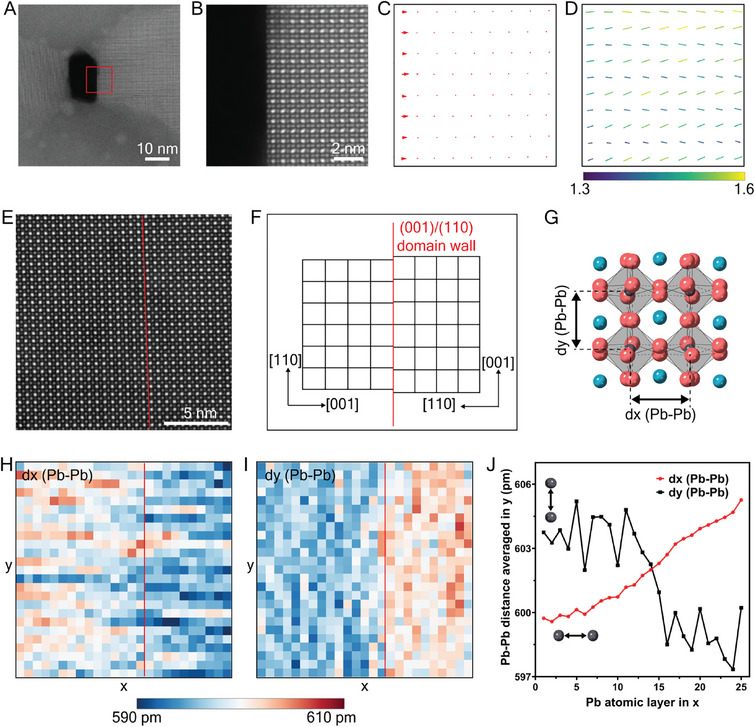
The perovskite semiconductor, CsPbI3, holds excellent promise for solar cell applications due to its suitable bandgap. However, achieving phase-stable CsPbI3 solar cells with high power conversion efficiency remains a major challenge. Ruddlesden-Popper (RP) defects have been identified in a range of perovskite semiconductors, including CsPbI3. However, there is limited understanding as to why they form or their impact on stability and photophysical properties. Here, the prevalence of RP defects is increased with increased Cs-excess in vapor-deposited CsPbI3 thin films while superior structural stability but inferior photophysical properties are observed. Significantly, using electron microscopy, it is found that the atomic positions at the planar defect are comparable to those of a free surface, revealing their role in phase stabilization. Density functional theory (DFT) calculations reveal the RP planes are electronically benign, however, antisites observed at RP turning points are likely to be malign. Therefore it is proposed that increasing RP planes while reducing RP turning points offers a breakthrough for improving both phase stability and photophysical performance. The formation mechanism revealed here can apply more generally to RP structures in other perovskite systems.

Keywords: defects; electron microscopy; halide perovskites; solar cells; structure‐property relationships; vapour deposition.


Conflict of interest statement

The authors declare no conflict of interest.

Figures

Figure 1
Figure 1
Atomic resolution TEM images of CsPbI3 films with different Cs compositions. A,B) STEM‐ADF images of the δ‐CsPbI3 phase in Cs‐0.85 films in the [100] zone axis. C) A schematic diagram of the phase transition from the initial γ‐CsPbI3 into δ‐CsPbI3. γ‐CsPbI3 is viewed in the [001] zone axis (Pbnm). δ‐CsPbI3 is viewed in the [100] zone axis (Pmnb). D) STEM‐ADF images of the γ‐CsPbI3 (top left) and RP defects in Cs‐rich specimens, Cs‐1.1 and Cs‐1.25, viewed in the [11¯0] zone axis. Note, that the highest intensity maxima in the atomic‐number sensitive STEM‐ADF images correspond to columns containing Pb/I atoms (alternating in the beam direction), while the lower and comparable intensity maxima correspond to pure I and pure Cs atom columns.
Figure 2
Figure 2
Quantitative analysis of the atomic structure at and around the Type‐90 RP planar defect. A) STEM‐ADF image of a representative grain oriented in the [11¯0] zone axis in Cs‐1.1 film. B) Atomic‐resolution STEM‐ADF image of the RP defect from the region marked in (A). C) Intensity line profile measured from the rectangular region highlighted in (B). Intensity is integrated across the width of the rectangle to enhance signal. D) Cs displacement vector map calculated from measurements of Cs–Cs column distance in (B) revealing shifts of Cs atoms. E) Atomic model of γ‐CsPbI3 in the [11¯0] zone axis. Yellow ovals indicate the projected shape of Pb/I columns in the tilted octahedra. F) Ellipticity vector map measured from Pb/I columns in (B) revealing relaxation of octahedral tilt. Line direction indicates the orientation of the ellipse major axis. Line length and color indicate the magnitude of ellipticity (major axis/minor axis). G) Measured atomic model of the Type‐90 RP planar defect showing the gap, Cs displacement, octahedral relaxation, and [001]/[110] axis switch.
Figure 3
Figure 3
Analysis of (11¯0) RP planes in CsPbI3. A) Atomic model incorporating all three orthogonal RP planes viewed in the [11¯0] zone axis. B) Atomic model of (11¯0) RP planes viewed in the [11¯0] zone axis. C) Atomic model of (11¯0) RP planes viewed in the [001] zone axis. D) A representative [11¯0] orientated grain containing (11¯0) RP planes. E) Enlarged region free of RP planes. F) Enlarged region containing (11¯0) RP planes. G) A representative [001] orientated grain containing (11¯0) RP planes. H) Enlarged region from the red box in (G). I) Enlarged region from the red box in (H).
Figure 4
Figure 4
Summary of different types of RP planar defects in CsPbI3. A) (001) type‐0 RP defect. B) (110) type‐0 RP defect. C) (001)/(110) type‐90 RP defect. D) (11¯0) type‐0 RP defect.
Figure 5
Figure 5
A–C) Antisite defects at RP turning points in Cs‐1.1 films; STEM‐ADF images showing the PbCs antisite defects at turning points highlighted in red (but absent in blue). A) Type‐0 RP defect. B) Type‐0 RP defect forming a loop. C) Type‐90 RP defect. D) Prevalence of RP planes and RP turning points in different Cs:Pb ratio films.
Figure 6
Figure 6
Insights into RP defect formation. Structure relaxation at a surface and strain at gap‐less (001)/(110) boundary A) STEM‐ADF image of a pinhole in the Cs‐1.1 film in the [11¯0] zone axis. B) STEM‐ADF image of the surface region from the red box marked in (A). C) Cs displacement vector map at the surface in (B), comparable to the RP plane. D) Map of the orientation and magnitude of the ellipse major axis measured from the intensity distribution at Pb/I columns in (B) revealing relaxation of octahedral tilt comparable to RP plane. Line direction indicates the orientation of the ellipse major axis. Line length and color indicate the magnitude of ellipticity (major axis / minor axis). E) STEM‐ADF image of CsPbBr3 film oriented in the [11¯0] zone axis showing a gap‐less (001)/(110) domain boundary. F) A schematic diagram illustrates the lattice mismatch at the domain boundary. G) Lattice strain near the boundary can be measured from the distance of Pb/I columns (denoted as Pb–Pb distance) in directions parallel (defined as the x direction) and perpendicular (defined as the y direction) to the boundary. H) Pb–Pb distance measured in the x direction and I) y direction. J) Pb–Pb distance measurements in (H,I) averaged in the y direction.
Figure 7
Figure 7
Photo‐physical characterization and density‐function theory simulation of CsPbI3. A) Photoluminescence (PL) spectra of 35 nm thick CsPbI3 films of various nominal Cs:Pb ratio co‐deposited on z‐cut quartz substrates, following photo‐excitation with a 398 nm‐wavelength continuous wave laser; B) Time‐correlated single photon counting of the same films, after excitation with a 398 nm‐wavelength pulsed diode laser at a repetition frequency of 10 MHz, and fits (solid lines) to transients with a stretched exponential model; C) Photoconductivity transients measured via time‐resolved microwave conductivity (TRMC) for films excited with a fluence of 32 µJcm−2 (concurrently acquired time‐resolved PL (TRPL) transients are shown in Figure S18, Supporting Information). Films were prepared as described above (Figure 7A), and all photo‐physical measurements were performed with samples held in an N2 atmosphere. TRMC and TRPL transients were simultaneously fitted with a dynamic recombination model, with the results plotted as solid lines; D) The total trap‐mediated recombination rate extracted by fitting the dynamic recombination model to concurrently acquired TRMC and TRPL transients, plotted alongside the prevalence of RP‐turning points as measured via STEM‐ADF, both as a function of the nominal Cs:Pb ratio; E) RP planar defect atomic models; “real” model of Type‐90° defect using measured atomic positions incorporating octahedral relaxation, Cs displacement and 90°crystal rotation, and “naïve model” without octahedral relaxation, Cs displacement (i.e., using same atomic positions as domain interior) nor 90°crystal rotation. F) Calculated DFT bandgaps for real models (black circles) and naïve models (red squares) as a function of the number of octahedral layers in the slab. The bandgap of bulk orthorhombic CsPbI3 is shown in a dotted line for comparison. G) Band structures calculated from DFT, including spin–orbit coupling, of a four‐layer defect interface model and an 8 × 2 × 2 CsPbI3 supercell. Direction Χ to Γ in reciprocal space corresponds to the direction with the largest lattice parameter in real space (perpendicular to the RP defect), while Γ to Y corresponds to an in‐plane direction in real‐space. From left to right are results on the bulk model, Naïve RP model, Type‐0 RP model, and Type‐90 RP model.

References

    1. Green M. A., Ho‐Baillie A., Snaith H. J., Nat. Photonics 2014, 8, 506.
    1. Lin Y. H., Vikram, F. Y. , Cao X. L., Dasgupta A., Oliver R. D. J., Ulatowski A. M., McCarthy M. M., Shen X., Yuan Q., Christoforo M. G., Yeung F. S. Y., Johnston M. B., Noel N. K., Herz L. M., Islam M. S., Snaith H. J., Science 2024, 384, 767. - PubMed
    1. Kim J. Y., Lee J. W., Jung H. S., Shin H., Park N. G., Chem. Rev. 2020, 120, 7867. - PubMed
    1. Correa‐Baena J. P., Saliba M., Buonassisi T., Grätzel M., Abate A., Tress W., Hagfeldt A., Science 2017, 358, 739. - PubMed
    1. Lee J. W., Tan S., Il Seok S., Yang Y., Park N. G., Science 2022, 375, 835. - PubMed

LinkOut - more resources