. 2025 Jul;34(7):e70195.
doi: 10.1002/pro.70195.

Amyloid formation of alternatively spliced variants of α-synuclein

Affiliations

Amyloid formation of alternatively spliced variants of α-synuclein

Daniel Q SanGiovanni et al. Protein Sci. 2025 Jul.

Abstract

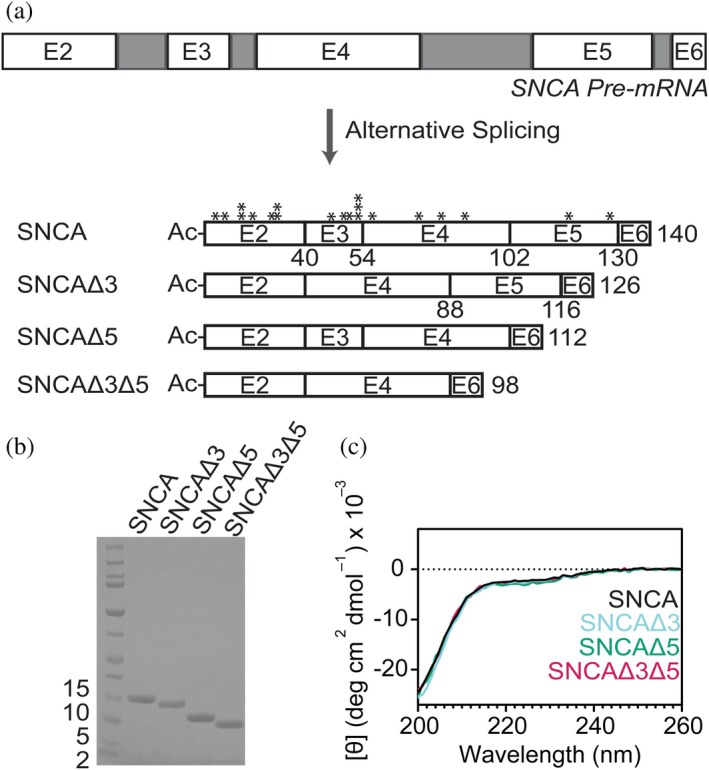
Parkinson's disease, dementia with Lewy bodies, and multiple system atrophy are disorders characterized by the presence of cytosolic α-synuclein (SNCA) amyloids. The gene SNCA is alternatively spliced, generating three variants of SNCA, missing exon 3 (SNCAΔ3) or 5 (SNCAΔ5), or both exons (SNCAΔ3Δ5). Despite purported upregulation in disease states, their pathological relevance is ill-defined. Here, we investigated the amyloid formation of alternatively spliced variants under physiological conditions. Aggregation kinetics, secondary structure, and fibril morphology of N-terminally acetylated SNCAΔ3, SNCAΔ5, and SNCAΔ3Δ5 were assessed by thioflavin-T fluorescence, circular dichroism spectroscopy, and transmission electron microscopy, respectively. Compared to SNCA, both SNCAΔ5 and SNCAΔ3Δ5 aggregate faster and adopt a more twisted fibril morphology, whereas SNCAΔ3 is more sensitive to solution conditions, exhibiting similar or modestly faster aggregation kinetics compared to SNCA. Cross-seeding experiments using spliced-variant fibrils and soluble SNCA showed that despite fibril morphological differences, SNCAΔ5 were competent seeds for SNCA, which is explained by their similar protease-K resistant regions. Contrastingly, neither SNCAΔ3 nor SNCAΔ3Δ5 fibrils cross-seed SNCA, indicating exon 3 (residues 41-54) is essential in modulating fibril structure. Notably, SNCA aggregation is stimulated by sub-stoichiometric amounts of soluble SNCAΔ5 and SNCAΔ3Δ5, but not SNCAΔ3, suggesting that exon 5 (residues 103-130) is more important in modulating aggregation kinetics. Taken together, we propose that alternatively spliced variants are pathogenic by exacerbating aggregation of the main SNCA isoform.

Keywords: Parkinson's disease; aggregation; alternative splicing; amyloid; circular dichroism; electron microscopy; fibril; kinetics; α‐synuclein.


Conflict of interest statement

The authors declare no conflicts of interest.

Figures

FIGURE 1
FIGURE 1
Characterization of N‐terminally acetylated (Ac) alternatively spliced variants of SNCA. (a) Schematic representation of the alternative splicing of the SNCA pre‐mRNA into SNCA and three distinct spliced variants via exon skipping. Exons and introns are colored white and gray, respectively. SNCAΔ3 and SNCAΔ5 lack either exon 3 or exon 5, whereas SNCAΔ3Δ5 lacks exons 3 and 5. Asterisk denotes known familial missense mutations (Fevga et al. 2021). Numbers denote the C‐terminal residue of the exon. (b) SDS‐PAGE (4–12% Bis‐Tris) analysis of purified recombinant full‐length SNCA and spliced variants. Corresponding LC–MS analysis is shown in Figure S1. (c) Comparison of averaged CD spectra of soluble SNCA and spliced variants (n = 3).
FIGURE 2
FIGURE 2
Amyloid formation of alternatively spliced variants under high agitation condition. (a) Comparison of aggregation kinetics monitored by ThT (20 mol%) fluorescence at two protein concentrations (average traces [n = 4] for 100 and 50 μM are shown as solid and dashed lines, respectively) in 20 mM NaPi, 140 mM NaCl, pH 7.4, shaken at 100 rpm and 37°C supplemented with a 2‐mm borosilicate bead. All kinetics data are shown in Figure S2. (b) Representative average CD spectra of insoluble fraction containing SNCA and spliced variant fibrils (n = 3) post‐aggregation. [θ] are in units of deg cm2 dmol−1 (× 10−3). Variants are color‐coded as in (a). (c) Representative TEM images taken of fibrillar SNCA and spliced variants aggregated between concentrations of 100–170 μM with beads. Scale bars are 100 nm. Larger fields of view are shown in Figure S3. (d) Smallest PK‐resistant cores of SNCA and spliced variants determined by LC–MS denoted by the gray box and indicated by the numbers (exact masses and representative SDS‐PAGE gels are shown in Table S1 and Figure S4, respectively).
FIGURE 3
FIGURE 3
Amyloid formation of alternatively spliced variants under low agitation condition. (a) Comparison of aggregation kinetics monitored by ThT (20 mol%) fluorescence at two protein concentrations (average traces [n = 4] for 100 and 50 μM are shown as solid and dashed lines, respectively) in 20 mM NaPi, 140 mM NaCl, pH 7.4, shaken at 100 rpm and 37°C. All kinetics data are shown in Figure S5. (b) Comparison of SNCAΔ5 and SNCAΔ3Δ5 at lower protein concentrations (average traces [n ≥ 5] for 20 and 10 μM are shown as solid and dashed lines, respectively). Variants are color‐coded as in (a). All kinetics data are shown in Figure S6. (c) Representative TEM images of SNCA and spliced variants aggregated in the absence of beads. Scale bars are 100 nm. Larger fields of view are shown in Figure S7.
FIGURE 4
FIGURE 4
Cross‐seeding reactions of soluble SNCA with alternatively spliced variant fibrils. (a) Comparison of aggregation kinetics of SNCA (30 μM) in the presence of 1.5 μM preformed spliced variant fibrils (average of n = 5, in 20 mM NaPi, 140 mM NaCl, pH 7.4, [ThT] = 10 μM). See Figure S12 for all data. Data for 3 μM preformed spliced variant fibrils are shown in Figure S13. Subscript f denotes fibril. Top panels show SDS‐PAGE analysis of soluble (S) and insoluble (I) fractions from ultracentrifugation post‐aggregation of self‐seeded SNCA (left) and SNCA cross‐seeded with 5% SNCAΔ5 (right). (b) Representative CD spectra of insoluble fraction of SNCA seeded by SNCAΔ5. Spectra of self‐seeded and SNCAΔ5 fibrils alone are also shown for comparison (average of n = 3). [Θ] are in units of deg cm2 dmol−1 (×10−3). (c, d) Representative TEM image of self‐seeded SNCA and SNCA cross‐seeded with 5% SNCAΔ5 fibrils. Scale bars are 100 nm. Insets are 2× magnified views within the images.
FIGURE 5
FIGURE 5
Co‐mixing reactions of soluble SNCA with alternatively spliced variant monomer. (a) Comparison of aggregation kinetics of SNCA (25 μM) in the presence of 25 μM spliced variant monomer (indicated as 1:1, an average of n ≥ 3) in 20 mM NaPi, 140 mM NaCl, pH 7.4, [ThT] = 5 μM. Top panels show SDS‐PAGE analysis of soluble (S) and insoluble (I) fractions after ultracentrifugation post‐aggregation of SNCA alone, SNCA co‐mixed with 25 μM SNCAΔ3, SNCAΔ5, and SNCAΔ3Δ5 (from left to right and colored as in the right panel). (b) Comparison of aggregation kinetics of SNCA (25 μM) in the presence of 5 μM spliced variant monomer (indicated as 5:1, average of n ≥ 3) in 20 mM NaPi, 140 mM NaCl, pH 7.4, [ThT] = 5 μM. See Figure S14 for all kinetics data. Top panels show SDS‐PAGE analysis of soluble (S) and insoluble (I) fractions after ultracentrifugation post‐aggregation of SNCA alone, SNCA co‐mixed with 5 μM SNCAΔ3, SNCAΔ5, and SNCAΔ3Δ5 (from left to right and colored as in the right panel). (c) Representative TEM images of SNCA co‐mixed with SNCAΔ5 (right panels) and SNCA co‐mixed with SNCAΔ3Δ5 in a 1:1 (top) and 5:1 (top) ratio. Scale bar are 100 nm. Insets are 2× magnified view within the images.

References

    1. Anderson JP, Walker DE, Goldstein JM, de Laat R, Banducci K, Caccavello RJ, et al. Phosphorylation of Ser‐129 is the dominant pathological modification of α‐synuclein in familial and sporadic Lewy body disease. J Biol Chem. 2006;281:29739–29752. - PubMed
    1. Apffel A, Fischer S, Goldberg G, Goodley PC, Kuhlmann FE. Enhanced sensitivity for peptide mapping with electrospray liquid chromatography‐mass spectrometry in the presence of signal suppression due to trifluoroacetic acid‐containing mobile phases. J Chromatogr A. 1995;712:177–190. - PubMed
    1. Bell R, Castellana‐Cruz M, Nene A, Thrush RJ, Xu CK, Kumita JR, et al. Effects of N‐terminal acetylation on the aggregation of disease‐related α‐synuclein variants. J Mol Biol. 2023;435:167825. - PubMed
    1. Bell R, Thrush RJ, Castellana‐Cruz M, Oeller M, Staats R, Nene A, et al. N‐terminal acetylation of α‐synuclein slows down its aggregation process and alters the morphology of the resulting aggregates. Biochemistry. 2022;61:1743–1756. - PMC - PubMed
    1. Bertoncini CW, Jung YS, Fernandez CO, Hoyer W, Griesinger C, Jovin TM, et al. Release of long‐range tertiary interactions potentiates aggregation of natively unstructured α‐synuclein. Proc Natl Acad Sci U S A. 2005;102:1430–1435. - PMC - PubMed