. 2025 Jun 16:13:RP97036.
doi: 10.7554/eLife.97036.

Rate of brain aging associates with future executive function in Asian children and older adults

Affiliations

Rate of brain aging associates with future executive function in Asian children and older adults

Susan F Cheng et al. Elife. .

Abstract

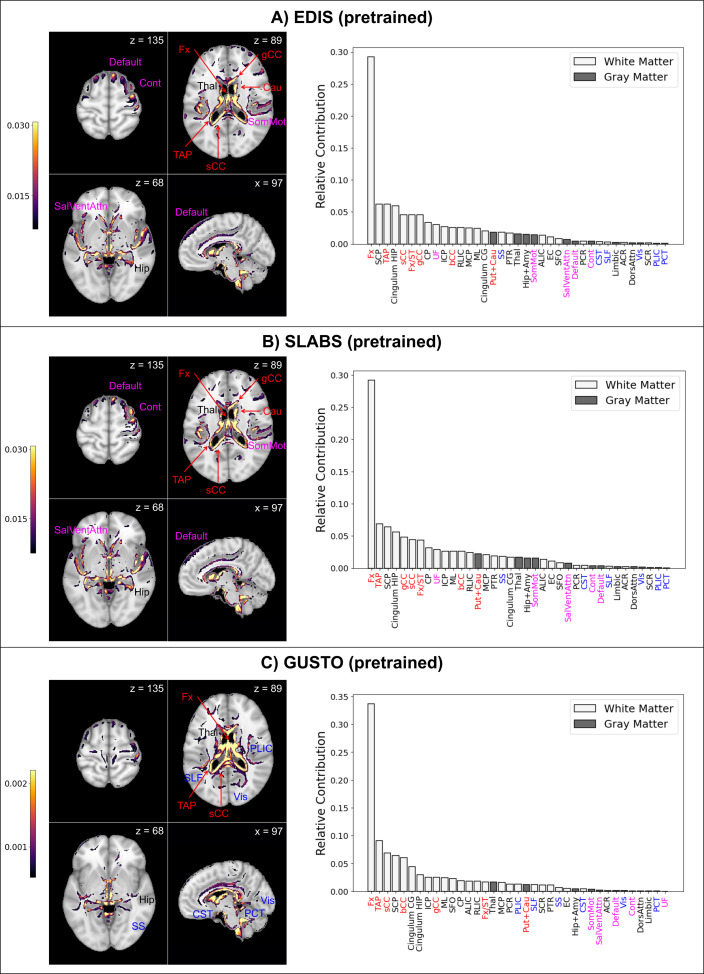
Brain age has emerged as a powerful tool to understand neuroanatomical aging and its link to health outcomes like cognition. However, there remains a lack of studies investigating the rate of brain aging and its relationship to cognition. Furthermore, most brain age models are trained and tested on cross-sectional data from primarily Caucasian, adult participants. It is thus unclear how well these models generalize to non-Caucasian participants, especially children. Here, we tested a previously published deep learning model on Singaporean elderly participants (55-88 years old) and children (4-11 years old). We found that the model directly generalized to the elderly participants, but model finetuning was necessary for children. After finetuning, we found that the rate of change in brain age gap was associated with future executive function performance in both elderly participants and children. We further found that lateral ventricles and frontal areas contributed to brain age prediction in elderly participants, while white matter and posterior brain regions were more important in predicting brain age of children. Taken together, our results suggest that there is potential for generalizing brain age models to diverse populations. Moreover, the longitudinal change in brain age gap reflects developing and aging processes in the brain, relating to future cognitive function.

Keywords: T1-weighted MRI; aging; brain age; development; human; longitudinal; machine learning; neuroscience.


Conflict of interest statement

SC, WY, KN, XQ, SL, TT, KN, RL, SH, CC, AT, EL, PG, CC, YC, MM, MC, BY No competing interests declared, JZ Reviewing editor, eLife

Figures

Figure 1.
Figure 1.. Study design schematic.
(A, B) T1 MRI scans were minimally preprocessed according to the simple fully convolutional network (SFCN) pipeline (Leonardsen et al., 2022). These were (a) directly input into the pretrained brain age model or (b) split into 10 cross-validation folds to finetune the model. The finetuned model transferred the weights from the pretrained model for initialization. All layers were then retrained. Age predictions were obtained on the test folds. BAG was calculated by subtracting chronological age from predicted age. Model interpretability was interrogated using guided backpropagation. (C) Cross-sectional and longitudinal association of BAG and cognitive performance were tested using multiple linear regression models in both elderly and children. Time intervals for BAG and cognition, based on data availability, are shown schematically. Annual rate of change was calculated from a linear regression with time for each participant. All models included chronological age and sex as covariates.:^ models for elderly also included years of education as a covariate;* models with (annual rate of) change in BAG also included baseline BAG as a covariate. EDIS, Epidemiology of Dementia in Singapore; SLABS, Singapore-Longitudinal Aging Brain Study; GUSTO, Growing Up in Singapore Towards healthy Outcomes; BAG, brain age gap.
Figure 2.
Figure 2.. The pretrained brain age model performs well in elderly participants, while the finetuned model performs well in both elderly participants and children.
Black identity lines representing perfect prediction are included for reference. (A) Predicted brain ages from the pretrained model are plotted against chronological age. They are highly correlated for EDIS and SLABS (elderly), but not GUSTO (children). (B) Predicted brain ages from the finetuned model are plotted against chronological age. They are highly correlated in all three datasets. EDIS, Epidemiology of Dementia in Singapore; SLABS, Singapore-Longitudinal Aging Brain Study; GUSTO, Growing Up in Singapore Towards healthy Outcomes; N, number of participants; r, Pearson’s correlation coefficient; MAE, mean absolute error; NCI, no cognitive impairment; CIND, cognitive impairment no dementia.
Figure 2—figure supplement 1.
Figure 2—figure supplement 1.. Variance of finetuned predicted ages by age group in Growing Up in Singapore Towards healthy Outcomes GUSTO.
Figure 3.
Figure 3.. BAG from the pretrained model is negatively associated with executive function in elderly participants.
Bolded p-values indicate significance after Holm-Bonferroni correction (pcorr<0.05). All models include chronological age, sex, and years of education as covariates. Models with change in BAG also include baseline BAG as a covariate. Results are similar after finetuning (Figure 3—figure supplement 1). (A) Partial regression plot between baseline BAG and executive function in EDIS, colored by cognitive status. A significant negative association is observed. (B) Partial regression plot between baseline BAG and long-term rate of change in executive function (mean follow-up time = years) in SLABS. A negative association is observed, but it is not significant after correcting for multiple comparisons. (C) Partial regression plot of early longitudinal rate of change in BAG (mean follow-up time = years) when added to the model in (B). A significant negative association and increase in R2 is observed. (D) Partial regression plot as in (C), but with future rate of change in executive function (mean follow-up time = years), removing the overlap with early change in BAG. A significant negative association is again observed. N, number of participants; β, standardized regression coefficient; p, p-value for variable of interest (x-axis); ΔRadj2, change in adjusted R2 when adding variable of interest; BAG, brain age gap; NCI, no cognitive impairment; CIND, cognitive impairment no dementia; EDIS, Epidemiology of Dementia in Singapore; SLABS – Singapore-Longitudinal Aging Brain Study.
Figure 3—figure supplement 1.
Figure 3—figure supplement 1.. Brain age gap from the finetuned model remains negatively associated with executive function in elderly.
Compare to Figure 3A–D. (A) EDIS dataset: baseline BAG relates to baseline execituve function. (B) SLABS dataset: Baseline BAG does not relate to future changes in executive function. (C, D) SLABS dataset: Change in BAQ relates to future changes in executive function (non-overlapping in C and overlaping in D).
Figure 4.
Figure 4.. Longitudinal BAG from the finetuned model is positively associated with inhibition in children.
Bolded p-values indicate significance after Holm–Bonferroni correction (pcorr<0.05). All models include chronological age and sex as covariates. Models with change in BAG also include baseline BAG as a covariate. (A) Partial regression plot between baseline BAG (calculated from 4.5 or 6.0 years old) and future NEPSY-II inhibition scaled subscore (measured at 8.5 years old). No significant association is observed. (B) Partial regression plot of early longitudinal rate of change in BAG calculated from 4.5 to 7.5 years old (mean follow-up time = 2.4 ± 0.7 years) when added to the model in (A). A significant positive association and increase in R2 is observed. N, number of participants; β, standardized regression coefficient; p, p-value for variable of interest (x-axis); ΔRadj2 , change in adjusted R2 when adding variable of interest; BAG, brain age gap; GUSTO, Growing Up in Singapore Towards healthy Outcomes.
Figure 4—figure supplement 1.
Figure 4—figure supplement 1.. Brain age gap (BAG) from the pretrained model is not associated with inhibition in children.
Estimated BAGs > 2 are not shown for visual clarity. Compare to Figure 4A and B.
Figure 4—figure supplement 2.
Figure 4—figure supplement 2.. Baseline BAG is not associated with baseline IQ in children.
Both brainage and IQ were measured cross-sectionally at 4.5 years old. (A) Partial regression plot with baseline BAG from the pretrained model. Estimated BAGs > 2 are not shown for visual clarity. No significant relationship is observed. (B) Partial regression plot with baseline BAG from the finetuned model. No significant relationship is observed. N, number of participants; β, standardized regression coefficient; p, p-value for variable of interest (x-axis); Multiple R2, coefficient of determination; GUSTO, Growing Up in Singapore Towards healthy Outcomes; BAG, brain age gap; KBIT-2, Kaufman Brief Intelligence Test Second Edition.
Figure 5.
Figure 5.. Finetuned brain age models focus on distinct features in children and elderly participants.
The top 10% of features are shown for four representative brain slices on the left. Relative contributions for gray and white matter features across the whole brain are shown on the right. Regions near the lateral ventricles are labeled in red. Features more prominent in elderly than children are labeled in magenta, while features more prominent in children than elderly are labeled in blue. Features and relative contributions are generally consistent between (A) EDIS and (B) SLABS, but key differences can be seen in (C) GUSTO. EDIS, Epidemiology of Dementia in Singapore; SLABS, Singapore-Longitudinal Aging Brain Study; GUSTO,Growing Up in Singapore Towards healthy Outcomes; MCP,–middle cerebellar peduncle; PCT, Pontine crossing tract; gCC, genu of corpus callosum; bCC, body of corpus callosum; sCC, splenium of corpus callosum; Fx, fornix (column and body); CST, corticospinal tract; ML, medial lemniscus; ICP, inferior cerebellar peduncle; SCP, superior cerebellar peduncle; CP, cerebral peduncle; ALIC, anterior limb of internal capsule; PLIC, posterior limb of internal capsule; RLIC, retrolenticular part of internal capsule; ACR, anterior corona radiata; SCR, superior corona radiata; PCR, posterior corona radiata; PTR, posterior thalamic radiation; SS, sagittal stratum; EC, external capsule; cingulum CG, cingulum (cingulate gyrus); cingulum HIP, cingulum (hippocampus); Fx/ST, fornix (cres)/stria terminalis; SLF, superior longitudinal fasciculus; SFO, superior fronto-occipital fasciculus; UF, uncinate fasciculus; TAP, tapetum; Vis, visual network; SomMot, somatomotor network; DorsAttn, dorsal attention network; SalVentAttn, salience/ventral attention network; Limbic, limbic network; Cont , control/frontoparietal network; Default, default mode network; Hip+Amy, hippocampus + amygdala; Put+Cau, putamen + caudate; Tha l, thalamus.
Figure 5—figure supplement 1.
Figure 5—figure supplement 1.. Pretrained models focus on similar features as finetuned models in EDIS and SLABS, but not in GUSTO.
Compare to Figure 5A–C. Features more prominent in elderly than children are labeled in magenta, while features more prominent in children than elderly are labeled in blue. Features and relative contributions are generally consistent between (A) EDIS and (B) SLABS, but key differences can be seen in (C) GUSTO.EDIS, Epidemiology of Dementia in Singapore; SLABS, Singapore-Longitudinal Aging Brain Study; GUSTO, Growing Up in Singapore Towards healthy Outcomes.
Appendix 1—figure 1.
Appendix 1—figure 1.. Example learning curves from (A) tuning the last layer only on Growing Up in Singapore Towards healthy Outcomes (GUSTO), showing underfitting; (B) tuning all layers on GUSTO, showing in stability; (C) using a cosine learning rate decay, showing a good fit (D) using the same parameters on Epidemiology of Dementia in Singapore (EDIS),showing ‘forgetting’; (E) using a lower initial learning rate(1e-4) on EDIS, showing a better fit; and (F) using an initial learning rate of 1e-6, showing underfitting.
Author response image 1.
Author response image 2.
Author response image 2.. Brain age predictions on unseen Caucasian sample of older adults.
Predictions from the (A) pretrained and (B) finetuned brain age models on ADNI participants. Compare to Figure 2 of the main text.

Update of

  • doi: 10.1101/2023.11.27.568184
  • doi: 10.7554/eLife.97036.1
  • doi: 10.7554/eLife.97036.2

Similar articles

Cited by

References

    1. Abadi M, Agarwal A, Barham P. TensorFlow: Large-scale machine learning on heterogeneous distributed systems. arXiv. 2015 doi: 10.48550/arXiv.1603.04467. - DOI
    1. Avants B, Tustison NJ, Song G. Advanced Normalization Tools: V1.0. The Insight Journal. 2008 doi: 10.54294/uvnhin. - DOI
    1. Baecker L, Garcia-Dias R, Vieira S, Scarpazza C, Mechelli A. Machine learning for brain age prediction: Introduction to methods and clinical applications. EBioMedicine. 2021;72:103600. doi: 10.1016/j.ebiom.2021.103600. - DOI - PMC - PubMed
    1. Bagautdinova J, Bourque J, Sydnor VJ, Cieslak M, Alexander-Bloch AF, Bertolero MA, Cook PA, Gur RC, Gur RE, Larsen B, Moore TM, Radhakrishnan H, Roalf DR, Shinohara RT, Tapera TM, Zhao C, Sotiras A, Davatzikos C, Satterthwaite TD. Development of White Matter Fiber Covariance Networks Supports Executive Function in Youth. bioRxiv. 2023 doi: 10.1101/2023.02.09.527696. - DOI - PMC - PubMed
    1. Bashyam VM, Erus G, Doshi J, Habes M, Nasrallah I, Truelove-Hill M, Srinivasan D, Mamourian L, Pomponio R, Fan Y, Launer LJ, Masters CL, Maruff P, Zhuo C, Völzke H, Johnson SC, Fripp J, Koutsouleris N, Satterthwaite TD, Wolf D, Gur RE, Gur RC, Morris J, Albert MS, Grabe HJ, Resnick S, Bryan RN, Wolk DA, Shou H, Davatzikos C. MRI signatures of brain age and disease over the lifespan based on a deep brain network and 14 468 individuals worldwide. Brain. 2020;143:2312–2324. doi: 10.1093/brain/awaa160. - DOI - PMC - PubMed