. 2025 Jun 16:13:RP102676.
doi: 10.7554/eLife.102676.

CARD8 inflammasome activation during HIV-1 cell-to-cell transmission

Affiliations

CARD8 inflammasome activation during HIV-1 cell-to-cell transmission

Jessie Kulsuptrakul et al. Elife. .

Abstract

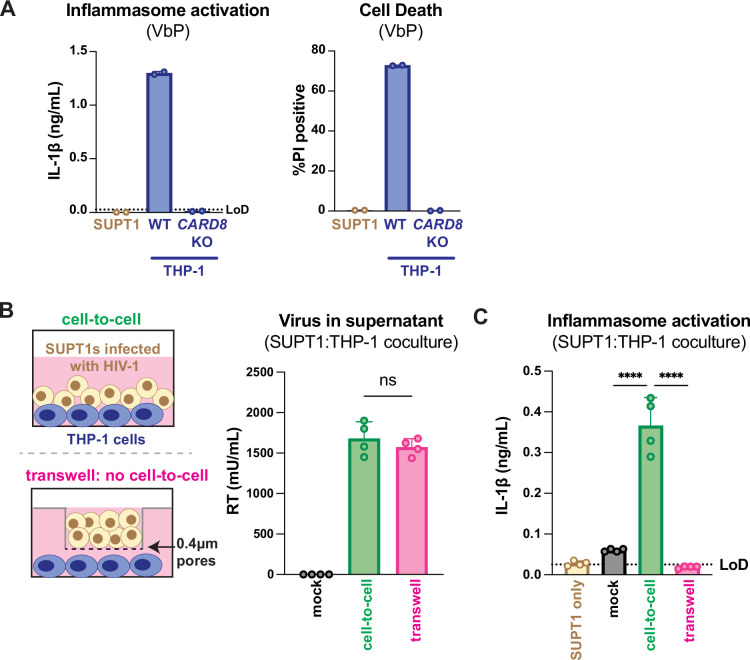
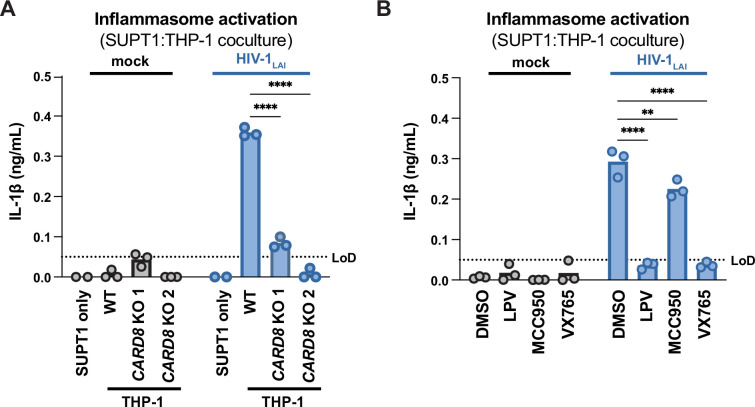
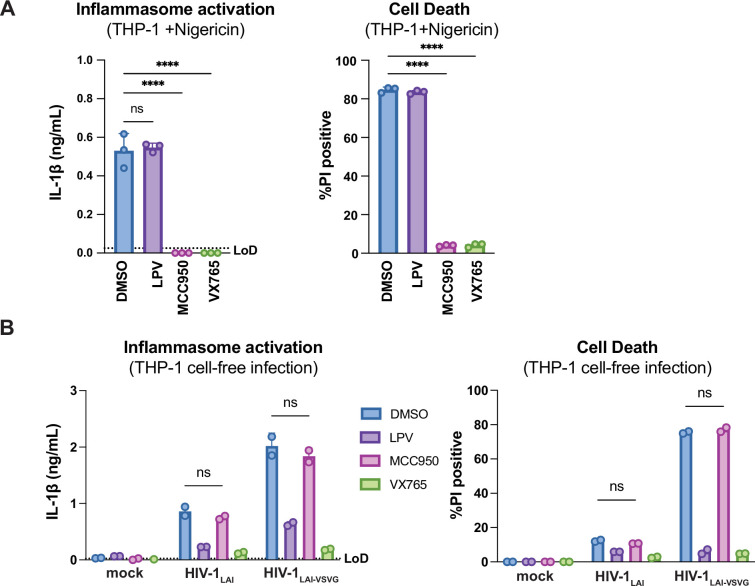
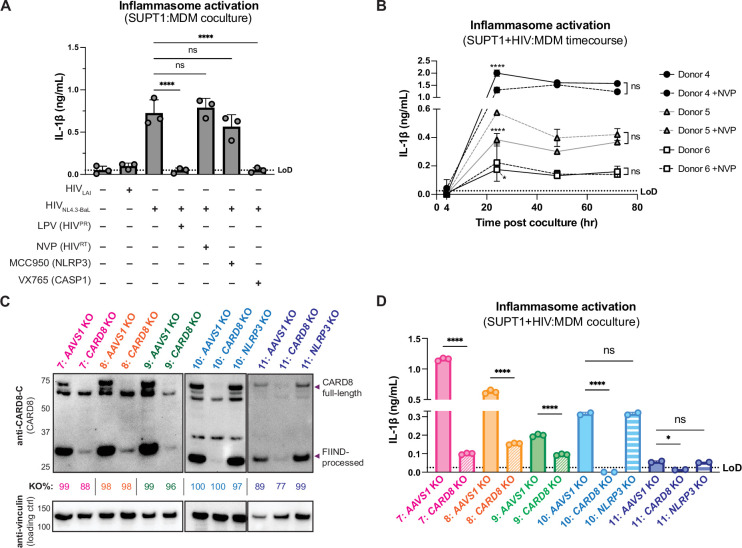
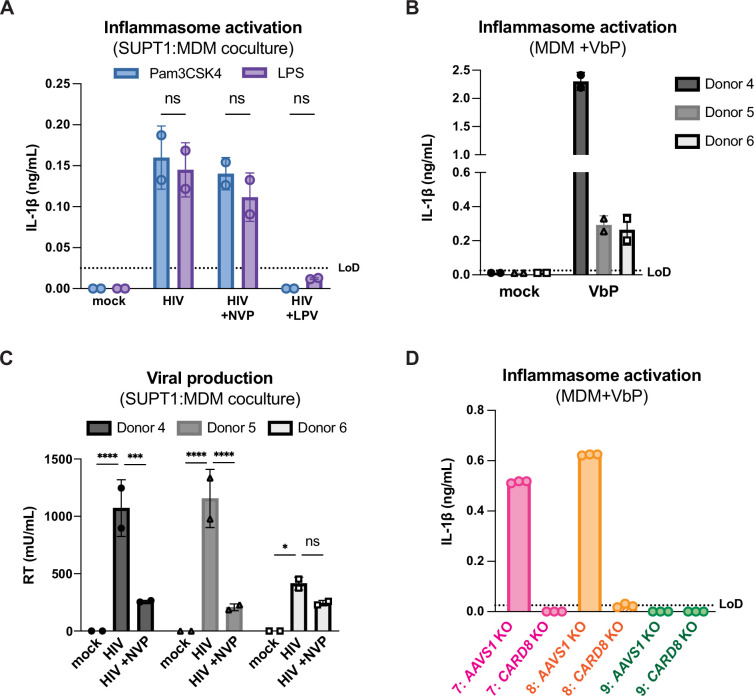
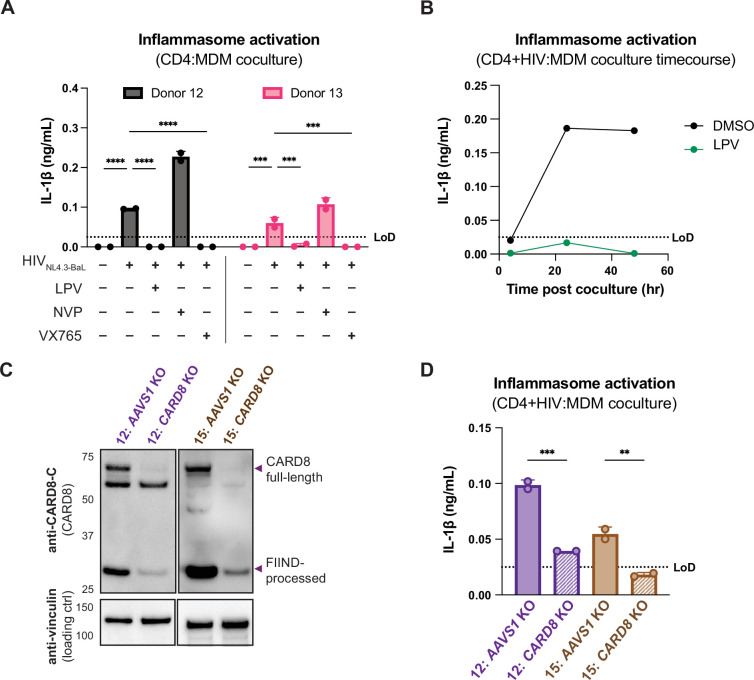
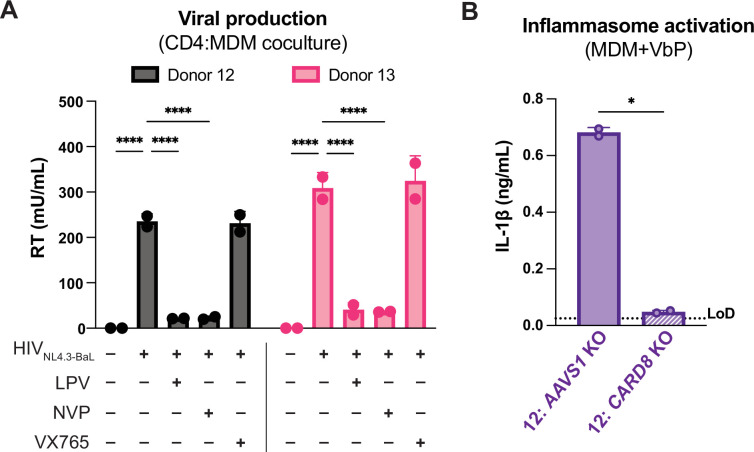
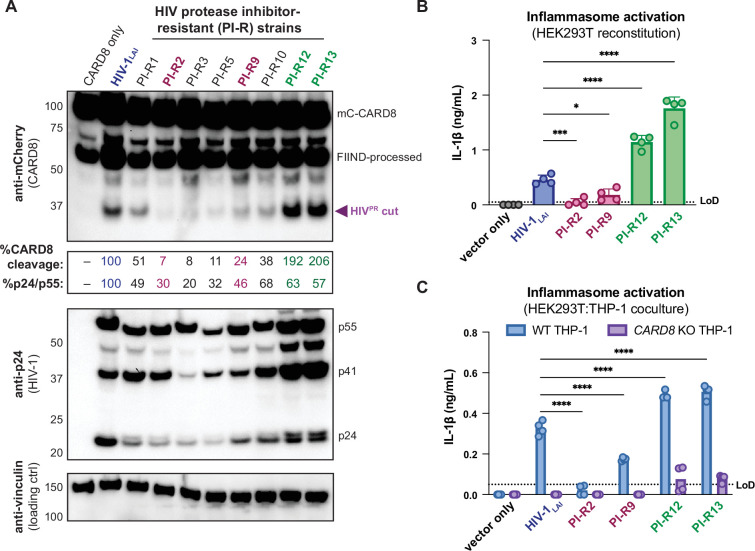
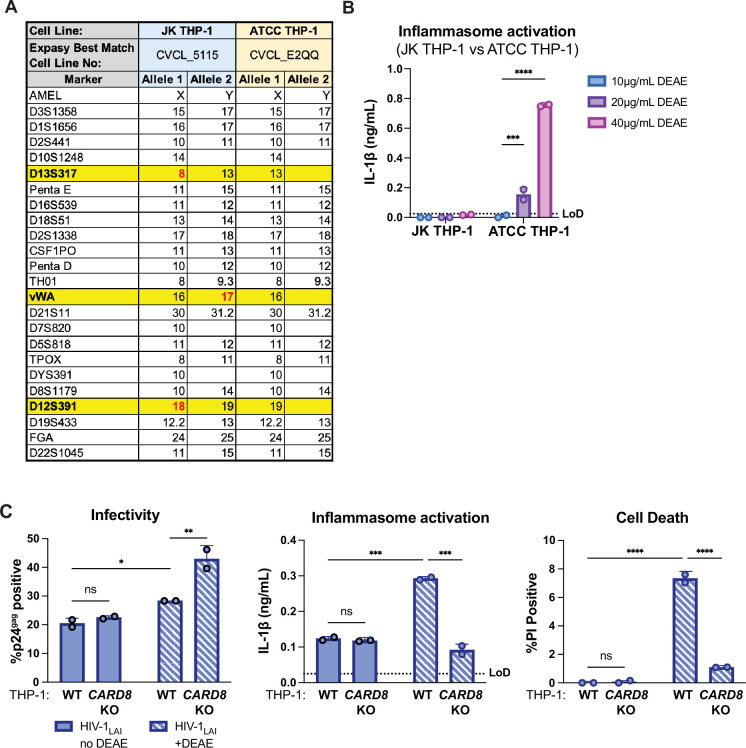
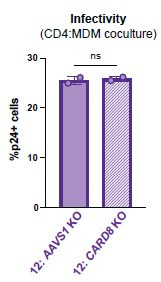
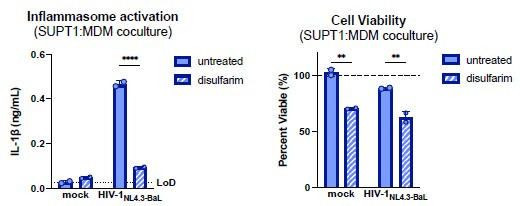
Our previous work demonstrated that CARD8 detects HIV-1 infection by sensing the enzymatic activity of the HIV protease, resulting in CARD8-dependent inflammasome activation (Kulsuptrakul et al., 2023). CARD8 harbors a motif in its N-terminus that functions as a HIV protease substrate mimic, permitting innate immune recognition of HIV-1 protease activity, which when cleaved by HIV protease triggers CARD8 inflammasome activation. Here, we sought to understand CARD8 responses in the context of HIV-1 cell-to-cell transmission via a viral synapse. We observed that cell-to-cell transmission of HIV-1 between infected T cells and primary human monocyte-derived macrophages induces CARD8 inflammasome activation in a manner that is dependent on viral protease activity and largely independent of the NLRP3 inflammasome. Additionally, to further evaluate the viral determinants of CARD8 sensing, we tested a panel of HIV protease inhibitor-resistant clones to establish how variation in HIV protease affects CARD8 activation. We identified mutant HIV-1 proteases that differentially cleave and activate CARD8 compared to wildtype HIV-1, thus indicating that natural variation in HIV protease affects not only the cleavage of the viral Gag-Pol polyprotein but also likely impacts innate sensing and inflammation.

Keywords: CARD8; HIV-1; cell-to-cell; human; immunology; infectious disease; inflammasome; inflammation; microbiology; viral protease; viruses.


Conflict of interest statement

JK, ME, PM No competing interests declared

Figures

Figure 1.
Figure 1.. HIV-1 cell-to-cell infection induces inflammasome activation.
(A) SUPT1 or THP-1 cells were primed with Pam3CSK4 (500ng/mL) overnight then treated with 5 μM ValboroPro (VbP) for 24 hours, then assessed for IL-1β secretion and cell death via propidium iodide (PI) uptake. %PI positive was normalized to mock-infected controls. (B) (left) Schematic illustrating the experimental setup for SUPT1:THP-1 cell coculture either with (bottom) or without (top) a transwell. (right) SUPT1 cells were either mock-infected or infected with HIV-1LAI then cocultured with primed WT THP-1 cells (see Methods) 20 hours post infection. Mock- or HIV-1LAI-infected SUPT1 cells were either mixed with the THP-1 cells or put in a transwell with a virus-permeable membrane as shown in panel (B) (left). Supernatant in the cell-to-cell condition and in the supernatant outside of the transwell were sampled and measured for released HIV virions via a reverse transcriptase (RT) assay or (C) IL-1β secretion 3 days after starting the coculture. Dotted line indicates limit of detection (LoD). Datasets represent mean ± SD (A: n=2; B, C n=4 biological replicates). One-way ANOVA with (B) Tukey’s or (C) Dunnett’s test using GraphPad Prism 10. ns = not significant, *p<0.05, **p<0.01, ***p<0.001, ****p<0.0001.
Figure 2.
Figure 2.. HIV-1 cell-to-cell transmission induces CARD8-dependent activation largely independent of NLRP3.
(A) SUPT1 cells were either mock-infected or infected with HIV-1LAI for 18–20 hours prior to coculture with wildtype (WT) or CARD8 knockout (KO) THP-1 cells. The coculture was harvested 72 hours later to probe for IL-1β secretion in the coculture supernatant via IL-1R reporter assay. THP-1 cells were primed with Pam3CSK4 (500ng/mL) for 16–24 hours prior to coculture. SUPT1 cells were infected with HIV-1LAI such that 30% of the cells were positive for intracellular p24gag after 18–20 hours. (B) SUPT1 cells were either mock- or HIV-1LAI-infected as in (A) for 18–20 hours then incubated in DMSO, lopinavir (LPV), MCC950, or VX765 at 0.01%, 5 μM, 10μM, or 1μg/mL, respectively, for 15 minutes prior to coculturing with primed WT THP-1 cells. The coculture was assessed for subsequent inflammasome activation after 72 hours as in (A). Dotted line indicates limit of detection (LoD). Datasets represent mean ± SD (n=3 biological replicates). Two-way ANOVA with Dunnett’s test using GraphPad Prism 10. ns = not significant, *p<0.05, **p<0.01, ***p<0.001, ****p<0.0001.
Figure 2—figure supplement 1.
Figure 2—figure supplement 1.. HIV-dependent inflammasome activation is largely NLRP3-independent.
(A) Wildtype THP-1 cells were pre-treated with either DMSO, lopinavir (LPV), MCC950, or VX765 at 0.01%, 5 μM, 10μM, or 1μg/mL, respectively, for 15 minutes prior to 4-hour treatment with 5μg/mL nigericin. Subsequent inflammasome activation was assessed via (A, left) IL-1β secretion via IL-1R reporter assay and (A, right) cell death via propidium iodide (PI) dye uptake. (B) Wildtype THP-1 cells were pre-treated with indicated inhibitors as in (A) then infected with either HIV-1LAI or VSV-G pseudotyped HIV-1LAI (HIV-1LAI-VSVG) in the presence of 10μg/mL DEAE-dextran such that both HIV-1LAI-infected and HIV-1LAI-VSVG -infected cells were ~30% positive for intracellular p24gag after 24 hours by flow cytometry. Subsequent inflammasome activation was assessed 24 hours post infection via IL-1β secretion and cell death as in (A). Dotted line indicates limit of detection (LoD). Datasets represent mean ± SD (A: n=3, B: n=2 biological replicates). One-way (A) or two-way (B) ANOVA with Dunnett’s test using GraphPad Prism 10. ns = not significant, *p<0.05, **p<0.01, ***p<0.001, ****p<0.0001.
Figure 3.
Figure 3.. Cell-to-cell HIV infection induces CARD8-dependent inflammasome activation in monocyte-derived macrophages (MDMs).
(A) MDMs from three independent donors were cocultured with SUPT1 cells expressing CCR5 (SUPT1-CCR5) that were mock-, HIV-1LAI-, or HIV-1NL4.3-BaL-infected then assayed for inflammasome activation 48 hours post coculture for IL-1β secretion. Fifteen minutes before starting the coculture, SUPT1-CCR5 cells infected with HIV-1NL4.3-BaL were pre-treated with either DMSO, lopinavir (5μM), nevirapine (50 μM), MCC950 (10 μM), or VX765 (1μg/mL), inhibiting HIV-1 protease (HIVPR), HIV-1 reverse transcriptase (HIVRT), NLRP3, or caspase 1 (CASP1), respectively. (B) MDMs from three independent donors were cocultured with SUPT1-CCR5 cells infected with HIV-1NL4.3-BaL in either the presence or absence of nevirapine (NVP). Supernatant was harvested at 4, 24, 48, or 72 hours to assay for IL-1β secretion. (C) MDMs from five independent donors were knocked out (KO) for AAVS1 CARD8, or NLRP3 using a Synthego gene KO kit then immunoblotted using an anti-CARD8 antibody or anti-vinculin. Full-length and FIIND-processed CARD8 intermediates are marked with a purple arrow. Size is indicated in kDa on left side of blot. Table between CARD8 and vinculin blot shows Synthego gene KO% scores for each donor KO line. (D) AAVS1, CARD8 or NLRP3 KO MDM lines from (C) were primed with Pam3CSK4 (500 ng/mL) overnight and then cocultured with SUPT1-CCR5 cells mock-, or HIV-1NL4.3-BaL-infected then assayed for inflammasome activation 48 hours post coculture for IL-1β secretion. For all SUPT1:MDM experiments, SUPT1-CCR5 cells were infected with HIV-1LAI or HIV-1NL4.3-BaL such that 5–20% of cells were positive for intracellular p24gag after 20 hours. IL-1 levels shown were normalized to the SUPT1 mock-infected coculture control. Dotted line indicates limit of detection (LoD). Datasets represent mean ± SD (A: n=3 independent donors, B: n=2 biological replicates for each donor, D: n=3 technical replicates per donor). One-way ANOVA with (A) Tukey’s or (D) Sidak’s test or (B) two-way ANOVA with Tukey’s test using GraphPad Prism 10. ns = not significant, *p<0.05, **p<0.01, ***p<0.001, ****p<0.0001.
Figure 3—figure supplement 1.
Figure 3—figure supplement 1.. Cell-to-cell HIV infection induces CARD8-dependent activation in monocyte-derived macrophages (MDMs).
(A) MDMs from donor 6 were primed with either 500ng/mL Pam3CSK4 or 5μg/mL LPS then cocultured with SUPT1-CCR5 cells that had been infected with HIV-1NL4.3-BaL 24 hours prior to coculture. Each coculture was started in the presence of DMSO, nevirapine (NVP) or lopinavir (LPV). Supernatant was harvested 72 hours post coculture to assay for IL-1β secretion. (B) MDMs from the same three independent blood donors assayed in Figure 3B were primed overnight with Pam3CSK4 then treated with 10μM VbP for 24 hours before assaying for IL-1β secretion via IL-1 reporter assay. (C) Supernatant from SUPT1:MDM coculture experiment done in Figure 3B was harvested at 48 hours post coculture to assay for infectious virions via reverse transcriptase (RT) assay. (D) AAVS1 or CARD8 KO MDMs from donors 7–9 assayed in Figure 3C were primed and treated with VbP for 24 hours then assayed for IL-1β secretion. IL-1 levels from VbP treatment were normalized to untreated mock control. Dotted line indicates limit of detection (LoD). Datasets represent mean ± SD (A: n=2 biological replicates for one donor, B, C: n=2 technical replicates for each independent donor, D: n=3 technical replicates per donor). Two-way ANOVA with (A) Sidak’s or (C) Dunnett’s test using GraphPad Prism 10. ns = not significant, *p<0.05, **p<0.01, ***p<0.001, ****p<0.0001.
Figure 4.
Figure 4.. Primary CD4+ T cell:MDM coculture elicits CARD8-dependent inflammasome activation.
(A) CD4+ T cells from a blood donor were isolated, activated, and either mock-infected or infected with HIV-1NL4.3-BaL for 3 days such that ~10% of cells were positive for intracellular p24gag. Monocyte-derived macrophages (MDMs) were primed with Pam3CSK4 then cocultured with mock- or HIV-1-infected primary CD4 T cells in the presence or absence of lopinavir (LPV), nevirapine (NVP), or VX765, inhibiting HIV protease, reverse transcriptase, or caspase 1, respectively. Supernatants were harvested 3 days post coculture to assay for IL-1β secretion via IL-1 reporter assay. (B) CD4+ T cells from donor 12 and MDMs from donor 14 were cocultured as in (A) in the presence or absence of LPV. Supernatant was harvested at 4, 24 and 48 hours post coculture to probe for IL-1β secretion. (C) AAVS1 or CARD8 MDM KOs were immunoblotted using an anti-CARD8 antibody or anti-vinculin. Full-length and FIIND-processed CARD8 intermediates are marked with a purple arrow. Size is indicated in kDa on left side of blot. (D) AAVS1 or CARD8 KO MDMs from (C) were cocultured with CD4+ T cells infected with HIV-1NL4.3-BaL then assayed for IL-1β secretion 48 hours post coculture. The donor 12 cocultures consisted of autologous CD4s and MDMs, whereas the MDMs from donors 13–15 were cocultured with donor 12 CD4s. Dotted line indicates limit of detection (LoD). Datasets represent mean ± SD (A, D: n=2 technical replicates for each donor, B: n=3 technical replicates for one donor). (A) Two-way ANOVA with Tukey’s test (D) One-way ANOVA with Sidak’s test using GraphPad Prism 10. ns = not significant, *p<0.05, **p<0.01, ***p<0.001, ****p<0.0001.
Figure 4—figure supplement 1.
Figure 4—figure supplement 1.. Primary CD4 T cell:MDM coculture elicits CARD8-dependent inflammasome activation.
(A) Supernatant was harvested 72 hours post coculture from coculture described in Figure 4A then assayed for infectious virions via reverse transcriptase (RT) assay. (B) AAVS1 or CARD8 KO MDMs from donor 12 were primed with Pam3CSK4 then treated with VbP for 24 hours and probed for IL-1β secretion. (n=2 technical replicates for each donor). (A) Two-way ANOVA with Tukey’s test (B) One-way ANOVA with Sidak’s test using GraphPad Prism 10. ns = not significant, *p<0.05, **p<0.01, ***p<0.001, ****p<0.0001.
Figure 5.
Figure 5.. Protease inhibitor-resistant strains of HIV-1 differentially cleave and activate CARD8.
(A) HEK293T cells were transfected with a construct encoding CARD8 with an N-terminal mCherry tag (mCherry-CARD8) and indicated HIV-1 proviral constructs. Protease inhibitor-resistant (PI-R) clones of HIV-1 are a subset of a panel expressing prototypical multidrug resistant HIV-1 protease (HIVPR) in an NL4.3 backbone (Supplementary file 1). Top: immunoblotting using anti-mCherry antibody to detect mCherry-CARD8. The full-length (mC-CARD8) and FIIND-processed bands are indicated as well as the HIVPR cut product. Size is indicated in kDa on left side of blot. The band at ~45 kDa is the result of cleavage by the 20S proteasome (Hsiao et al., 2022). % CARD8 cleavage was calculated by quantifying the HIVPR cut band relative to the HIV-1LAI control using BioRad Image Lab 6. Middle: immunoblotting with an anti-p24gag antibody showing HIV-1gag cleavage products p41gag and p24gag, and/or full-length HIV-1gag, p55gag. %p24/p55 was calculated from the ratio of p24gag versus p55gag product by quantifying the volume of the p24gag bands versus the p55gag band relative to the HIV-1LAI control using BioRad Image lab 6. Bottom: immunoblotting with an anti-vinculin antibody to detect vinculin as a loading control. (B) HEK293T cells were transfected with human caspase 1 and human pro-IL-1β, and either carrier vector or indicated HIV-1 proviruses then probed for IL-1β secretion 24 hours post-transfection via IL-1R reporter assay. (C) HEK293T cells were transfected with indicated HIV-1 proviruses (300ng). 24 hours post-transfection either wildtype (WT) or CARD8 knockout (KO) THP-1s were overlayed on the transfected HEK293T cells in a 1:1 ratio. THP-1s were primed with Pam3CSK4 overnight prior to coculture. Supernatants were harvested 24 hours post coculture to assay for IL-1β secretion as in (B). Dotted line indicates limit of detection (LoD). Datasets represent mean ± SD (n=4 biological replicates). p-Values were determined by two-way ANOVA with Dunnett’s test using GraphPad Prism 10. ns = not significant, *p<0.05, **p<0.01, ***p<0.001, ****p<0.0001.
Appendix 1—figure 1.
Appendix 1—figure 1.. Characterization of THP-1 cells.
(A) Promega GenePrint 24 system STR analysis summary of our JK THP-1 cells versus ATCC THP-1 cells. Cell line authentication was done by TransnetYX, Inc by following the protocol described in ANSI/ATCC ASN-0002–2011. The STR alleles were searched on the ATCC Database and the Expasy best match cell numbers for each cell line had a 100% database match. Distinguishing loci are highlighted in yellow and distinguishing alleles are in red. (B) JK and ATCC THP-1 cells were primed with Pam3CSK4 overnight then treated with increasing doses of DEAE-dextran for 24 hours before probing for IL-1β secretion. (C) Wildtype (WT) or CARD8 knockout (KO) THP-1 cells were infected with wildtype HIV-1LAI at the same MOI in the presence or absence of DEAE-dextran (10 µg/mL) then harvested after 24 hours and assayed for: left, percent infection via intracellular p24gag; middle, inflammasome activation by IL-1β secretion via IL-1R reporter assay; and right, cell death via propidium iodide (PI) dye uptake using flow cytometry. %PI positive and IL-1 levels are normalized to mock control. Dotted line indicates limit of detection (LoD). Datasets represent mean ± SD (n=2 biological replicates). Two-way ANOVA with (B) Sidak’s or (C) Tukey’s test using GraphPad Prism 10. ns = not significant, *p<0.05, **p<0.01, ***p<0.001, ****P<0.0001.
Author response image 1.
Author response image 1.. Equivalent infection in AAVS1 vs CARD8 KOMDMs.
Author response image 2.
Author response image 2.. Inflammasome activation following cell-to-cell HIV infection is mediated by GSDMD.
SUPT1-CCR5 cells were either mock-infected or infected with HIV-1NL4.3BaL for 20 hours before coculturing with MDMs in either the presence or absence of GSDMD inhibitor disulfarim (25μM). Cocultures were harvested 24 hours later to assess (left) IL-1β secretion via IL-1 reporter assay and (right) cell viability via CellTiter-Glo assay. Viability was calculated by normalizing to relative luminescence units in the mock untreated control. Dotted line indicates limit of detection (LoD). Dashed line indicates 100% viability as determined by untreated mock control. Datasets represent mean ± SD (n=2 technical replicates for one donor). Two-way ANOVA with Sidak’s test using GraphPad Prism 10. ns = not significant, *p<0.05,**p<0.01, ***p<0.001, ****p<0.0001.

Update of

Similar articles

References

    1. Abela IA, Berlinger L, Schanz M, Reynell L, Günthard HF, Rusert P, Trkola A. Cell-cell transmission enables HIV-1 to evade inhibition by potent CD4bs directed antibodies. PLOS Pathogens. 2012;8:e1002634. doi: 10.1371/journal.ppat.1002634. - DOI - PMC - PubMed
    1. Agosto LM, Uchil PD, Mothes W. HIV cell-to-cell transmission: effects on pathogenesis and antiretroviral therapy. Trends in Microbiology. 2015;23:289–295. doi: 10.1016/j.tim.2015.02.003. - DOI - PMC - PubMed
    1. Agosto LM, Herring MB, Mothes W, Henderson AJ. HIV-1-infected CD4+ T cells facilitate latent infection of resting CD4+ T cells through cell-cell contact. Cell Reports. 2018;24:2088–2100. doi: 10.1016/j.celrep.2018.07.079. - DOI - PubMed
    1. Bailey CA, Miller DK, Lenard J. Effects of DEAE-dextran on infection and hemolysis by VSV. Evidence that nonspecific electrostatic interactions mediate effective binding of VSV to cells. Virology. 1984;133:111–118. doi: 10.1016/0042-6822(84)90429-x. - DOI - PubMed
    1. Bandera A, Masetti M, Fabbiani M, Biasin M, Muscatello A, Squillace N, Clerici M, Gori A, Trabattoni D. The NLRP3 inflammasome is upregulated in HIV-infected antiretroviral therapy-treated individuals with defective immune recovery. Frontiers in Immunology. 2018;9:214. doi: 10.3389/fimmu.2018.00214. - DOI - PMC - PubMed

LinkOut - more resources