. 2025 Jun 16;20(6):e0325672.
doi: 10.1371/journal.pone.0325672. eCollection 2025.

Transcriptomic profiling of pancreatic neuroendocrine tumors: dysregulation of WNT, MAPK, PI3K, neddylation pathways and potential non-invasive biomarkers

Affiliations

Transcriptomic profiling of pancreatic neuroendocrine tumors: dysregulation of WNT, MAPK, PI3K, neddylation pathways and potential non-invasive biomarkers

Helvijs Niedra et al. PLoS One. .

Abstract

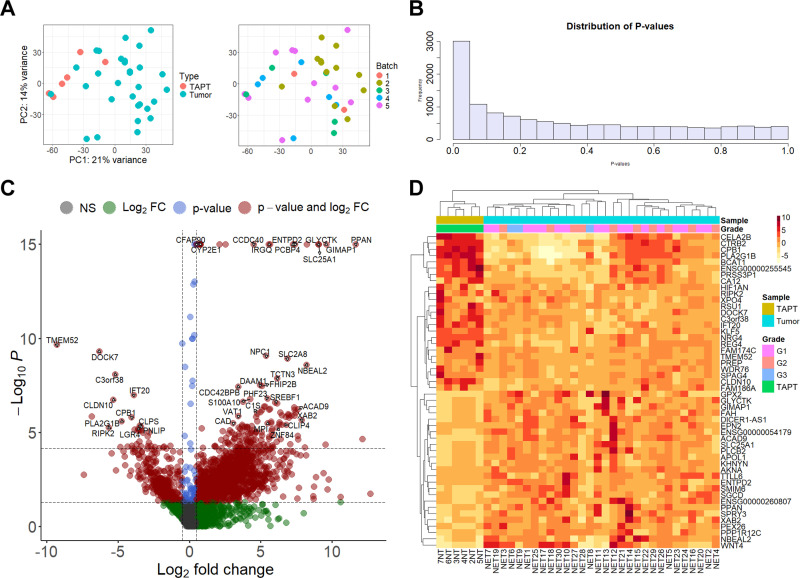
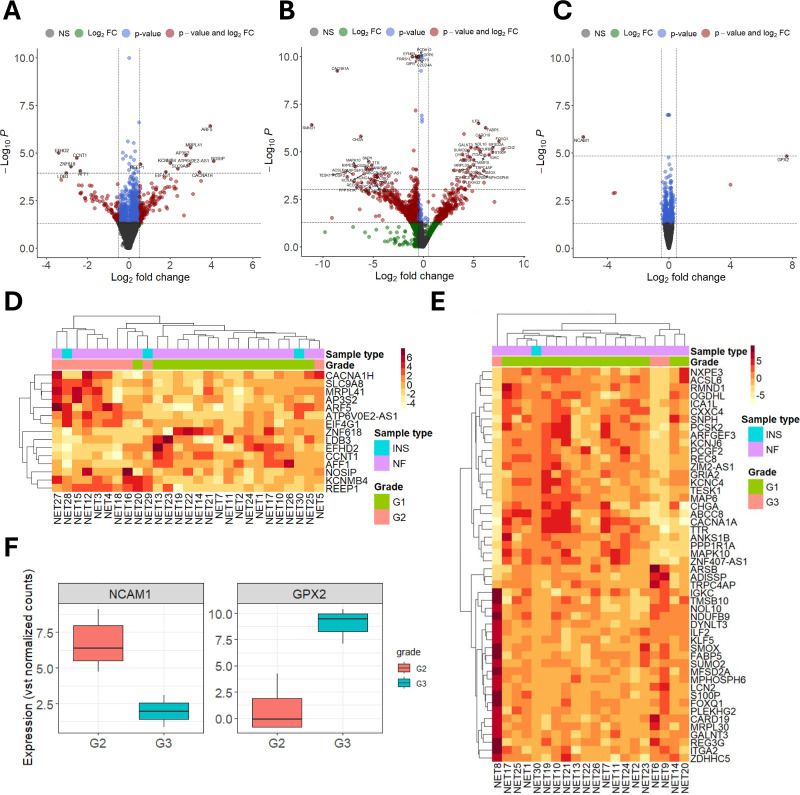
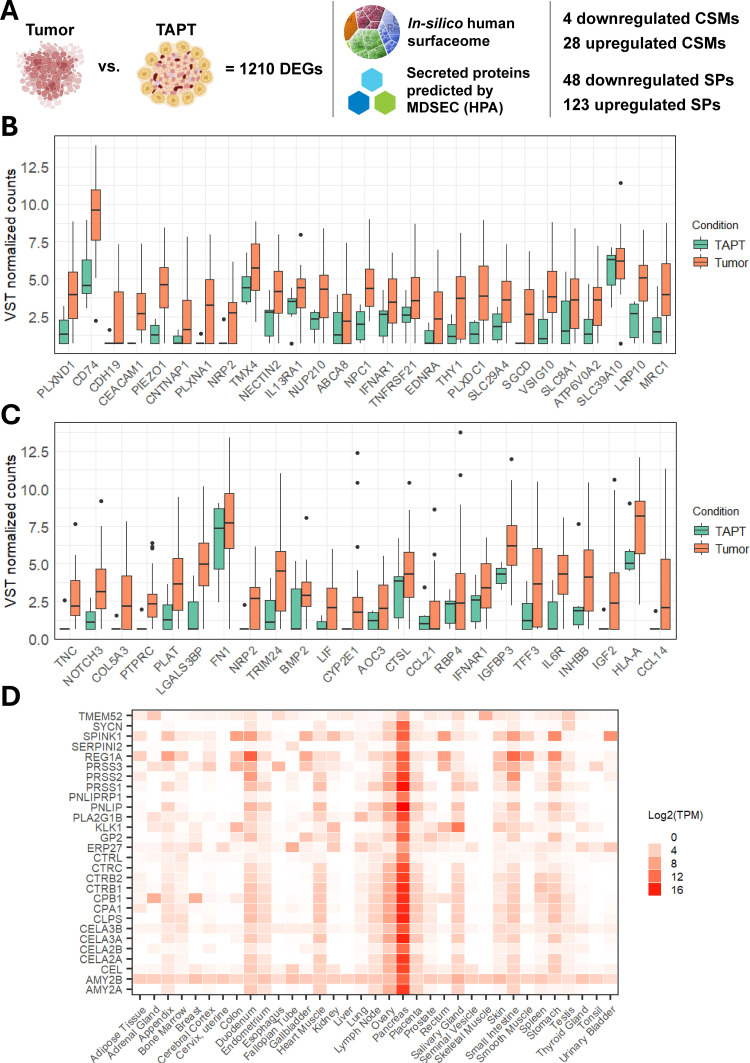
The study aimed to identify altered signaling pathways and potential non-invasive biomarkers for pancreatic neuroendocrine tumors (PanNETs) through transcriptomic profiling of tumor tissues. The analysis encompassed samples from non-functional PanNETs (NF-PanNETs), insulinomas, and tumor-adjacent pancreatic tissues (TAPT). In the differential expression analysis comparing PanNETs and TAPTs, we identified 1,210 differentially expressed genes at a false discovery rate significance threshold of < 0.05 and with Log2FoldChange values of > 0.5 and <-0.5. Further pathway enrichment analysis revealed a multitude of overrepresented signaling pathways related to cell proliferation, survival, and tumorigenesis. Significant findings included the Beta-catenin-independent and TCF-dependent WNT signaling pathways, MAPK1/MAPK3 signaling, and terms associated with PI3K/AKT/mTOR signaling. Among the list of DEGs, we also identified 28 upregulated genes encoding cell surface proteins and 24 upregulated genes encoding cancer-associated secretome proteins. Since the proteins of these genes are found in the bloodstream, there is potential for further testing of these markers as biomarkers for liquid biopsy assays. Overall, these findings underscore the promise of transcriptomic landscape analysis in identifying PanNET-specific non-invasive biomarkers and uncovering potential therapeutic targets.


Conflict of interest statement

The authors declare no conflict of interest.

Figures

Fig 1
Fig 1. Schematic overview of study design encompassing initial sample size, sample groups, and differential expression analysis comparisons.
Sequencing data quality control included batch effect assessment using principal component analyses. Abbreviations: FFPE – formalin fixed paraffin embedded, RNA – ribonucleic acid, PanNET – pancreatic neuroendocrine tumor, NF-PanNET – non-functioning pancreatic neuroendocrine tumor, TAPT – tumor adjacent pancreatic tissue, INS – Insulinoma, G1 – grade 1, G2 – grade 2, G3 – grade 3.
Fig 2
Fig 2. Results of differential gene expression (DGE) analysis between pancreatic neuroendocrine tumor and tumor-adjacent pancreatic tissues.
A – scatterplot of principal component analysis results for tumor (n = 30) and TAPT tissues (n = 6). Analysis was based on the top 500 genes with the highest variance. B – histogram showing distribution of p-values from results of differential expression analysis using DEseq2; the plot shows shows major differences between tumor and TAPT samples; X-axis – p-value; Y-axis – frequency. C – Volcano plot; Y-axis – -Log10p-values; X-axis – Log2FoldChange (Log2FC) values from the DESeq2 analysis. Y-axis is capped at -Log10P = 10 for visual clarity. Horizontal dashed lines represent the p-value (0.05), and false discovery rate (FDR) adjusted p-value (0.05) thresholds. Vertical dashed lines represent Log2FC thresholds (+/- 0.5). NS – genes below both thresholds. D – heatmap visualization of mean normalized expression values for the top 25 upregulated and downregulated differentially expressed genes according to Log2FC values. Clustering distance measure – Euclidean.
Fig 3
Fig 3. Results of active subnetwork-oriented enrichment analysis for the differentially expressed genes (DEGs) identified in tumor vs. tumor-adjacent pancreatic tissue (TAPT) analysis.
Figures include the top five pathways (based on false discovery rate p-value) from each of the five largest clusters. A – bar chart of Reactome pathways per cluster; X-axis – pathway count in a cluster. B – enrichment chart representing enrichment results; X-axis – fold enrichment value; Y-axis – Reactome term identifiers followed by description. C – Heatmap of the agglomerated z-scores of enriched terms per sample. The plot displays how the selected 25 terms are altered in each sample based on variance stabilizing transformed (vst) normalized count data from 30 tumor and 6 TAPT samples. D – Terms by genes heatmap. The heatmap shows the upregulation or downregulation (Log2FC) of genes (86 in total) related to a specific term. E – STRING physical protein-protein interaction network of 86 genes related to pathways displayed in figures B, C, and D. Network p-value – 1.0 x 10^16, based on 186 edges and 79 expected edges for a random set of proteins of the same size.
Fig 4
Fig 4. Results of differential gene expression between different grades of pancreatic neuroendocrine tumors.
A, B, and C – Volcano plots; Y-axis – -Log10p-values; X-axis – Log2FoldChange (Log2FC) values (x-axis) from the DESeq2 analysis. Y-axis is capped at -Log10P = 10 for visual clarity. Horizontal dashed lines represent the p-value (0.05) and false discovery rate (FDR) adjusted p-value (0.05) thresholds. Vertical dashed lines represent Log2FC thresholds (+/- 0.5). NS – genes below both thresholds. A – Grade 2 (G2) vs. Grade 1 (G1) tumors; B – Grade 3 (G3) vs. G1 tumors; C – G3 vs. G2 tumors. D and E – Heatmaps of mean normalized expression values for the top 25 upregulated and downregulated differentially expressed genes (FDR < 0.05) according to Log2FC values. Sample type annotations: insulinomas (INS), non-functioning (NF). D – G2 vs. G1 tumors; E – G3 vs. G1 tumors. F – Boxplots representing the two differentially expressed genes (FDR < 0.05) in the G3 vs. G2 tumors comparison; Y-axis – variance-stabilizing transformed (VST) normalized count values.
Fig 5
Fig 5. Cell surface markers (CSMs) and secretome-related proteins (SPs) discovered in the differential gene expression analysis results dataset comparing tumors and tumor-adjacent pancreatic tissues (TAPT).
A – The search of differentially expressed genes in silico human surfaceome and Human Protein Atlas (HPA) databases. B – Boxplots of 28 upregulated CSMs in tumor samples. The Y-axis represents variance-stabilizing transformed normalized counts. X-axis represents gene symbols according to HUGO gene nomenclature. C – Boxplots of 24 upregulated cancer secretome associated SPs in tumor samples. The Y-axis represents variance-stabilizing transformed normalized counts. D – Heatmap representing calculated transcripts per million (TPM) expression values for the identified SPs that were enriched for pancreatic tissue.

Similar articles

References

    1. Ma Z-Y, Gong Y-F, Zhuang H-K, Zhou Z-X, Huang S-Z, Zou Y-P, et al. Pancreatic neuroendocrine tumors: A review of serum biomarkers, staging, and management. World J Gastroenterol. 2020;26(19):2305–22. doi: 10.3748/wjg.v26.i19.2305 - DOI - PMC - PubMed
    1. Sun J. Pancreatic neuroendocrine tumors. Intractable Rare Dis Res. 2017;6(1):21–8. doi: 10.5582/irdr.2017.01007 - DOI - PMC - PubMed
    1. Kelgiorgi D, Dervenis C. Pancreatic neuroendocrine tumors: the basics, the gray zone, and the target. F1000Res. 2017;6:663. doi: 10.12688/f1000research.10188.1 - DOI - PMC - PubMed
    1. Young K, Lawlor RT, Ragulan C, Patil Y, Mafficini A, Bersani S, et al. Immune landscape, evolution, hypoxia-mediated viral mimicry pathways and therapeutic potential in molecular subtypes of pancreatic neuroendocrine tumours. Gut. 2021;70(10):1904–13. doi: 10.1136/gutjnl-2020-321016 - DOI - PMC - PubMed
    1. Rindi G, Mete O, Uccella S, Basturk O, La Rosa S, Brosens LAA, et al. Overview of the 2022 WHO classification of neuroendocrine neoplasms. Endocr Pathol. 2022;33(1):115–54. doi: 10.1007/s12022-022-09708-2 - DOI - PubMed

MeSH terms

Substances