. 2025 Jun 16;20(6):e0325201.
doi: 10.1371/journal.pone.0325201. eCollection 2025.

Influence of multi-species data on gene-disease associations in substance use disorder using random walk with restart models

Affiliations

Influence of multi-species data on gene-disease associations in substance use disorder using random walk with restart models

Everest U Castaneda et al. PLoS One. .

Abstract

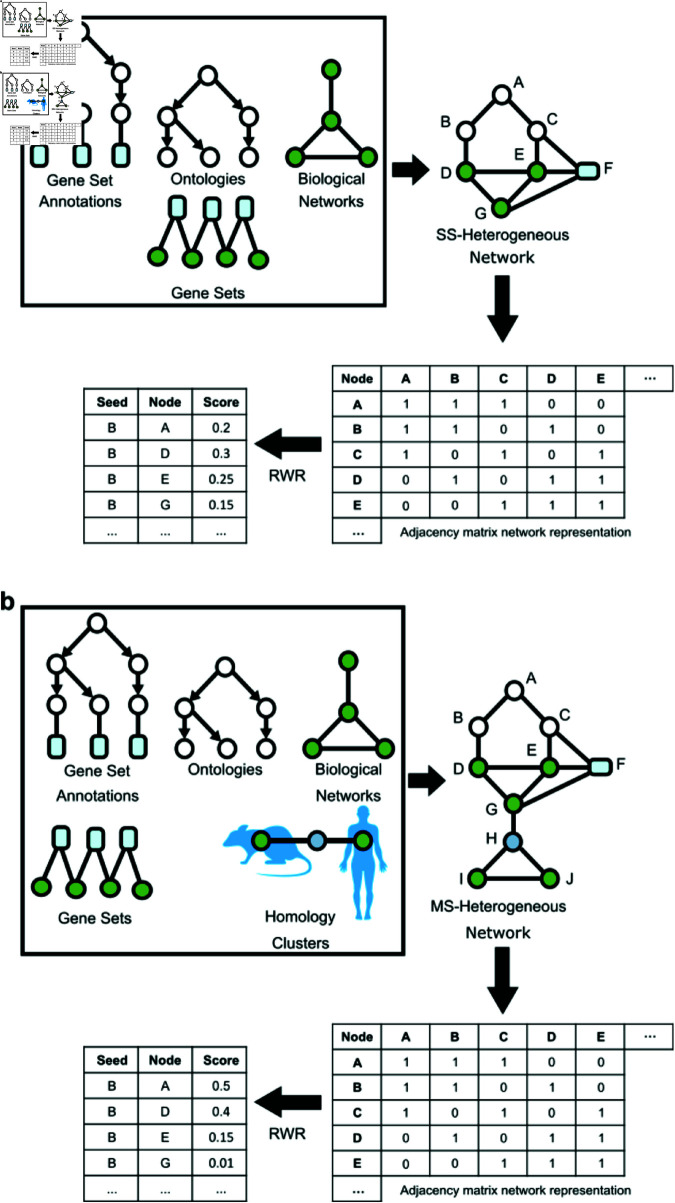
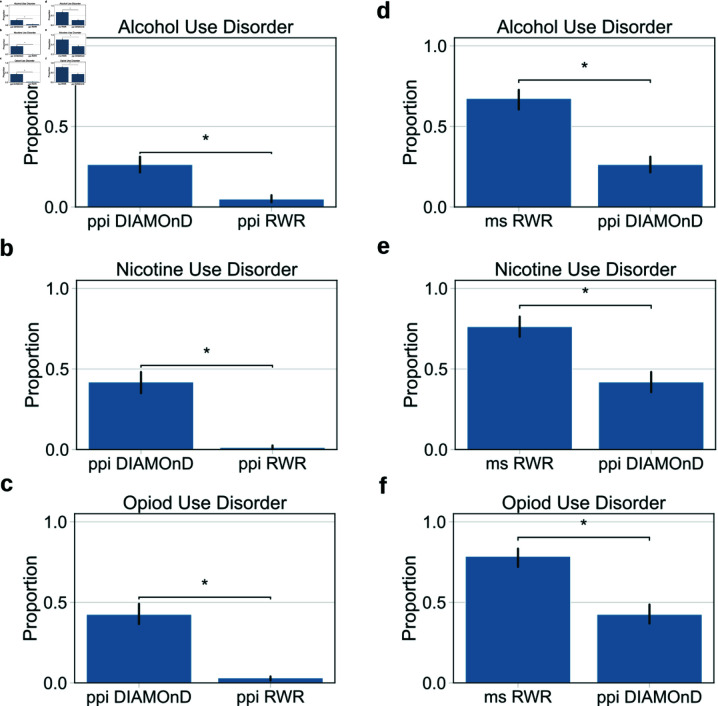
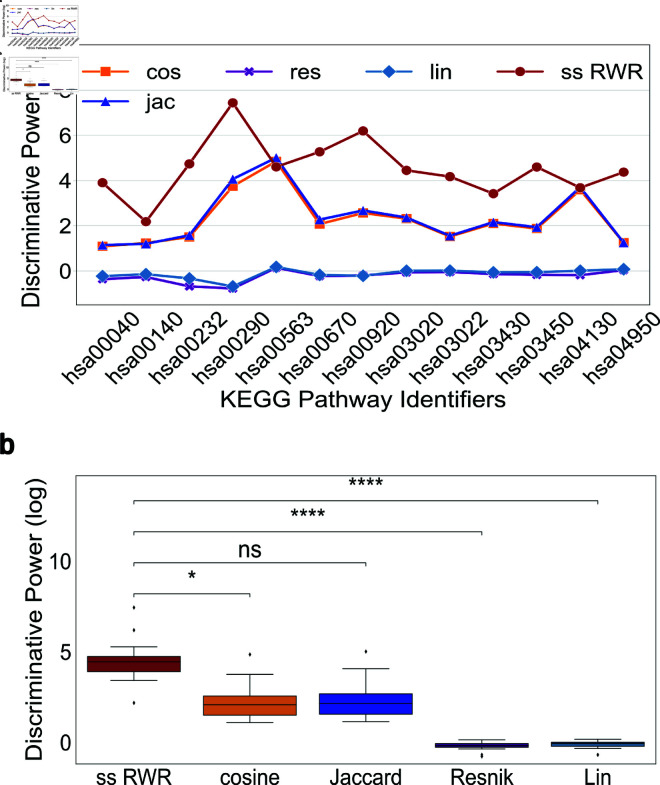
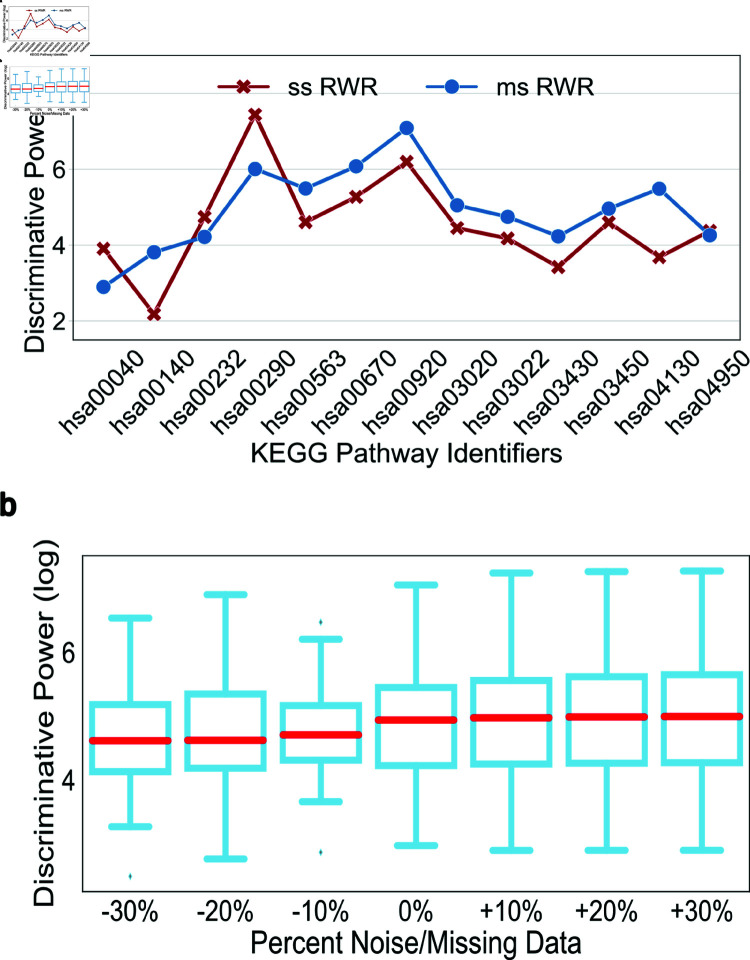
A major challenge lies in discovering, emphasizing, and characterizing human gene-disease and gene-gene associations. The limitations of data on the role of human gene products in substance use disorder (SUD) makes it challenging to transition from genetic associations to actionable insights. The integration of data from multiple diverse sources, including information-dense studies in model organisms, has the potential to address this gap. We demonstrate a modified performance of the Random Walk with Restart algorithm when multi-species data is integrated in the heterogeneous network within the context of SUD. Additionally, our approach distinguishes among disparate pathways derived from the Kyoto Encyclopedia of Genes and Genomes. Thus, we conclude that direct incorporation of multi-species data to an aggregated heterogeneous knowledge graph can adjust RWR's performance and enables users to discover new gene-disease and gene-gene associations.


Conflict of interest statement

The authors have declared that no competing interests exist.

Figures

Fig 1
Fig 1. Scheme for building heterogeneous graphs and subsequent RWR.
We outline the creation of two graphs used in this analysis as well as the generalized data sources and the RWR process with artificial walk scores. Gene sets were acquired from GeneWeaver along with their subsequent ontologies. Biological networks were acquired from Biological General Repository for Interaction Datasets and the Kyoto Encylopedia of Genes and Genomes. We directly integrate the Gene Ontology Biological Process map. For the multi-species graph, we incorporated homology clusters and aggregated data to include biological networks and gene sets from Homo sapiens, Mus musculus, and Rattus norevigicus. (a) Graph building and subsequent graph walk for the single species graph. (b) Multi-species graph building and graph walk. Note that the inclusion of the homology clusters is highly contrasted to the single species approach, which allowed input for additional networks derived from the 3 species.
Fig 2
Fig 2. Statistical comparisons of the proportion of recapitulated genes for three substance use disorders.
Statistical comparison was made using a Mann-Whitney U test. Comparisons with DIAMOnD were made against either a global single species protein-protein interaction (ppi) graph, a-c, or a multiple species heterogeneous graph, d-f. (a) DIAMOnD’s proportion of recapitulated genes was significantly higher than RWR for the alcohol use disorder (AUD), Ustatistic=2.50×101 and pvalue=1.12×10². (b) DIAMOnD’s proportion of recapitulated genes was significantly higher than RWR for the nicotine use disorder (NUD), Ustatistic=2.50×101 and pvalue=1.07×10². (c) DIAMOnD’s proportion of recapitulated genes was significantly higher than RWR for opioid use disorder (OUD), Ustatistic=2.50×101 and pvalue=1.19×10². (d) RWR was significantly higher for the multi-species (ms) AUD graph, Ustatistics=2.50×101 and pvalue=1.14×10² (e) RWR was significantly higher for the NUD ms graph, Ustatistics=2.50×101 and pvalue=1.14×10² (f) RWR was significantly higher for the OUD ms graph, Ustatistics=2.50×101 and pvalue=1.22×10².
Fig 3
Fig 3. Comparison of RWR against semantic similarity measures for single species data.
Probability value (p) annotation are as follows: ns: 5.00×10²<p1.00, *: 1.00×10²<p5×102,**: 1.00×10³<p1.00×102 ***: 1.00×10⁴<p1.00×103 ****: p1.00×104 (a) Single species RWR (ss RWR) outperformed all other semantic similarity measures in 11 of 13 pathways. Jaccard outperformed ss RWR in 2 pathways while cosine outperformed ss RWR in 1 pathway. (b) Dunn’s test comparison of ss RWR with all semantic similarity measures. discriminative power was significantly higher than all other algorithms except Jaccard.
Fig 4
Fig 4. Comparison of RWR coupled with single species and multi-species data sources.
(a) Multi-species (ms RWR) outperformed single species (ss RWR) in all pathways except the following 4 pathways: hsa00040, hsa00232, hsa00290, hsa04950. (b) Robustness of ms RWR to noise and missing data. KW ANOVA results show no significance between the discriminative property of any of the graphs, Hstatistic=1.23 and pvalue=9.75×101.
Fig 5
Fig 5. Cliff’s delta effect size for all comparisons.
Blue vertical line shows where the threshold between a large and medium effect lies, δ<0.47. There was a large effect, within the 0.95 confidence interval, for all comparisons of ppi DIAMOnD and ppi RWR and all comparisons of ms RWR and ppi DIAMOnD. Comparisons of ss RWR and all semantic scoring all had a large effect, but the confidence interval went below threshold for ss RWR comparisons with ms jac, jac, and cos. No comparisons for ms RWR went below threshold.

Similar articles

References

    1. Bough KJ, Pollock JD. Defining substance use disorders: the need for peripheral biomarkers. Trends Mol Med. 2018;24(2):109–20. doi: 10.1016/j.molmed.2017.12.009 - DOI - PubMed
    1. Hatoum AS, Colbert SMC, Johnson EC, Huggett SB, Deak JD, Pathak G, et al. Multivariate genome-wide association meta-analysis of over 1 million subjects identifies loci underlying multiple substance use disorders. Nat Ment Health. 2023;1(3):210–23. doi: 10.1038/s44220-023-00034-y - DOI - PMC - PubMed
    1. Abdellaoui A, Yengo L, Verweij KJH, Visscher PM. 15 years of GWAS discovery: realizing the promise. Am J Hum Genet. 2023;110(2):179–94. doi: 10.1016/j.ajhg.2022.12.011 - DOI - PMC - PubMed
    1. Zitnik M, Li MM, Wells A, Glass K, Morselli Gysi D, Krishnan A, et al. Current and future directions in network biology. Bioinform Adv. 2024;4(1):vbae099. doi: 10.1093/bioadv/vbae099 - DOI - PMC - PubMed
    1. Lee B, Zhang S, Poleksic A, Xie L. Heterogeneous multi-layered network model for omics data integration and analysis. Front Genet. 2020;10:1381. doi: 10.3389/fgene.2019.01381 - DOI - PMC - PubMed