. 2025 Jun 16;21(6):e1013246.
doi: 10.1371/journal.ppat.1013246. eCollection 2025 Jun.

IFN alpha inducible protein 27 (IFI27) acts as a positive regulator of PACT-dependent PKR activation after RNA virus infections

Affiliations

IFN alpha inducible protein 27 (IFI27) acts as a positive regulator of PACT-dependent PKR activation after RNA virus infections

Darío López-García et al. PLoS Pathog. .

Abstract

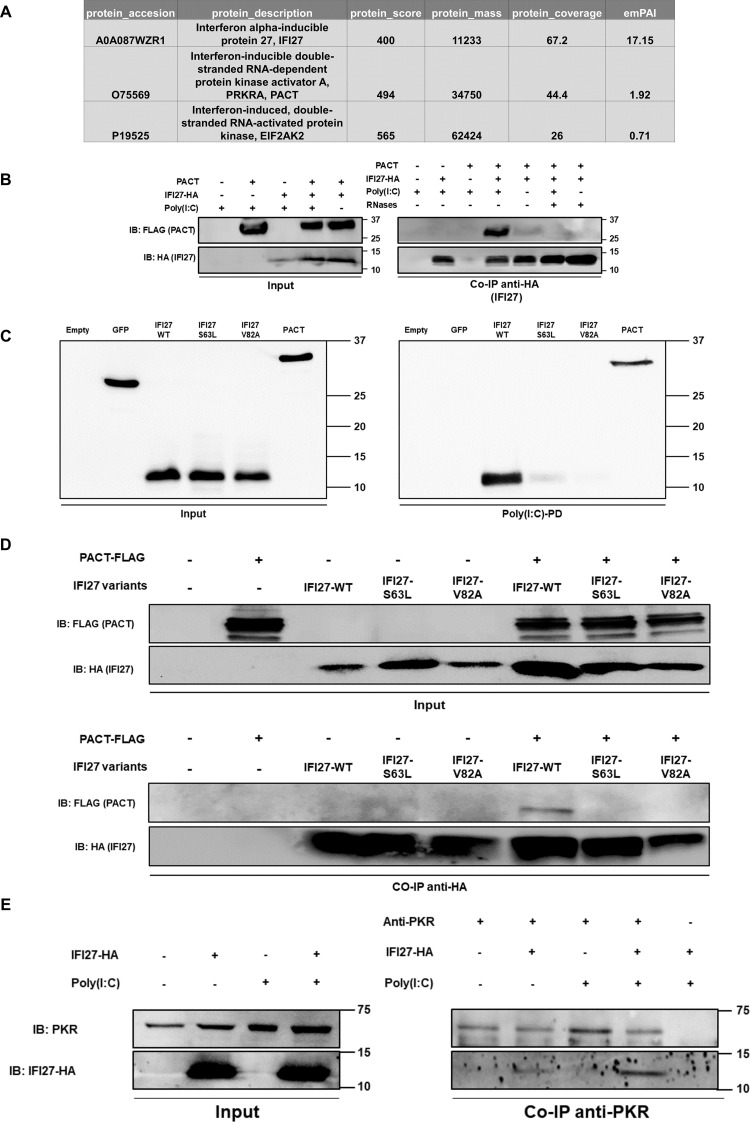
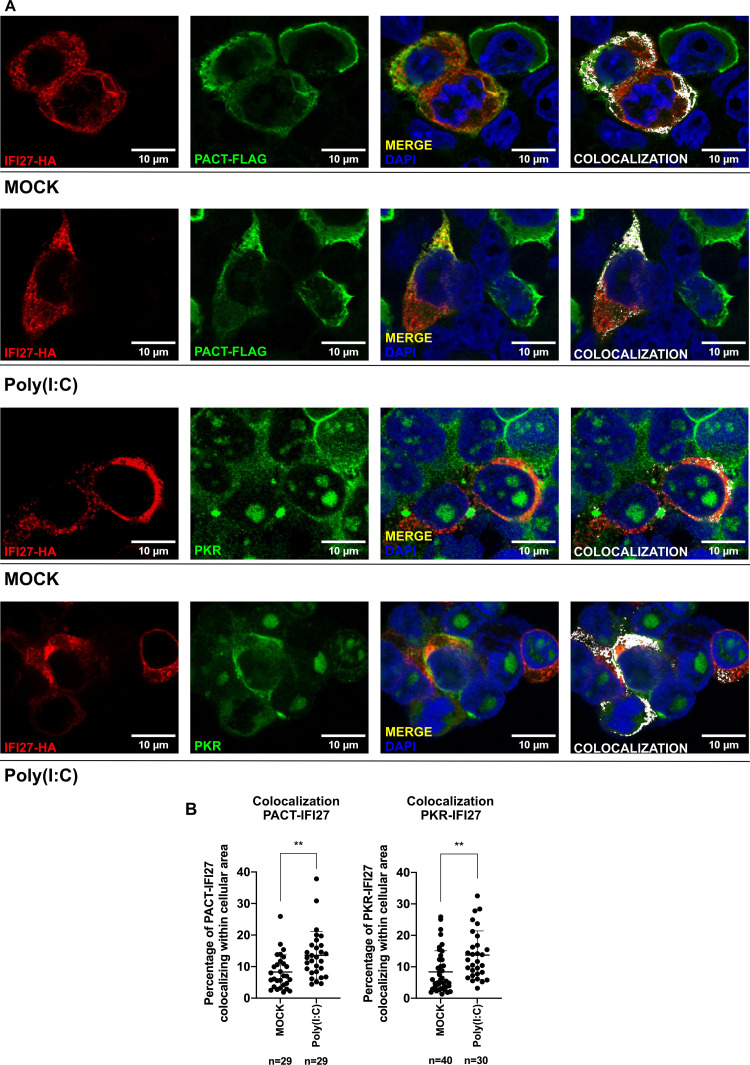
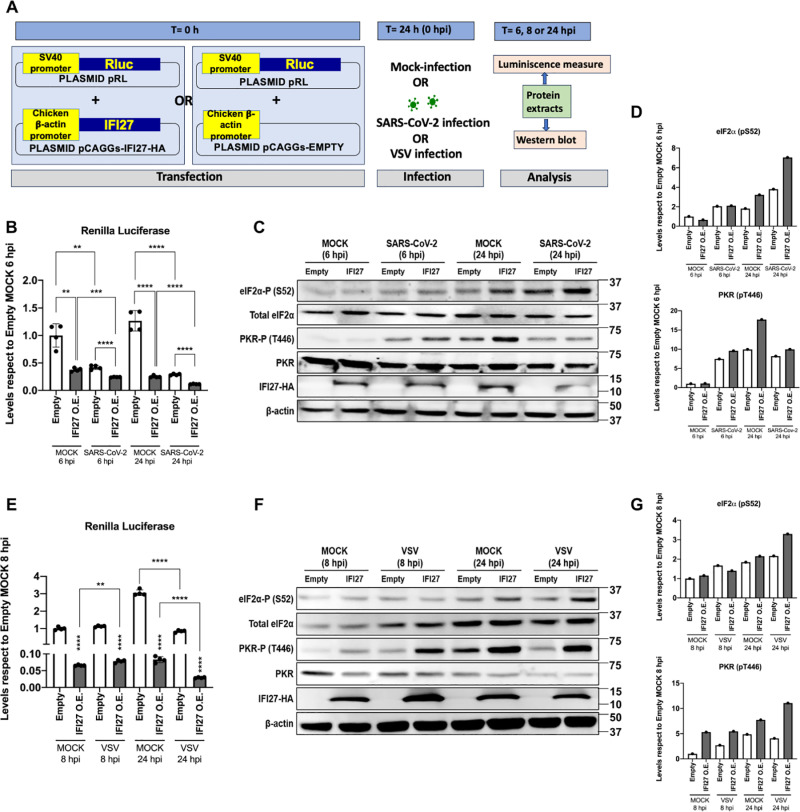
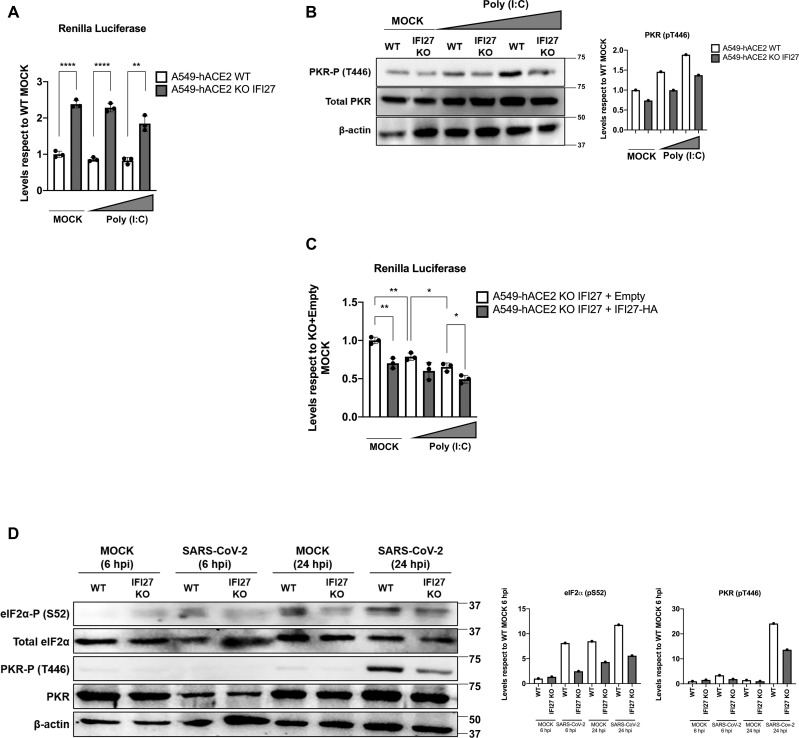
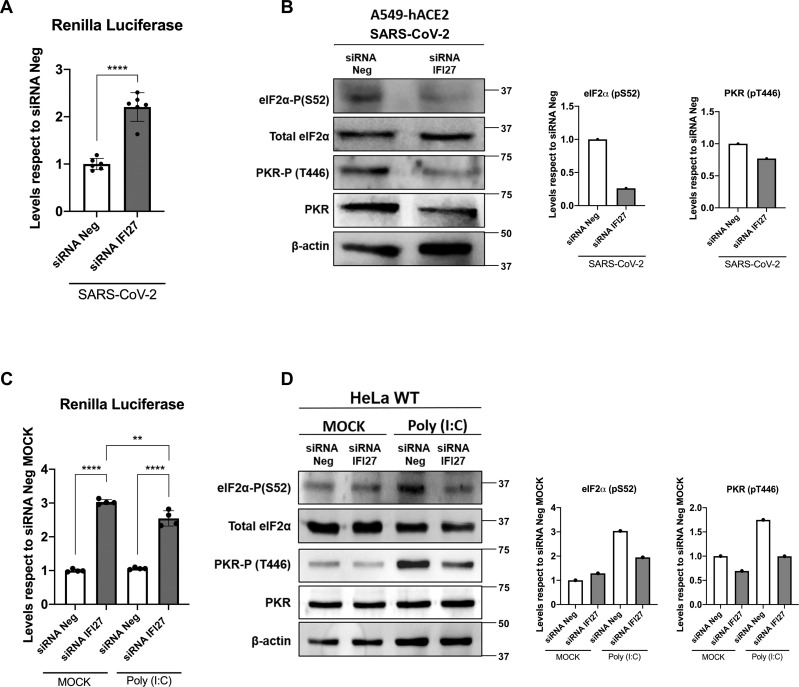
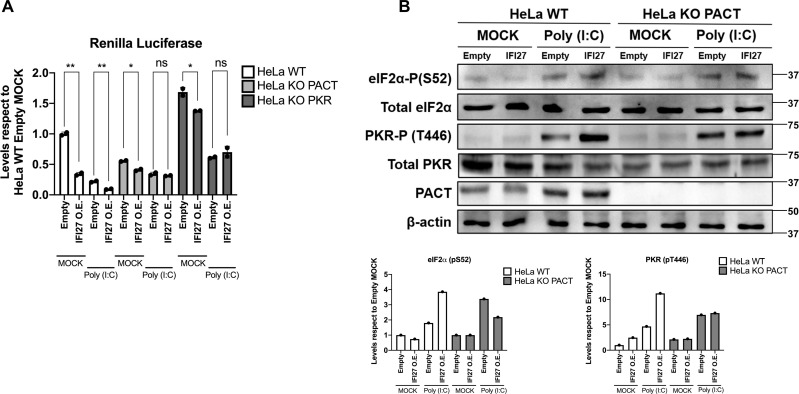
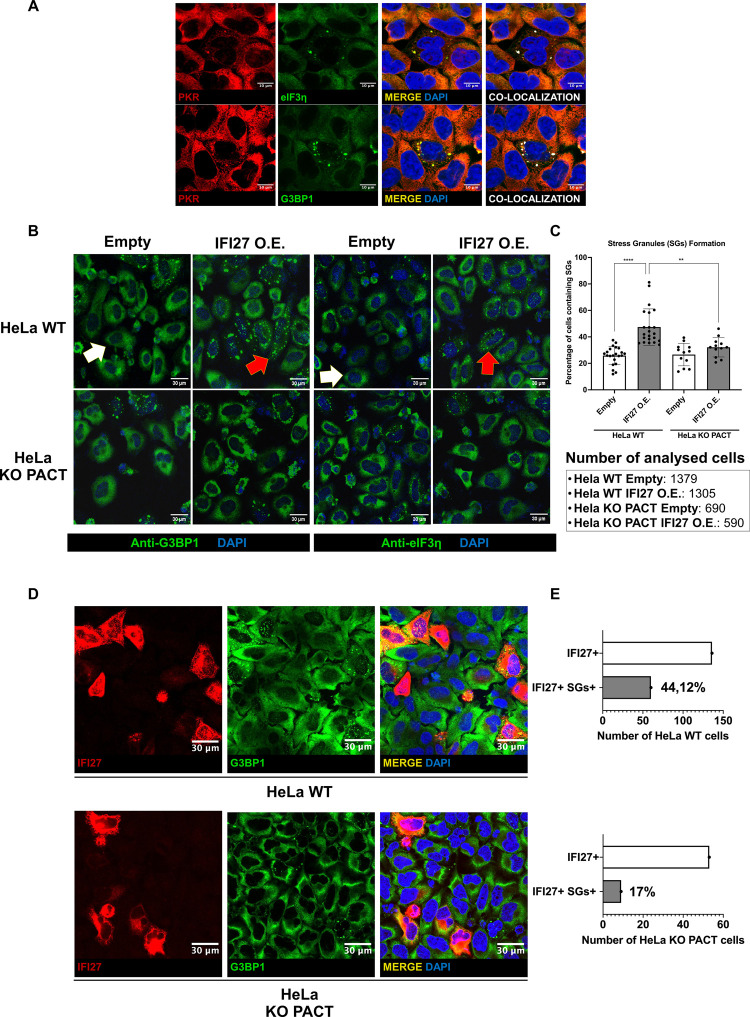
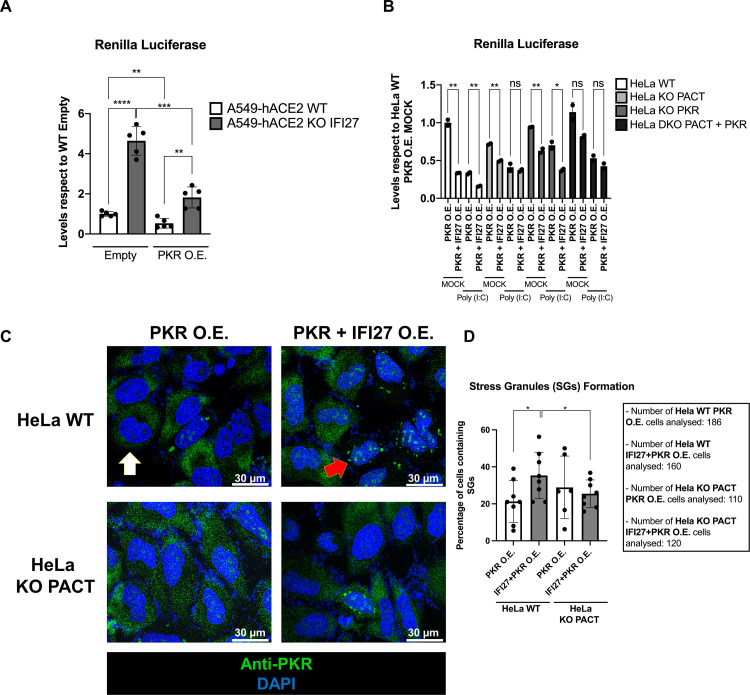
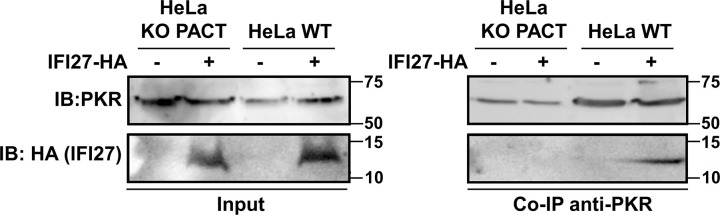
Protein kinase R (PKR) expression is induced by interferons. This protein is activated by double-stranded (ds) RNAs or RNAs containing duplex regions, produced after different stimuli, such as after viral infections, leading to the phosphorylation of the eukaryotic translation initiation factor 2α (eIF2α), and subsequently inhibiting cellular and viral protein translation. This function may lead to different effects such as to impairing the replication of RNA viruses by inhibiting viral protein translation, and to modulating the innate immune responses after viral infections by affecting the translation of effector proteins. In this work, we identify, for the first time, an interaction of IFN alpha inducible protein 27 (IFI27) with PKR-activating protein (PACT or PRKRA) and with PKR, showing that the interaction of IFI27 with PACT is likely mediated by dsRNAs or RNAs containing duplex regions, and that the interaction of IFI27 with PKR is PACT-dependent. Interestingly, using IFI27 knocked-down, knocked-out and overexpressing tumour-derived, established cells, we show that these interactions trigger a potentiation of the activity of PKR and, therefore, a decrease in protein translation. Moreover, we find that IFI27 increases PKR function in cells infected with different RNA viruses such as Severe Acute Respiratory virus 2 (SARS-CoV-2), and Vesicular Stomatitis virus (VSV), and in cells transfected with the dsRNA analog poly(I:C), suggesting a broad effect of IFI27 on PKR activation. Moreover, we show that IFI27 expression increases the formation of stress granules (SGs) at the cell cytoplasm, correlating with the increased PKR activation mediated by IFI27, as it has been shown that the translational arrest induced by activated PKR leads to the formation of SGs. Mechanistically, we describe that this ability of IFI27 to activate PKR is dependent on its interaction with PACT. Further understanding of the regulation of PKR activity will allow us to develop new antiviral drugs to modulate this signalling axis, which is crucial in RNA virus infections.


Conflict of interest statement

The authors have declared that no competing interests exist.

Figures

Fig 1
Fig 1. IFI27 interacts with PKR and PACT.
(A) HEK-293T cells were transiently transfected with a pCAGGS-IFI27-HA plasmid, and 24h later, the cells were transfected with poly(I:C) at 3000 ng/ml. 24h after poly(I:C) transfection, protein extracts were obtained by lysis and were incubated with HA-bound agarose beads to retain IFI27-HA and all its associated proteins, which were then identified by MS. Protein accession number, description, score, mass, coverage, and emPAI index are indicated. (B) HEK-293T cells were transiently transfected with pCAGGS-PACT-FLAG in combination with pCAGGS-IFI27-HA or an empty pCAGGS plasmid. At 24 hpt, the cells were left mock-treated or were transfected with poly(I:C) at 3000 ng/ml during 24 h. Cellular extracts were treated with RNAses or left untreated and a Co-IP with HA-bounded agarose beads was performed. PACT and IFI27 were detected by Western blot employing anti-FLAG (to detect PACT, top panel) and anti-HA (to detect IFI27, bottom panel) antibodies, both in the cellular lysates (Input) and after the Co-IP. Molecular weight is indicated on the right of the panels (in kilodaltons). (C) Binding of IFI27 to poly(I:C). Human 293T cells were transiently transfected with the pCAGGS plasmids encoding GFP, IFI27-WT-HA, IFI27-S63L-HA variant, IFI27-V82A-HA variant, and PACT-FLAG, or with an empty plasmid. Pull-down (PD) experiments using poly(I:C)-conjugated agarose beads were performed using cellular extracts. Western blotting using antibodies specific for GFP, the HA tag (to detect IFI27 variants) or the FLAG tag (to detect PACT) was performed to detect protein in the cellular lysates (Input) and after the pull-down (poly(I:C)-PD). Molecular weight markers are indicated (in kilodaltons) on the right. (D) HEK-293T cells were transiently transfected with pCAGGS-PACT-FLAG in combination with pCAGGS plasmids encoding IFI27-WT or the IFI27 variants, or an empty pCAGGS plasmid. At 24 hpt, the cells were left mock-treated or were transfected with poly(I:C) at 3000 ng/ml during 24 h. A Co-IP with HA-bounded agarose beads was performed. PACT and IFI27 variants were detected by Western blot employing anti-FLAG (to detect PACT, top panel) and anti-HA (to detect IFI27 variants, bottom panel) antibodies, both in the cellular lysates (Input) and after the Co-IP. Molecular weight is 34 kilodalton for PACT and 12 kilodalton for IFI27. (E) HEK-293T cells were transiently transfected with a pCAGGS-IFI27-HA expressing plasmid and 24 hours later, cells were mock-transfected or transfected with 3000 ng/ml of poly(I:C) using polyethylenimine (PEI, polysciences) for 16 hours. Cell lysates were incubated overnight at 4ºC with the PKR specific antibody as well as with protein A-sepharose resin, except in the last Co-IP sample in which the cellular extract expressing IFI27-HA was incubated with the protein A-sepharose resin, without the anti-PKR antibody. Eluates were analysed by Western blot, to detect PKR and IFI27 by employing anti-PKR (to detect endogenous PKR, top panel) and anti-HA (to detect IFI27-HA, bottom panel) both in the cellular lysates (Input) and after the Co-IP. Molecular weight is indicated on the right of the panels (in kilodaltons).
Fig 2
Fig 2. IFI27 partially colocalizes with PKR and PACT.
(A) HEK-293T cells were transfected with pCAGGS-IFI27-HA together with pCAGGS-PACT-FLAG (for PACT-IFI27 condition) or with pCAGGS-IFI27-HA only (for PKR-IFI27 condition), and then, the cells were either mock-transfected or poly(I:C)-transfected at 3000 ng/ml for 24 hours. After transfection, cells were fixed with formaldehyde and an immunofluorescence was performed to detect IFI27, PACT or endogenous PKR, using anti-HA, anti-FLAG, and anti-PKR antibodies, respectively. Cytoplasm co-localization was analysed and indicated in yellow (merge) in the third picture and white (co-localization) in the fourth picture. (B) The level of colocalization between PACT or PKR and IFI27 was analysed by dividing the area where PACT/PKR signal (Alexa Fluor 488, green) and IFI27 signal (Alexa Fluor 594, red) were colocalizing between the total cell area. This ratio was transformed into percentages that are represented on the Y-axis. For PACT-IFI27 mock-transfected and poly(I:C)-transfected conditions, 29 cells were analysed in each case. For PKR-IFI27 mock-transfected and poly(I:C)-transfected conditions, 40 and 30 cells, respectively, were analysed. Each cell result for each condition is represented with dots, and data is represented as the means and standard deviations of the different measures. ns (non-significative) p > 0.05, *p < 0.05, **p < 0.01, ***p < 0.001, **** p < 0.0001 (for comparisons using unpaired two-tailed Student’s t test). Scale bar: 10 µm. These measures were performed in two independent experiments.
Fig 3
Fig 3. IFI27 overexpression leads to a stronger PKR activation.
(A) Schema of the experimental timeline. (B, C, D) HEK-293T-hACE2 cells were transiently transfected with a pCAGGS-IFI27-HA plasmid (IFI27 O.E.) or an emtpy pCAGGS plasmid (Empty) together with a pRL plasmid expressing RLuc luciferase, and 24h later, transfected cells were left mock-infected or infected with SARS-CoV-2 at a multiplicity of infection (MOI) of 1. At 6 and 24 hours post-infection (hpi), protein extracts were obtained and the levels of RLuc luminescence were measured. Individual data points correspond to independent measures from different technical samples (B). All luminescence levels were compared respect to mock-infected cells transfected with the empty plasmid (B). (C) These protein extracts were also used to measure protein levels of eIF2α-P (S52), total eIF2α, PKR-P (T446), total PKR, IFI27-HA, and β-actin (loading control) by Western blot employing their respective specific antibodies. Molecular weight is indicated on the right of the panels (in kilodaltons). Western blots were quantified by densitometry using ImageJ software. The amount of eIF2α-P (S52) was normalised to the amount of total eIF2α and β-actin. The amount of PKR-P (T446) was normalised to the amounts of total PKR and β-actin (results of quantification showed in bars to the right of immunoblots (D)), with levels relative to empty plasmid-transfected, mock-infected cells at 6 hpi. (E, F, G) HEK-293T cells were transiently transfected with a pCAGGS-IFI27-HA plasmid (IFI27 O.E.) or an emtpy pCAGGS plasmid (Empty) together with a pRL plasmid expressing RLuc luciferase, and 24h later, transfected cells were infected with VSV at a MOI 0.1. At 8 or 24 hpi, protein extracts were obtained. (E) The levels of RLuc luminescence were measured. All luminescence levels were compared respect to cells transfected with the empty plasmid and mock-infected during 8 h. Individual data points correspond to independent measures from different technical samples. (F). These protein extracts were also used to measure protein levels of eIF2α-P (S52), total eIF2α, PKR-P (T446), total PKR, IFI27-HA, and β-actin by Western blot employing their respective antibodies. Molecular weight is indicated on the right of the panels (in kilodaltons). Western blots were quantified by densitometry using ImageJ software. The amount of eIF2α-P (S52) was normalised to the amounts of total eIF2α and β-actin. The amount of PKR-P (T446) was normalised to the amounts of total PKR and β-actin (results of quantification shown in bars to the right of immunoblots, with levels relative to cells transfected with the empty plasmid and mock-infected during 8 h (G)). Data is represented as the means and standard deviations of the differentmeasures (Individual data points correspond to independent measures from different technical samples). p > 0.05, *p < 0.05, **p < 0.01, ***p < 0.001, **** p < 0.0001 (for comparisons using unpaired two-tailed Student’s t test in B and E). The asterisks above each bar represent the comparison vs. the empty control at each time and condition. These measures were performed in at least two independent experiments.
Fig 4
Fig 4. IFI27 KO impairs PKR activation after poly(I:C) treatment.
(A, B) WT or IFI27 KO A549-hACE2 cells were transiently transfected with a pRL plasmid expressing RLuc luciferase (pRL-Rluc), and 24h later, the cells were mock-transfected or transfected with increasing concentrations of poly(I:C) (50 or 250 ng/ml) for 7 h. (A) Protein extracts were obtained and the levels of RLuc luminescence were measured. All luminescence levels were compared with respect to mock-transfected, A549-hACE2 WT cells. Individual data points correspond to independent measures from different technical samples. ns (non-significant) p > 0.05, *p < 0.05, **p < 0.01, ***p < 0.001, **** p < 0.0001 (for comparisons using unpaired two-tailed Student’s t test in (A). (B) Protein extracts obtained by lysis were also used to measure protein levels of PKR-P (T446), total PKR and β-actin (loading control) by Western blot, employing their respective specific antibodies. Molecular weight is indicated on the right of the panels (in kilodaltons). Western blots were quantified by densitometry using ImageJ software. The amount of PKR-P (T446) was normalised by total PKR and β-actin (results of quantification showed in bars below immunoblots, with levels relative to mock-transfected A549-hACE2 WT cells). (C) A549-hACE2 IFI27 KO cells stably transfected with an empty plasmid (KO+emtpy), and IFI27 KO cells stably expressing IFI27-HA (KO + IFI27), were transiently transfected with the plasmid pRL-Rluc and 24h later, the cells were mock-transfected or transfected with increasing concentrations of poly(I:C) (50 or 250 ng/ml) for 8 h. Protein extracts were obtained and the levels of RLuc luminescence were measured. All luminescence levels were compared with respect to mock-transfected, A549-hACE2 IFI27 KO cells stably transfected with an empty plasmid. Individual data points correspond to independent measures from different technical samples. (D) WT or IFI27 KO A549-hACE2 cells were infected with SARS-CoV-2 (MOI 0.5). Protein extracts were obtained and used to measure protein levels of eIF2α-P (S52), total eIF2α, PKR-P (T446), total PKR and β-actin (loading control) by Western blot employing their respective antibodies. Molecular weight is indicated on the right of the panels (in kilodaltons). Western blots were quantified by densitometry using ImageJ software. The amount of eIF2α-P (S52) was normalised to the amounts of total eIF2α and β-actin. The amount of PKR-P (T446) was normalised to the amounts of total PKR and β-actin. Results of quantification are shown in bars to the right of immunoblots, with levels relative to mock-infected A549-hACE2 WT cells at 6 hpi. These measures were performed in at least two independent experiments.
Fig 5
Fig 5. IFI27 knock-down impairs PKR activation after SARS-CoV-2 infection and after poly(I:C) transfection.
(A, B) IFI27 knock-down was performed on A549-hACE2 WT cells. Cells were transfected twice, with a 24-hour gap between each transfection, either with a negative control non-targeting siRNA (siRNA Neg) or with an IFI27 siRNA (siRNA IFI27). 24 hours after the second siRNA transfection, cells were transfected with a pRL plasmid expressing RLuc luciferase, and 6 h later, cells were mock or SARS-CoV-2-infected for 24 hours (MOI 1). Protein extracts were obtained by lysis. (A) The levels of RLuc luminescence were measured (luminescence levels were compared respect to cells transfected with the control siRNA). Individual data points correspond to independent measures from different technical samples. (B) Protein extracts were used to measure protein levels of eIF2α-P (S52), total eIF2α, PKR-P (T446), total PKR and β-actin by Western blot employing their respective antibody. Molecular weight is indicated on the right of the panels (in kilodaltons). Western blots were quantified by densitometry using ImageJ software. The amount of eIF2α-P (S52) was normalised by total eIF2α and β-actin. The amount of PKR-P (T446) was normalised by total PKR and β-actin (results of quantification showed in bars at the right side of immunoblots, with levels relative to cells transfected with the control siRNA). (C, D) IFI27 knock-down was performed on HeLa WT cells. Cells were transfected twice, with a 24-hour gap between each transfection, either with a negative control non-targeting siRNA (siRNA Neg) or with an IFI27 siRNA (siRNA IFI27). 24 hours after the second siRNA transfection, cells were transfected with a pRL plasmid expressing RLuc luciferase, and 6 h later, cells were mock or poly(I:C)-transfected at 2 µg/ml for 16 hours. Protein extracts were obtained by lysis and the levels of RLuc luminescence were measured (C) (luminescence levels were compared respect to cells transfected with the control siRNA and mock-transfected, individual data points correspond to independent measures from different technical samples) or (D) used to measure protein levels of eIF2α-P (S52), total eIF2α, PKR-P (T446), total PKR and β-actin by Western blot employing their respective antibody. Molecular weight is indicated on the right of the panels (in kilodaltons). Western blots were quantified by densitometry using ImageJ software. The amount of eIF2α-P (S52) was normalised by total eIF2α and β-actin. The amount of PKR-P (T446) was normalised by total PKR and β-actin (results of quantification showed in bars at the right side of immunoblots, with levels relative to cells transfected with the control siRNA and non-transfected with poly(I:C)). Data is represented as the mean and standard deviations of the different measures. ns (non-significant) p > 0.05, *p < 0.05, **p < 0.01, ***p < 0.001, **** p < 0.0001 (for comparisons using unpaired two-tailed Student’s t test in A and C). These measures were performed in two independent experiments.
Fig 6
Fig 6. PACT absence impairs IFI27-mediated PKR activation (A) HeLa WT, PACT KO and PKR KO cells were transiently transfected with a pCAGGS-IFI27-HA plasmid (IFI27 O.E.) or an emtpy pCAGGS plasmid (Empty) together with a pRL plasmid expressing RLuc luciferase, and 24h later, cells were mock-transfected or transfected with poly(I:C) at 2 µg/ml for 7 hours. At 24 hours post-treatment, protein extracts were obtained by lysis and the levels of RLuc luminescence were measured (A). All luminescence levels were compared with respect to the levels in HeLa WT cells transfected with the empty plasmid. Individual data points correspond to independent measures from different technical samples. (B) Same protein extracts from HeLa WT and HeLa PACT KO cells, either mock-transfected or transfected with poly(I:C) were employed to measure the protein levels of eIF2α-P (S52), total eIF2α, PKR-P (T446), total PKR and β-actin by Western blot employing their respective antibodies. Molecular weight is indicated on the right of the panels (in kilodaltons). Western blots were quantified by densitometry using ImageJ software. The amount of eIF2α-P (S52) was normalised by total eIF2α and β-actin. The amount of PKR-P (T446) was normalised by total PKR and β-actin (results of quantification showed in bars below the immunoblots, with levels relative to HeLa WT cells transfected with the empty plasmid, under mock conditions, non-transfected with poly(I:C)). Data is represented as the mean and standard deviations of the different measures, being the data representative of two independent experiments. ns (non-significant) p > 0.05, *p < 0.05, **p < 0.01, ***p < 0.001, **** p < 0.0001 (for comparisons using unpaired two-tailed Student’s t test in A).
Fig 7
Fig 7. IFI27 promotes the formation of SGs in a PACT-dependent manner. (A) HeLa WT cells were treated with poly(I:C) at 2 µg/ml for 7 hours and then, cells were fixed with formaldehyde and permeabilized.
PKR and eIF3η or PKR and G3BP1 were labelled with specific antibodies for each protein. PKR is shown in red, eIF3η and G3BP1 are shown in green, and nuclei were stained with DAPI and shown in blue. Areas of co-localization of both proteins appear in yellow in the third picture and in white in the fourth picture. Scale bar, 10 μm. (B and C) HeLa WT and HeLa PACT KO cells were transiently transfected with either a pCAGGS-IFI27-HA plasmid or a pCAGGS empty plasmid, and 24 hours later, treated with poly(I:C) at 2 µg/ml for 7 hours. Then, cells were fixed with formaldehyde and permeabilized. (B and C) An immunofluorescence was performed for both eIF3η and G3BP1 as markers of SGs. White arrows (B) show cells with no presence of SGs, while the red arrows (B) showcells with positive presence of SGs. (C) Quantification of the percentage of SGs positive cells within the total number of counted cells for each condition is represented. Each dot indicates the percentage of SGs positive cells within a single region, having each region several cells. The total number of counted cells was 1379 and 1305 cells for WT cells transfected with the empty plasmid and the plasmid for IFI27 overexpression, and 690 and 590 cells for PACT KO cells transfected with the empty plasmid and the plasmid for IFI27 overexpression. Scale bar, 30 μm. Data is represented as the mean and standard deviations of the different measures. ns (non-significant) p > 0.05, *p < 0.05, **p < 0.01, ***p < 0.001, **** p < 0.0001 (for comparisons using unpaired two-tailed Student’s t test in C). (D and E) HeLa WT and HeLa PACT KO cells were transiently transfected with a pCAGGS-IFI27-HA plasmid, and 24 hours later, treated with poly(I:C) at 2 µg/ml for 7 hours. Then, cells were fixed with formaldehyde and permeabilized. IFI27-HA and G3BP1 were labelled with specific antibodies for each protein. (D) IFI27-HA is shown in red, G3BP1 is shown in green, and nuclei were stained with DAPI and shown in blue. Areas of co-localization of both proteins appear in yellow in the third picture. Scale bar, 30 μm. (E) A quantification of the total IFI27-HA positive cells counted (white bar), and the number of SGs positive cells within the total IFI27-HA positive cells (grey bar) is represented. The number of counted cells is shown on the x-axis, being the counted cells 136 and 60 for WT cells overexpressing IFI27 and WT cells overexpressing IFI27 and containing SGs, respectively, and 53 and 9 for PACT KO cells overexpressing IFI27 and PACT KO cells overexpressing IFI27 and containing SGs, respectively. The percentage IFI27-HA positive cells containing SGs within the total IFI27-HA positive cells is shown next to the grey bar.
Fig 8
Fig 8. IFI27 promotes the activation after PKR overexpression in a PACT-dependent manner.
(A) A549-hACE2 WT and A549-hACE2 IFI27 KO cells were transiently transfected with a pCAGGS-PKR-myc plasmid (PKR O.E.) or an Empty pCAGGS plasmid (Empty) in combination with an Rluc expressing pRL plasmid. 24h later, protein extracts were obtained by lysis and the levels of RLuc luminescence were measured. All luminescence levels were compared with respect to A549-hACE2 WT cells transfected with the empty plasmid. Individual data points correspond to independent measures from different technical samples. (B) HeLa WT, PACT KO, PKR KO or double KO for PACT and PKR (DKO) were transiently transfected with a pCAGGS-PKR-myc plasmid (PKR O.E.) alone or in combination with a pCAGGS-IFI27-HA plasmid (PKR + IFI27 O.E.). These plasmids were co-transfected together with a pRL plasmid expressing RLuc luciferase, and 24h later, the cells were left mock-transfected of transfected with poly(I:C) at 2 µg/ml for 7 hours. Then, protein extracts were obtained by lysis and the levels of RLuc luminescence were measured. All luminescence levels were compared respect to HeLa WT cells overexpressing PKR. Individual data points correspond to independent measures from different technical samples. Two independent experiments were performed with similar results. (C) HeLa WT and HeLa PACT KO cells were transiently transfected with either a pCAGGS-PKR-myc plasmid alone (PKR O.E.) or in combination with a pCAGGS-IFI27-HA (PKR + IFI27 O.E.) plasmid, and 24 hours later, transfected with poly(I:C) at 2 µg/ml for 7 hours. Then, cells were fixed with formaldehyde and permeabilized, and an immunofluorescence was performed for PKR (in green) and nuclei were stained with DAPI (in blue). White arrow (C) shows a cell with no presence of SGs, while the red arrow (C) shows a cell with positive presence of SGs. (D) Quantification of the percentage of SGs positive cells within the total number of counted cells for each condition is represented. Each dot indicates the percentage of SGs positive cells within a single region, having each region several cells. The total number of counted cells was 186 and 160 cells for WT cells transfected with the PKR plasmid alone, or with the PKR plasmid and the plasmid for IFI27 overexpression together, respectively; and 110 and 120 cells for PACT KO cells transfected with the PKR plasmid alone, or with the PKR plasmid and the plasmid for IFI27 overexpression together, respectively. Scale bar, 30 μm. Data is represented as the mean and standard deviations of the different measures. ns (non-significant) p > 0.05, *p < 0.05, **p < 0.01, ***p < 0.001, **** p < 0.0001 (for comparisons using unpaired two-tailed Student’s t test in A, B and D).
Fig 9
Fig 9. IFI27 interacts with PKR in a PACT-dependent manner.
HeLa WT and HeLa PACT KO cells were transiently transfected with a pCAGGS-IFI27-HA plasmid, and 24h later, the cells were transfected with poly(I:C) at 3000 ng/ml. At 24h after poly(I:C) transfection, cell lysates were incubated overnight at 4ºC with the PKR specific antibody together with protein A-sepharose resin. Eluates were analysed by Western blot, to detect PKR and IFI27 by employing anti-PKR (to detect endogenous PKR, top panel) and anti-HA (to detect IFI27-HA, bottom panel) both in the cellular lysates (Input) and after the Co-IP. Molecular weight is indicated on the right of the panels (in kilodaltons). These co-IPs were performed twice, in independent experiments.

Similar articles

References

    1. Carty M, Guy C, Bowie AG. Detection of Viral Infections by Innate Immunity. Biochem Pharmacol. 2021;183:114316. doi: 10.1016/j.bcp.2020.114316 - DOI - PubMed
    1. Akira S, Uematsu S, Takeuchi O. Pathogen recognition and innate immunity. Cell. 2006;124(4):783–801. doi: 10.1016/j.cell.2006.02.015 - DOI - PubMed
    1. Said EA, Tremblay N, Al-Balushi MS, Al-Jabri AA, Lamarre D. Viruses Seen by Our Cells: The Role of Viral RNA Sensors. J Immunol Res. 2018;2018:9480497. doi: 10.1155/2018/9480497 - DOI - PMC - PubMed
    1. Karikó K, Buckstein M, Ni H, Weissman D. Suppression of RNA recognition by Toll-like receptors: the impact of nucleoside modification and the evolutionary origin of RNA. Immunity. 2005;23(2):165–75. doi: 10.1016/j.immuni.2005.06.008 - DOI - PubMed
    1. Yoneyama M, Kato H, Fujita T. Physiological functions of RIG-I-like receptors. Immunity. 2024;57(4):731–51. doi: 10.1016/j.immuni.2024.03.003 - DOI - PubMed

LinkOut - more resources