

Shortening 7T MP2RAGE acquisition with compressed sensing: Evaluating quantitative accuracy and structural consistency
- PMID: 40522990
- PMCID: PMC12169513
- DOI: 10.1371/journal.pone.0325783
Shortening 7T MP2RAGE acquisition with compressed sensing: Evaluating quantitative accuracy and structural consistency
Abstract
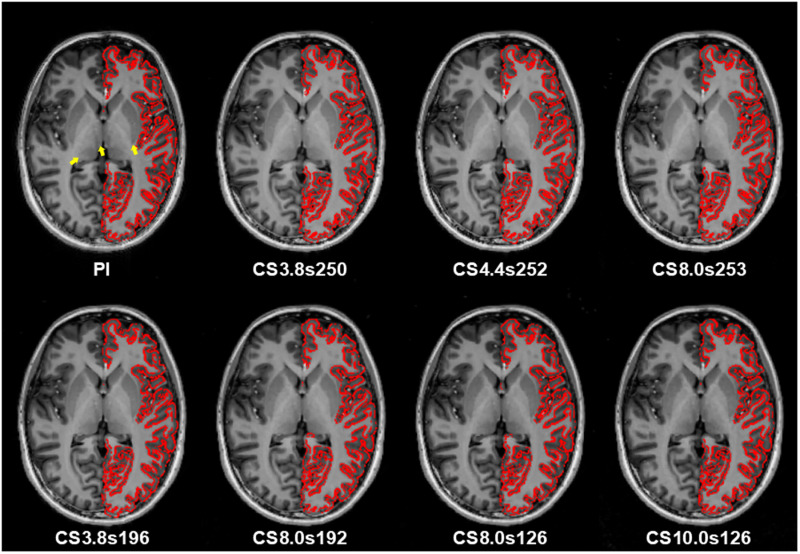
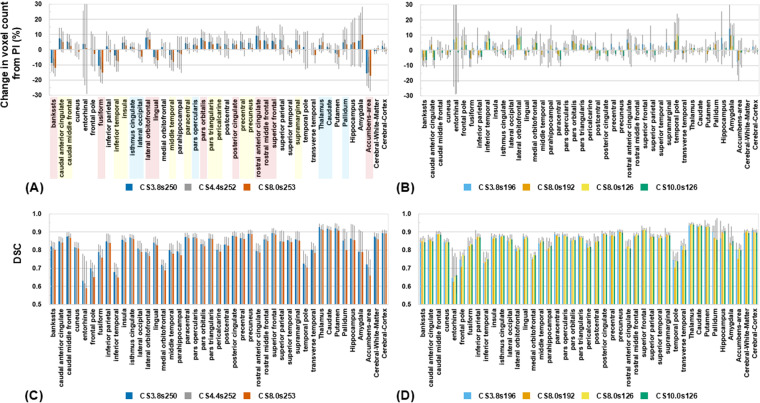
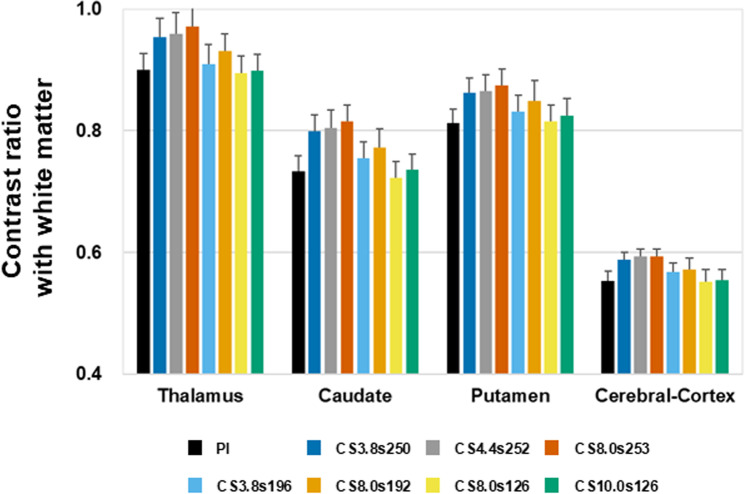
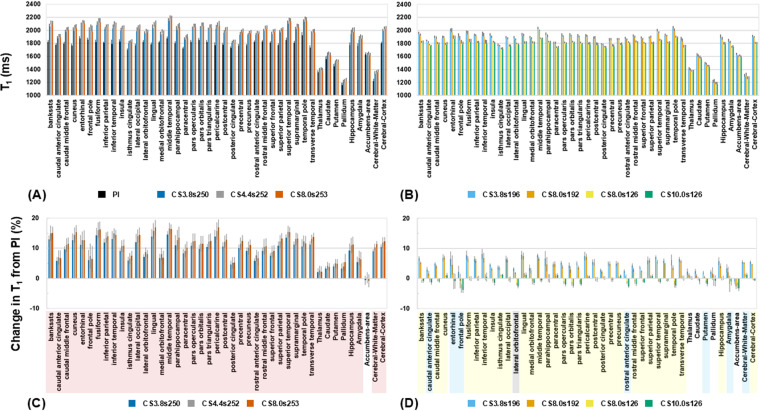
The aim of this study was to systematically evaluate the impact of compressed sensing (CS) on acquisition time, image quality, T1 mapping accuracy, and segmentation consistency in magnetization-prepared 2 rapid acquisition gradient echo (MP2RAGE) at ultra-high fields (UHF). MP2RAGE sequences were acquired using the CS and parallel imaging (PI) technique, i.e., generalized autocalibrating partially parallel acquisitions (GRAPPA), with varying undersampling factors and samples per repetition time (TR). The acquisition time, quantitative accuracy of T1 mapping, and segmentation consistency across regions of interest (ROIs) were assessed. CS-MP2RAGE achieved a 61% reduction in acquisition time (< 3 min) compared with PI-MP2RAGE and maintained comparable image quality, segmentation accuracy, and T1-mapping fidelity. Higher undersampling factors effectively reduced scan duration but introduced segmentation volume mismatches of up to 20% and increased T1 values, despite the images appearing similar to PI-MP2RAGE. Reducing the number of samples per TR enhanced image quality, allowing for higher undersampling factors without a significant loss of fidelity, a finding consistent with previous studies. However, excessively low sampling densities destabilized reconstruction in complex ROIs. Our findings demonstrate that CS-MP2RAGE significantly reduces scan time while maintaining high image quality and quantitative accuracy, making it a viable alternative to GRAPPA in UHF applications. The interplay between undersampling factors and samples per TR is crucial for optimizing scan efficiency. Future studies should explore its application in clinical and research settings.
Copyright: © 2025 Ikuhiro Kida. This is an open access article distributed under the terms of the Creative Commons Attribution License, which permits unrestricted use, distribution, and reproduction in any medium, provided the original author and source are credited.
Conflict of interest statement
The authors have declared that no competing interests exist.
Figures
Similar articles
-
Compressed-Sensing MP2RAGE sequence: Application to the detection of brain metastases in mice at 7T.Magn Reson Med. 2019 Jan;81(1):551-559. doi: 10.1002/mrm.27438. Epub 2018 Sep 9. Magn Reson Med. 2019. PMID: 30198115
-
Accelerated MP2RAGE imaging using Cartesian phyllotaxis readout and compressed sensing reconstruction.Magn Reson Med. 2020 Oct;84(4):1881-1894. doi: 10.1002/mrm.28244. Epub 2020 Mar 16. Magn Reson Med. 2020. PMID: 32176826
-
The Compressed Sensing MP2RAGE as a Surrogate to the MPRAGE for Neuroimaging at 3 T.Invest Radiol. 2022 Jun 1;57(6):366-378. doi: 10.1097/RLI.0000000000000849. Epub 2022 Jan 14. Invest Radiol. 2022. PMID: 35030106 Free PMC article.
-
Black-Blood Magnetization Prepared 2 Rapid Acquisition Gradient Echoes: A Fast and Three-Dimensional MR Black-Blood T1 Mapping Technique for Quantitative Assessment of Atherosclerosis and Venous Thrombosis.J Magn Reson Imaging. 2024 Sep;60(3):1148-1162. doi: 10.1002/jmri.29156. Epub 2023 Nov 27. J Magn Reson Imaging. 2024. PMID: 38009385
-
Comparison and calibration of MP2RAGE quantitative T1 values to multi-TI inversion recovery T1 values.Magn Reson Imaging. 2025 Apr;117:110322. doi: 10.1016/j.mri.2025.110322. Epub 2025 Jan 3. Magn Reson Imaging. 2025. PMID: 39756665
References
MeSH terms
LinkOut - more resources
Full Text Sources
Medical
Research Materials
Miscellaneous
