Randomized Controlled Trial
. 2025 Nov 1;57(11):2394-2408.
doi: 10.1249/MSS.0000000000003788. Epub 2025 Jun 13.

The Effects of Ingesting a Single Bolus of Hydrolyzed Collagen versus Free Amino Acids on Muscle Connective Protein Synthesis Rates

Affiliations
Randomized Controlled Trial

The Effects of Ingesting a Single Bolus of Hydrolyzed Collagen versus Free Amino Acids on Muscle Connective Protein Synthesis Rates

Thorben Aussieker et al. Med Sci Sports Exerc. .

Abstract

Purpose: This study aimed to assess the effect of ingesting a single bolus of hydrolyzed collagen or free amino acids on myofibrillar and muscle connective protein synthesis rates.

Methods: In a randomized, double-blind, parallel design, 45 young male ( n = 21) and female ( n = 24) adults (age, 23 ± 3 yr; BMI, 22.3 ± 2.2 kg·m -2 ) received intravenous infusions with L-[ ring - 13 C 6 ]-phenylalanine. After unilateral resistance exercise, participants ingested either 30 g hydrolyzed collagen (COLL, n = 15), 30 g free amino acids reflecting the collagen amino acid profile (AA, n = 15), or a noncaloric placebo (PLA, n = 15). Blood and muscle tissue samples were collected over 6 h to assess myofibrillar and muscle connective protein synthesis rates and associated signaling responses.

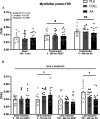
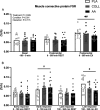
Results: Both collagen and free amino acid ingestion substantially increased circulating plasma amino acids concentrations and affected collagen turnover proteins. Collagen and free amino acid ingestion did not significantly increase myofibrillar protein synthesis rates in the rested (0.039 ± 0.011, 0.037 ± 0.010, and 0.036 ± 0.015%·h -1 in PLA, COLL, and AA, respectively) or the exercised (0.049 ± 0.010, 0.048 ± 0.011, and 0.045 ± 0.013%·h -1 ) leg ( P > 0.05). Similarly, both collagen and free amino acid ingestion did not significantly increase muscle connective protein synthesis rates in the rested (0.065 ± 0.014, 0.063 ± 0.017, and 0.061 ± 0.025%·h -1 in PLA, COLL, and AA, respectively) or the exercised (0.098 ± 0.023, 0.092 ± 0.028, and 0.085 ± 0.024%·h -1 ) leg ( P > 0.05).

Conclusions: The ingestion of a single bolus of collagen hydrolysate or free amino acids substantially increases circulating amino acids concentrations, particularly glycine, but does not further increase myofibrillar or muscle connective protein synthesis rates at rest or during recovery from exercise in healthy, recreationally active young men and women.

Keywords: CONNECTIVE TISSUE; GLYCINE; MYOFIBRILLAR PROTEINS; RESISTANCE EXERCISE.


Figures

FIGURE 1
FIGURE 1
Heat map of fold changes from t = 0 in plasma amino acid concentrations during the experimental test day with placebo, hydrolyzed collagen, or free amino acid ingestion during recovery from a single bout of unilateral leg resistance exercise. PLA, placebo (water, n = 15); COLL, 30 g hydrolyzed collagen (n = 15); AA, 30 g free amino acid mixture (n = 14). TAA, total amino acids; EAA, essential amino acids; BCAA, branched-chain amino acids; NEAA, nonessential amino acids. For hydroxyproline and hydroxylysine, values under the detection limit were set to 0. Values of t = 0 were set to 1.
FIGURE 2
FIGURE 2
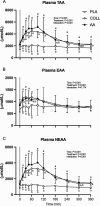
Postprandial plasma amino acid concentrations after placebo, hydrolyzed collagen, or free amino acid ingestion during recovery from a single bout of unilateral leg resistance exercise (t = 0–360 min). Data are displayed for TAA (A), EAA (B), and NEAA (C). The dotted line within the left column graphs represents the ingestion of the test drink. Values represent mean ± SD. Data were analyzed by a two-factor repeated-measures ANOVA. Bonferroni post hoc testing was used to detect differences between groups. Treatments without a common letter differ, P < 0.05. PLA, placebo (water, n = 15); COLL, 30 g hydrolyzed collagen (n = 15); AA, 30 g free amino acid mixture (n = 14). TAA, total amino acids; EAA, essential amino acids; NEAA, nonessential amino acids.
FIGURE 3
FIGURE 3
Postprandial plasma leucine, glycine, proline, hydroxyproline, and hydroxylysine concentrations after placebo, hydrolyzed collagen, or free amino acid ingestion during recovery from a single bout of unilateral leg resistance exercise (t = 0–360 min). Data are displayed for leucine (A), glycine (B), proline (C), hydroxyproline (D), and hydroxylysine (E). The dotted line represents the ingestion of the test drink. Values represent mean ± SD. Data were analyzed by a two-factor repeated-measures ANOVA. Bonferroni post hoc testing was used to detect differences between groups. Treatments without a common letter differ, P < 0.05. PLA, placebo (water, n = 15); COLL, 30 g hydrolyzed collagen (n = 15); AA, 30 g free amino acid mixture (n = 14).
FIGURE 4
FIGURE 4
Fractional myofibrillar protein synthesis rates (%.h−1) after placebo, hydrolyzed collagen, or free amino acid ingestion during recovery from a single bout of unilateral leg resistance exercise. A. Values for basal (t = −240–0 min) and full postprandial rates (t = 0–360 min). B. Values for the early (t = 0–180 min) and late (t = 180–360 min) postprandial response. Values represent mean ± SD. Data were analyzed by a two-factor repeated-measures ANOVA (A) and a three-factor repeated-measures ANOVA (B). Bonferroni post hoc testing was used when appropriate. * Different from basal, P < 0.05. # Different from REST, P < 0.05. FSR, fractional synthesis rate; PLA, placebo (water, n = 14); COLL, 30 g hydrolyzed collagen (n = 15; 14 for 7B); AA, 30 g free amino acid mixture (n = 14); REST, rested leg: EX, exercised leg.
FIGURE 5
FIGURE 5
Fractional muscle connective protein synthesis rates (%.h−1) after placebo, hydrolyzed collagen, or free amino acid ingestion during recovery from a single bout of unilateral leg resistance exercise. A. Values for basal (t = −240–0 min) and full postprandial rates (t = 0–360 min). B. Values for the early (t = 0–180 min) and late (t = 180–360 min) postprandial response. Values represent mean ± SD. Data were analyzed by a two-factor repeated-measures ANOVA (A) and a three-factor repeated-measures ANOVA (B). Bonferroni post hoc testing was used when appropriate. * Different from basal, P < 0.05. # Different from REST, P < 0.05. FSR, fractional synthesis rate; PLA, placebo (water, n = 14); COLL, 30 g hydrolyzed collagen (n = 15; 14 for 8B); AA, 30 g free amino acid mixture (n = 14); REST, rested leg: EX, exercised leg.
FIGURE 6
FIGURE 6
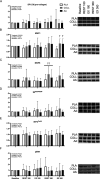
Skeletal muscle phosphorylation status (ratio of phosphorylated to total protein) of SP1.D8 (A), MMP1 (B), MMP8 (C), rpS6 (Ser240/Ser244) (D), peEF2 (Thr56) (E), and pERK (Thr 202/Tyr 204) (F), all measured by the Western blot technique. Values represent mean ± SD. Data were analyzed by a two-factor repeated-measures ANOVA. Bonferroni post hoc testing was used when appropriate. † Different from PLA, P < 0.05. †† Different from EX180, P < 0.05. PLA, placebo (water, n = 14); COLL, 30 g hydrolyzed collagen (n = 14); AA, 30 g free amino acid mixture (n = 14); REST, rested leg: EX, exercised leg.
FIGURE 7
FIGURE 7
Fractional skin protein synthesis rates (%.h−1) after placebo, hydrolyzed collagen, or free amino acid ingestion during the entire postprandial period (t = 0–360 min) and recovery from a single bout of unilateral leg resistance exercise. Values represent mean ± SD. Data were analyzed by a one-factor ANOVA. FSR, fractional synthesis rate; PLA, placebo (water, n = 15); COLL, 30 g hydrolyzed collagen (n = 15); AA, 30 g free amino acid mixture (n = 14).

References

    1. Koopman R, van Loon LJ. Aging, exercise, and muscle protein metabolism. J Appl Physiol (1985). 2009;106(6):2040–8. - PubMed
    1. Huijing PA. Muscle as a collagen fiber reinforced composite: a review of force transmission in muscle and whole limb. J Biomech. 1999;32(4):329–45. - PubMed
    1. Gillies AR, Lieber RL. Structure and function of the skeletal muscle extracellular matrix. Muscle Nerve. 2011;44(3):318–31. - PMC - PubMed
    1. Biolo G, Maggi SP, Williams BD, Tipton KD, Wolfe RR. Increased rates of muscle protein turnover and amino acid transport after resistance exercise in humans. Am J Physiol Endocrinol Metab. 1995;268(3):E514–20. - PubMed
    1. Phillips SM, Tipton KD, Aarsland A, Wolf SE, Wolfe RR. Mixed muscle protein synthesis and breakdown after resistance exercise in humans. Am J Physiol Endocrinol Metab. 1997;273(1):E99–107. - PubMed

Publication types