. 2025 Jun 17;16(1):452.
doi: 10.1038/s41419-025-07770-2.

Repurposing MDM2 inhibitor RG7388 for TP53-mutant NSCLC: a p53-independent pyroptotic mechanism via ROS/p-p38/NOXA/caspase-3/GSDME axis

Affiliations

Repurposing MDM2 inhibitor RG7388 for TP53-mutant NSCLC: a p53-independent pyroptotic mechanism via ROS/p-p38/NOXA/caspase-3/GSDME axis

Gaoyan Tang et al. Cell Death Dis. .

Abstract

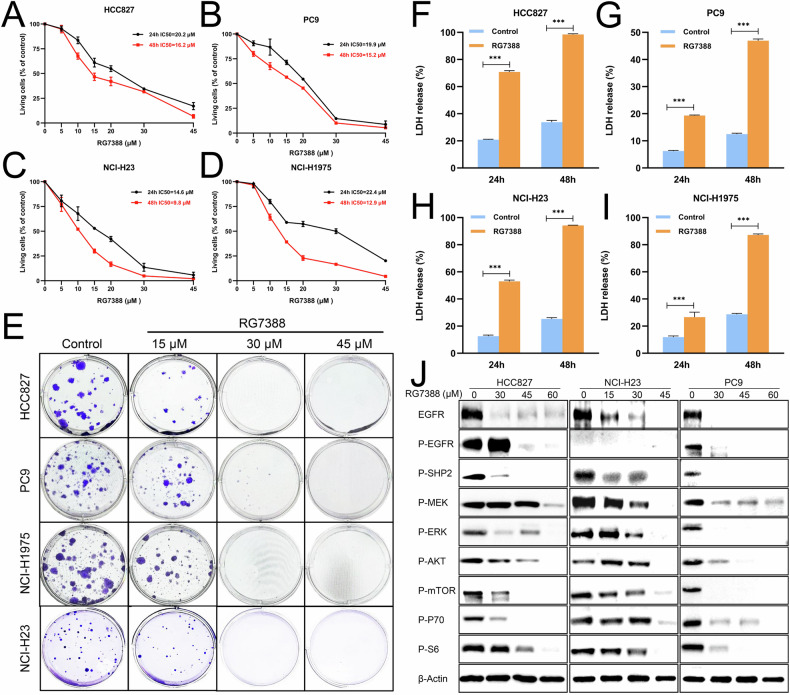
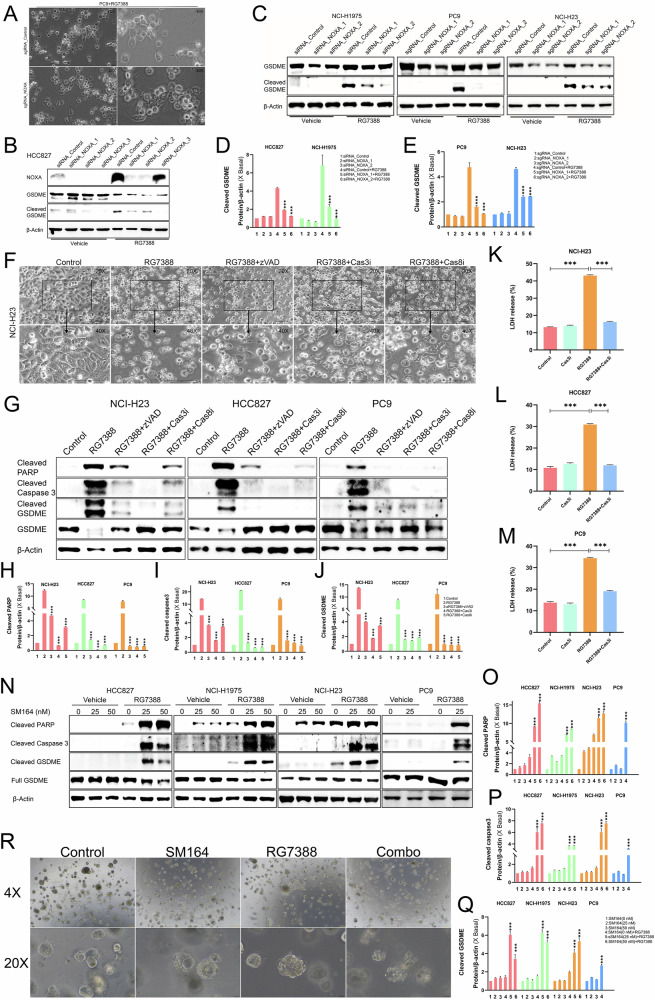
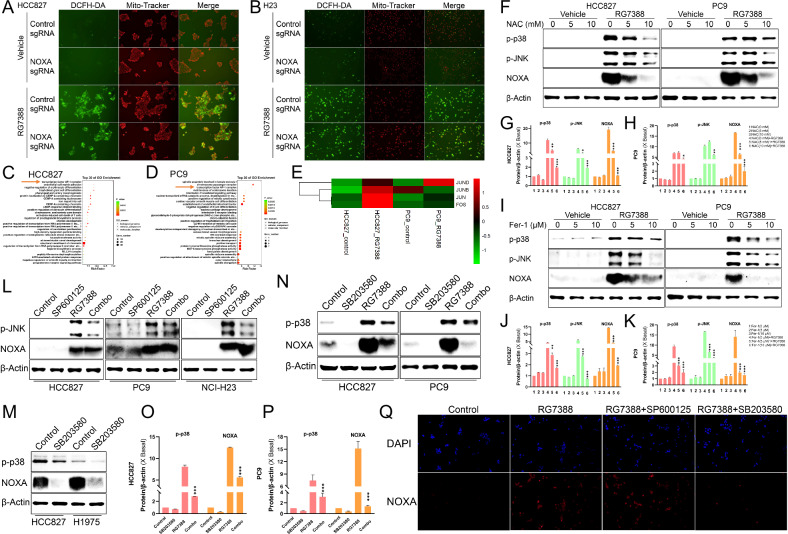
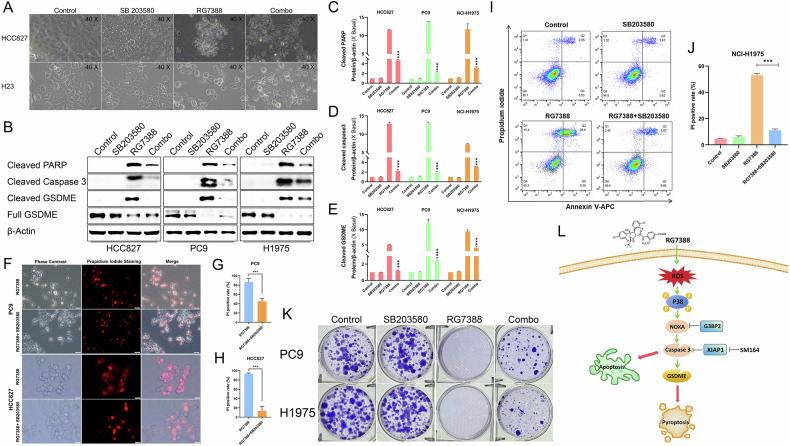
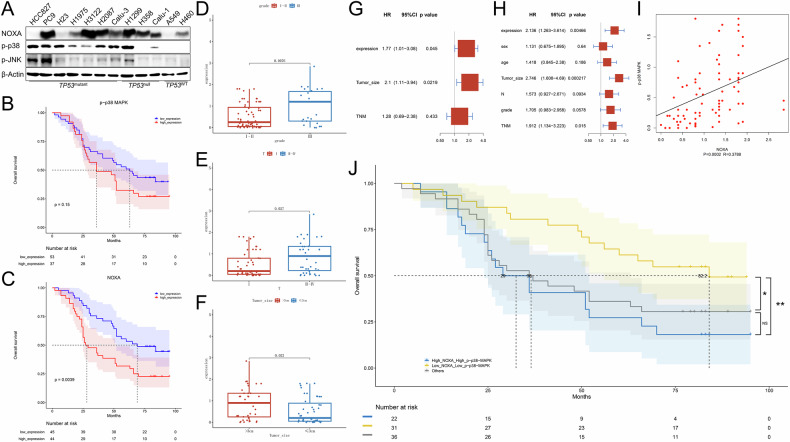
Non-small cell lung cancer (NSCLC) is highly malignant with limited treatment options, largely due to the inherent tumoral heterogeneity and acquired resistance towards chemotherapy and immunotherapy. RG7388, a known MDM2 inhibitor, exhibited anticancer activity in TP53-wild-type (TP53WT) NSCLC by triggering the p53/PUMA axis-dependent apoptosis. However, our study uncovered previously unrecognized p53-independent anticancer effects of RG7388 in TP53-mutant (TP53mutant) NSCLC, although the underlying mechanisms remained elusive. Here, we demonstrated that RG7388 specifically induced the NOXA/caspase-3 axis-dependent apoptosis and gasdermin E (GSDME)-mediated secondary pyroptosis in TP53mutant NSCLC, as validated through in silico analyses and multiple biological assays. Mechanically, we identified reactive oxygen species (ROS) as the critical mediator in NOXA upregulation and p38 MAPK pathway activation in RG7388 treated TP53mutant NSCLC. This was further supported by the use of ROS scavengers, N-acetylcysteine (NAC), and Ferrostatin-1 (Fer-1), which attenuated these effects. Pharmacologic inhibition of p38 MAPK signaling by SB203580 rescued RG7388-induced ROS-dependent NOXA accumulation and subsequent apoptosis and pyroptosis, highlighting the central role of the ROS/phosphorylated p38 MAPK (p-p38)/NOXA/caspase-3 axis in RG7388-induced TP53mutant NSCLC cell death. Our findings revealed a novel mechanism for selectively targeting mutant p53-derived cancer through ROS/p-p38-mediated NOXA accumulation, offering potential therapeutic implications given the current lack of direct mutant p53 targeting strategies in cancer. Furthermore, immunohistochemical (IHC) analysis of an NSCLC tissue microarray confirmed a strong positive correlation between p-p38 and NOXA expression. Clinical data analysis further suggested that the p-p38/NOXA axis might be a potential prognostic biomarker for overall survival (OS) in NSCLC patients.


Conflict of interest statement

Competing interests: The authors declare no competing interests.

Figures

Fig. 1
Fig. 1. The cytotoxicity effect of RG7388 in TP53mutant NSCLC.
AD IC50 assay for evaluating the sensitivity of a panel of TP53mutant NSCLC cell lines to RG7388. HCC-827 (A), PC9 (B), NCI-H1975 (C) and NCI-H23 (D) cells were treated with RG7388 at the indicated concentrations for 24 or 48 hours. The percentage of cell growth was shown relative to DMSO control. Data are shown as mean ± SD. E TP53mutant NSCLC cell lines (HCC-827, PC9, NCI-H1975 and NCI-H23) in 6-well plates were exposed to DMSO, 15, 30 or 45 μM RG7388 for 24 hours. After 2-3 weeks, the cells were fixed and stained. Representative staining images are shown. FI Quantification of tumor cell death, measured by LDH release in RG7388 (60 μM) treated HCC827 (F), PC9 (G), H23 (H), and H1975 (I), was presented for the indicated time. All results are shown as the mean ± SEM (n = 5). Student’s t-test was used to analyze the data; ***p < 0.001. J Immunoblot analysis of the indicated EGFR signaling pathway proteins in HCC827 (EGFR19del), NCI-H23 (EGFRWT) and PC9 (EGFR19del) cells upon treatment with increasing concentrations of RG7388 for 24 hours.
Fig. 2
Fig. 2. RG7388 triggered extrinsic apoptosis and pyroptosis pathways in TP53mutant NSCLC cells.
A Representative phase-contrast images of pyroptotic cell death induced by 60 μM RG7388 in TP53mutant NSCLC cell lines as indicated for 6 or 24 h. B, C Representative H&E (B) and Immunofluorescence (IF) (C) staining of TTF-1 (green) and p63 (red) for TP53mutant NSCLC organoids. Nuclei were stained with DAPI (blue). Scale bar, 100 μM (bottom panel). D Bright-field images of NSCLC organoids following treatment with 60 μM RG7388 or DMSO for 6 h. E Transmission electron microscopy observation of microstructural changes in PC9 cells treated by RG7388 (60 μM) for 6 hours. The red arrow indicated the pores on the plasma membrane. F Immunoblot analysis of protein abundance reflecting extrinsic apoptosis (cleaved caspase-3, cleaved caspase-7 and cleaved caspase-8) and pyroptosis (GSDME and cleaved GSDME) in RG7388 treated TP53mutant NSCLC cell lysates collected at distinct concentrations. GJ Immunoblot analysis of protein abundance reflecting apoptosis (cleaved caspase-3 and cleaved PARP) and pyroptosis (GSDME and cleaved GSDME) in RG7388 (60 μM) treated TP53mutant NSCLC cell lysates collected at distinct time points. The protein expression levels of cleaved GSDME (H), cleaved caspase-3 (I), and cleaved PARP (J) were semi-quantitatively assessed using ImageJ software. Quantitative data are presented as mean ± SD. ***p < 0.001.
Fig. 3
Fig. 3. NOXA was essential for RG7388-induced apoptosis in TP53mutant NSCLC.
A Gene set enrichment analysis (GSEA) showed that the p53 signaling pathway was altered in RG7388 treated cells compared with control cells in HCC827 and PC9 cells. B, C The volcano plot showed the differentially expressed genes induced by RG7388 in HCC827 cells (B) or PC9 Cells (C). Blue dots indicated downregulated genes; orange dots indicated upregulated genes. DF Immunoblot analysis of NOXA and cleaved PARP protein expression in HCC827, NCI-H23, PC9 and NCI-H1975 NSCLC cells treated with indicated concentrations of RG7388. The protein expression levels of cleaved PARP (E) and NOXA (F) were semi-quantitatively assessed using ImageJ software. Quantitative data are presented as mean ± SD. *p < 0.05, ***p < 0.001. GI Immunoblot analysis of NOXA, cleaved PARP, cleaved caspase-3 protein, and Cleaved GSDME expression in HCC827 and NCI-H23 NSCLC cells treated with 60 μM RG7388 at indicated time course. The protein expression levels of cleaved PARP, cleaved caspase-3, cleaved GSDME and NOXA in HCC827 (H) or H23 (I) were semi-quantitatively assessed using ImageJ software. Quantitative data are presented as mean ± SD. *p < 0.05, **p < 0.01, ***p < 0.001. J Immunoblot analysis of the effect of NOXA(PMAPI1) knockdown in PC9, H23 and H1975 cells by using the RNA interference (RNAi) technique. K Immunoblot analysis of the effect of NOXA(PMAPI1) knockout in PC9, HCC827 and H23 cells by using the Crispr-Cas9 gene editing technique. LN TP53mutant NSCLC cells transfected with siRNA-mediated knockdown of NOXA (siRNA-NOXA), CRISPR / Cas9 mediated knock out of NOXA (sgRNA-NOXA) or control (siRNA-Control or sgRNA-Control) were treated by 60 μM RG7388 for 6 h. Immunoblot analysis of cleaved PARP and cleaved caspase-3 protein. β-Actin served as a loading control. The protein expression levels of cleaved PARP (M) and cleaved caspase-3 (N) were semi-quantitatively assessed using ImageJ software. Quantitative data are presented as mean ± SD. ***p < 0.001. O Representative immunofluorescence (IF) images of caspase-3 activity examined by the GreenNuc kit (Green) and cell nucleus stained by DAPI (blue) in RG7388 (60 μM) treated HCC827 or H23 with NOXA KO for 6 h. PR Immunoblot analysis of NOXA and cleaved PARP protein expression in TP53mutant NSCLC cells induced by RG7388 (60 μM) treated with or without total caspase inhibitor Z-VAD-FMK (zVAD, 50 μM) or caspase-3 inhibitor Z-DEVD-FMK (Cas3i, 25 μM) as indicated for 6 h. The protein expression levels of cleaved PARP (Q) and cleaved NOXA (R) were semi-quantitatively assessed using ImageJ software. Quantitative data are presented as mean ± SD. ***p < 0.001.
Fig. 4
Fig. 4. NOXA/caspase-3 axis regulated RG7388 induced pyroptosis in TP53mutant NSCLC.
A Representative phase-contrast images of pyroptotic cell death induced by RG7388 in PC9 control cells and NOXA knock-out cells. BE TP53mutant NSCLC cells transfected with siRNA-mediated knockdown of NOXA (siRNA-NOXA), CRISPR / Cas9 mediated knock out of NOXA (sgRNA-NOXA) or control (siRNA-Control or sgRNA-Control) were treated by 60 μM RG7388 for 6 hours. Immunoblot analysis of GSDME and cleaved GSDME protein. β-Actin served as a loading control. The protein expression levels of cleaved GSDME were semi-quantitatively assessed using ImageJ software. Quantitative data are presented as mean ± SD. ***p < 0.001. F Representative phase-contrast images of pyroptotic cell death induced by RG7388 in H23 cells pre-treated with or without pan-caspase inhibitor Z-VAD-FMK (zVAD, 50 μM), caspase-8 inhibitor Z-IETD-FMK (Cas8i, 50 μM) or caspase-3 inhibitor Z-DEVD-FMK (Cas3i, 25 μM) as indicated for 6 hours. GJ Immunoblot analysis of cleaved PARP, cleaved caspase-3, GSDME and cleaved GSDME in the indicated cells. The cells were pretreated with 50 μM zVAD, 25 μM Cas3i or 50 μM Cas8i for 1 hour and then treated with 60 μM RG7388 for 6 h. The protein expression levels of cleaved PARP (H), cleaved caspase-3 (I), and cleaved GSDME (J) were semi-quantitatively assessed using ImageJ software. Quantitative data are presented as mean ± SD. ***p < 0.001. KM Cytotoxicity was detected using the LDH assay in H23 (K), HCC827 (L) or PC9 (M) cells induced by RG7388 (60 μM) in the presence or absence of Z-DEVD-FMK (Cas3i, 25 μM). All results are shown as the mean ± SEM (n = 5). ***p < 0.001 using Student’s t-test. NQ Immunoblot analysis of cleaved PARP, cleaved caspase-3, GSDME, and cleaved GSDME in the indicated cells treated with RG7388 (15 μM), SM164 (25 or 50 nM) or the combination of RG7388 and SM164 for 6 or 24 h. The protein expression levels of cleaved PARP (O), cleaved caspase-3 (P), and cleaved GSDME (Q) were semi-quantitatively assessed using ImageJ software. Quantitative data are presented as mean ± SD. ***p < 0.001. R Bright-field microscopic images of TP53mutant NSCLC organoids treated with RG7388 (15 μM), SM164 (25 nM), or the combination of RG7388 and SM164 for 24 h.
Fig. 5
Fig. 5. Mitochondrial ROS induced by RG7388 upregulated NOXA via p38 pathway.
A, B Detection of ROS by immunofluorescence of HCC827 (A) or H23 (B) cells stably transfected with non-targeting sgRNA or sgRNA-NOXA. ROS staining (green) and mitochondrial staining (red) are shown. CE Gene ontology (GO) enrichment analysis using differentially expressed genes showed strong clustering of transcription factor AP-1 complex genes (JUND, JUNB, JUN and FOS) which were altered in RG7388 treated cells compared with control cells in HCC827 and PC9 cells. FK Immunoblot analysis of p-p38, p-JNK, NOXA and β-actin expression in HCC827 or PC9 cells pre-treated with total ROS inhibitor NAC (F) or lipid ROS inhibitor Fer-1 (I) at the indicated concentration for 1 hour and then treated with 60 μM RG7388 for 6 hours. The protein expression levels of p-p38, p-JNK, and NOXA in HCC827 (G, J) or PC9 (H, K) were semi-quantitatively assessed using ImageJ software. Quantitative data are presented as mean ± SD. *p < 0.05, **p < 0.01, ***p < 0.001. L Immunoblot analysis of p-JNK, NOXA and β-actin expression in HCC827, PC9 or H23 cells pre-treated with 40 μM JNK inhibitor SP600125 for 1 hour and then treated with 60 μM RG7388 for 6 hours. M Immunoblot analysis of p-p38, NOXA and β-actin expression in HCC827 or H1975 cells treated with p38 inhibitor SB203580 (40 μM) for 6 h. NP Immunoblot analysis of p-p38, NOXA and β-actin expression in HCC827 or PC9 cells pre-treated with 40 μM SB203580 for 1 hour and then treated with 60 μM RG7388 for 6 h. The protein expression levels of p-p38 and NOXA in HCC827 (O) or PC9 (P) were semi-quantitatively assessed using ImageJ software. Quantitative data are presented as mean ± SD. ***p < 0.001. Q Representative IF images of NOXA intensity (Red) and nucleus stained with DAPI (blue) in HCC827 cells pre-treated with 40 μM SP600125 or SB203580 for 1 hour and then treated with 60 μM RG7388 for 6 h.
Fig. 6
Fig. 6. Pharmacological inhibition of the p38 pathway prevented TP53mutant NSCLC cells from RG7388-induced cell death.
A Representative phase-contrast images of pyroptotic cell death in HCC827 or H23 cells treated by RG7388 (60 μM), SB203580 (40 μM) or the combination of RG7388 and SB203580 for 6 hours. BE Immunoblot analysis of cleaved PARP, cleaved caspase-3, GSDME, and cleaved GSDME in the indicated cells treated with RG7388 (60 μM), SB203580 (40 μM) or the combination of RG7388 and SB203580 for 6 hours. The protein expression levels of cleaved PARP (C), cleaved caspase-3 (D), and cleaved GSDME (E) were semi-quantitatively assessed using ImageJ software. Quantitative data are presented as mean ± SD. ***p < 0.001. FH PC9 and HCC827 cells were treated with RG7388 or the combination of RG7388 and SB203580 for 6 hours. The dead cells were detected by Propidium Iodide (PI) staining. Representative images were shown (F). The percentage of PI-positive cells was counted (mean ± SE, n = 5 randomly selected microscope fields) (G, H). Student’s t-test was used to analyze the data; ***P < 0.001. I, J Annexin V/PI flow cytometry analysis of H1975 cells under RG7388, SB203580 or combined treatment for 6 h (I). The percentage of PI-positive cells was counted (mean ± SE, n = 3) (J). ***P < 0.001. K PC9 or H1975 cells in 6-well plates were exposed to DMSO, RG7388, SB203580 or the combination of RG7388 and SB203580 for 6 hours. After 3-4 weeks, the cells were fixed and stained. Representative staining images are shown. L Schematic illustration of ROS/p-p38/NOXA/caspase-3 axis in RG7388 induced TP53mutant NSCLC cell death.
Fig. 7
Fig. 7. Survival analysis of p-p38/NOXA axis in NSCLC patients.
A Immunoblot analysis was performed to evaluate the expression of NOXA, p-p38 and p-JNK in TP53mutant (HCC827, PC9, H23, H1975, H3122, H2087 and Calu-3), TP53null (H1299, H358 and Calu-1) and TP53wt (A549 and H460) cell lines. B, C Overall survival curves in NSCLC patients with differential expression of p-p38 MAPK (B) or NOXA (C) were calculated by Kaplan-Meier analysis and compared with the Log-rank test. All results are shown as the mean ± SEM (n = 5). One- or two-way ANOVA was used to analyze the data; *p < 0.05, **p < 0.01, ***p < 0.001. DF The associations between NOXA expression and the clinicopathological parameters of NSCLC patients including histological grade (D), T stage (E) and tumor size (F) were analyzed. G, H Univariate (G) and multivariate (H) analyses of the overall survival rate of NSCLC patients with the Cox proportional hazards model. I Pearson correlation coefficients of p-p38 and NOXA in tumor tissue chips from NSCLC patients and the p values are shown. J Overall survival curves in NSCLC patients with differential expression of combinations of p-p38 MAPK and NOXA were calculated by Kaplan–Meier analysis and compared with the Log-rank test. One- or two-way ANOVA was used to analyze the data; *p < 0.05, **p < 0.01.
Fig. 8
Fig. 8. RG7388 remodeled TME in TP53mutant NSCLC.
A The heatmap displayed the expression ratios of differentially expressed immune system-related genes in RG7388-treated HCC827 or PC9 cells. B Real-time PCR analysis for the relative expression levels of the immune-related genes in HCC827 or PC9 cells treated with 60 μM RG7388 or DMSO for 6 h. Data were presented as mean ± SEM from three independent experiments. Student’s t-test was used to analyze the data; *p < 0.05, **p < 0.01, ***p < 0.001. C HCC827 or PC9 cells were treated with 60 μM RG7388 or DMSO for 6 h. Supernatants were collected and assayed for IL-6, IL-8, IL-1α and IL-1β levels by ELISA. Data were represented as means ± SEM from three independent experiments. Student’s t-test was used to analyze the data; ***p < 0.001. D Protein levels of PD-L1 in TP53 knockdown TP53mutant NSCLC cells were determined by immunoblot analysis.

References

    1. Bray F, Laversanne M, Sung H, Ferlay J, Siegel RL, Soerjomataram I, et al. Global cancer statistics 2022: GLOBOCAN estimates of incidence and mortality worldwide for 36 cancers in 185 countries. CA Cancer J Clin. 2024;74:229–63. - PubMed
    1. Schabath MB, Cote ML. Cancer progress and priorities: lung cancer. Cancer Epidemiol Biomark Prev. 2019;28:1563–79. - PMC - PubMed
    1. Meyer ML, Fitzgerald BG, Paz-Ares L, Cappuzzo F, Jänne PA, Peters S, et al. New promises and challenges in the treatment of advanced non-small-cell lung cancer. Lancet. 2024;404:803–22. - PubMed
    1. Skoulidis F, Heymach JV. Co-occurring genomic alterations in non-small-cell lung cancer biology and therapy. Nat Rev Cancer. 2019;19:495–509. - PMC - PubMed
    1. Liu Y, Su Z, Tavana O, Gu W. Understanding the complexity of p53 in a new era of tumor suppression. Cancer Cell. 2024;42:946–67. - PMC - PubMed

MeSH terms