. 2025 Jun 16;8(1):366.
doi: 10.1038/s41746-025-01640-z.

Alzheimer's disease digital biomarkers multidimensional landscape and AI model scoping review

Affiliations

Alzheimer's disease digital biomarkers multidimensional landscape and AI model scoping review

Wenhao Qi et al. NPJ Digit Med. .

Abstract

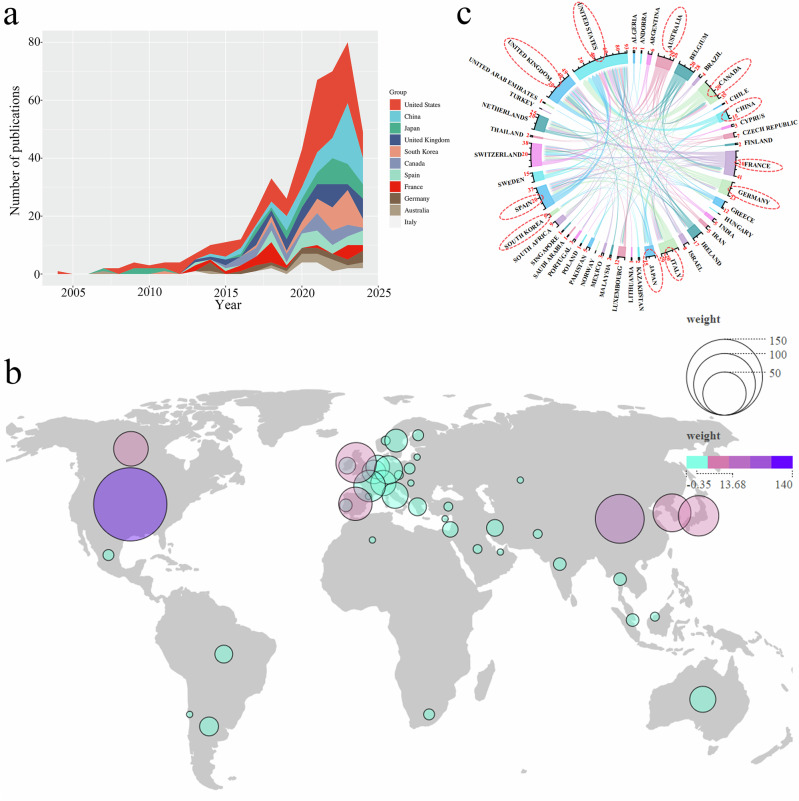
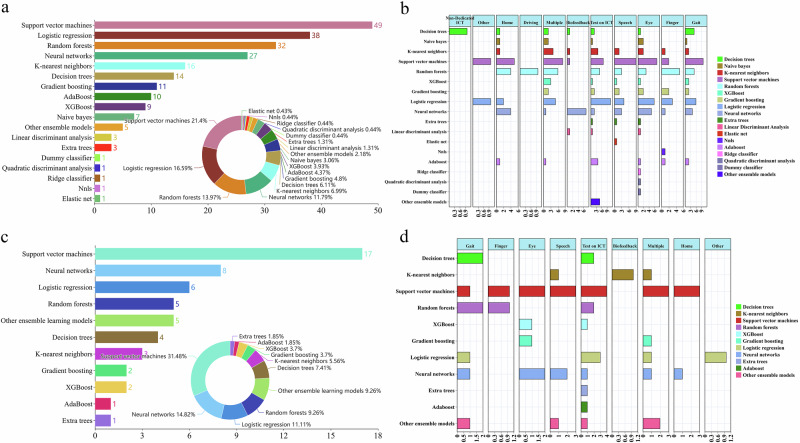
As digital biomarkers gain traction in Alzheimer's disease (AD) diagnosis, understanding recent advancements is crucial. This review conducts a bibliometric analysis of 431 studies from five online databases: Web of Science, PubMed, Embase, IEEE Xplore, and CINAHL, and provides a scoping review of 86 artificial intelligence (AI) models. Research in this field is supported by 224 grants across 54 disciplines and 1403 institutions in 44 countries, with 2571 contributing researchers. Key focuses include motor activity, neurocognitive tests, eye tracking, and speech analysis. Classical machine learning models dominate AI research, though many lack performance reporting. Of 21 AD-focused models, the average AUC is 0.887, while 45 models for mild cognitive impairment show an average AUC of 0.821. Notably, only 2 studies incorporated external validation, and 3 studies performed model calibration. This review highlights the progress and challenges of integrating digital biomarkers into clinical practice.


Conflict of interest statement

Competing interests: The authors declare no competing interests.

Figures

Fig. 1
Fig. 1. Literature retrieval and inclusion process flowchart.
a Flow diagram illustrating the PRISMA approach for the identification, screening, and selection of studies. b Specific research content.
Fig. 2
Fig. 2. Distribution and Trends in Alzheimer’s Disease Digital Biomarkers Diagnostic Research.
a Publication output distribution and trends over time. The red dashed line represents the trend line (aTrend line:y = 0.2297x2–1.775x + 3.8271). b Phases of publication output in Alzheimer’s disease digital biomarkers diagnostic research (aTrend line:y = 0.2297x2–1.775x + 3.8271). Asterisk indicates that the slope is significantly different from zero at the α = 0.05 level. Final selected model: 3 joinpoints.
Fig. 3
Fig. 3. Institutional Collaboration in Alzheimer’s Disease Digital Biomarkers Diagnostic Research.
a Distribution of institution types involved in Alzheimer’s disease digital biomarkers diagnostic research. b Output by institution type in Alzheimer’s disease digital biomarkers diagnostic research. c Network diagram of institutional collaboration. Color coding is used to display clusters, with institutions within the same cluster sharing the same color. The size of the circles increases with the number of publications. d Evolution of institutional collaborations over time. Color coding is used to represent the average time for constructing institutional collaboration networks. The size of the circles increases with the number of publications.
Fig. 4
Fig. 4. Productivity and Collaboration Among Nations in Alzheimer’s Disease Digital Biomarkers Diagnostic Research.
a Temporal distribution of output by high-producing countries. b Chord diagram of international collaborations among countries. c Geographic distribution map of publication by country in Alzheimer’s disease digital biomarkers diagnostic research. The colors representing countries/regions have no specific meaning; only the thickness of the lines between them is significant, indicating the frequency of collaboration between different countries. The thickness of the lines corresponds to the values on their respective axes.
Fig. 5
Fig. 5. Heatmaps of Disciplinary Publications in Alzheimer’s Disease Digital Biomarkers Diagnostic Research Over Three Time Periods.
a 2004–2012. b 2013–2018. c 2019–2024. Color indicates the popularity of a discipline during the given time period, with redder colors representing higher popularity and dominance.
Fig. 6
Fig. 6. Temporal Patterns of Disciplinary Publications in Alzheimer’s Disease Digital Biomarkers Diagnostic Research.
The different colors of the bars represent different disciplines, and the length of each bar indicates the proportion of output from a particular discipline during the specified period.
Fig. 7
Fig. 7. Types and Quantities of Funding in Alzheimer’s Disease Digital Biomarkers Diagnostic Research.
a Funding trends in Alzheimer’s disease digital biomarkers diagnostic research. The red dashed line represents the trend line (aTrend line:y = 0.7712x2–6.0744x + 9.2722), (b) Distribution of funding types. c Quantities of each type of funding.
Fig. 8
Fig. 8. Keywords Analysis in Alzheimer’s disease Digital Biomarkers Diagnostic Research.
a Temporal heatmap of high-frequency keywords. Color represents the proportion of keyword frequency for that year relative to the total frequency of the keyword. The more frequent the keyword, the redder the color, indicating a more mature topic. b Clustering diagram of keywords co-occurrence. Color coding is used to display clusters, with keywords within the same cluster sharing the same color.
Fig. 9
Fig. 9. Production, Distribution and Trends of Various Types of Alzheimer’s Disease Digital Biomarkers.
The pie chart is used to represent the proportion of research on different types of digital biomarkers, while the line chart illustrates the trend of changes in various digital biomarkers over time.
Fig. 10
Fig. 10. Sample Size Distribution in Alzheimer’s Disease Digital Biomarkers Research.
The violin plot displays the distribution of sample sizes for research on each type of digital biomarker. The different colors of the violins represent distinct categories of digital biomarker research. The body of the violin represents the primary distribution range of the research, with wider sections indicating a higher number of studies and narrower sections representing fewer studies.
Fig. 11
Fig. 11. A sankey diagram of the devices and paradigms commonly used in the collection of different digital biomarkers.
The left column shows the data collection paradigms, the middle column represents different types of digital biomarkers, and the right column lists the devices used for data collection.
Fig. 12
Fig. 12. Core Author Collaboration in Alzheimer’s Disease Digital Biomarkers Diagnostic Research.
a Network diagram of core author collaboration. Color coding is used to display clusters, with researchers within the same cluster sharing the same color. The size of the circles increases with the number of publications. b Average timeline of core author collaboration initiatives. Color coding is used to represent the average time for constructing researcher collaboration networks. The size of the circles increases with the number of publications.
Fig. 13
Fig. 13. Participation Rate of Disciplinary Backgrounds in Alzheimer’s Disease Digital Biomarkers Research.
a Annual participation rate changes in medical-related disciplines. b Annual participation rate changes in engineering-related disciplines.
Fig. 14
Fig. 14. Distribution of participants by disciplinary backgrounds in various types of Alzheimer’s disease digital biomarkers research.
LM limb movement, EM eye movement, TM Test on mobile or ICT devices, SM Speech markers, ND Natural driving, HA Home activity, UL non-dedicated ICT biomarkers, SP Sleep pattern, BP Biofeedback or physiological signal, Other Other biomarkers, Multiple Mutiple biomarkers.) The size of the circles represents the frequency, with larger circles indicating higher frequencies. Different colors represent different disciplines.
Fig. 15
Fig. 15. Heatmap of Interdisciplinary Collaboration Among Disciplines.
The size and color of the sector areas represent the strength of collaboration between different disciplines. The redder the color and the larger the sector area, the stronger the collaboration between disciplines.
Fig. 16
Fig. 16. The Process of Developing AI Models for Alzheimer’s Disease Digital Biomarkers.
a Recruiting Alzheimer’s disease patient samples to form the study cohort. b Collecting data from multiple devices, including wearables, smartphones, and others. c Using sensors, mobile applications, and other tools to acquire various digital biomarker data. d Extracting and analyzing feature data such as movement, speech, eye movement, and physiological signals. e Selecting appropriate machine learning and AI algorithms to train predictive models. f Applying the models for disease classification and prediction, aiding in early detection and management.
Fig. 17
Fig. 17. Spatial-temporal distribution of research output.
a Distribution of research years in AI model-based studies on digital biomarkers for Alzheimer’s disease diagnosis and prediction. The red dashed line represents the trend line (aTrend line:y = 0.2026x2–1.549x + 3.0714). b Regional distribution of AI model-based studies on digital biomarkers for Alzheimer’s disease diagnosis and prediction.
Fig. 18
Fig. 18. Distribution of AI Model Algorithms Used in Alzheimer’s Digital Biomarkers.
a Overall Use of AI model algorithms. b Distribution of AI model algorithm use across different types of digital biomarkers. c Use of AI model algorithms in comparative studies between models. d Use of AI model algorithms in comparative studies of different types of digital biomarkers.
Fig. 19
Fig. 19. Sunburst Chart Showing The Distribution of Specific Features Used in Various Digital Biomarker Studies.
Pie segments of the same color represent the features used in research on the same type of digital biomarker. The size of the segments indicates the frequency of feature usage, with larger areas reflecting more frequent usage.
Fig. 20
Fig. 20. The Box plot of Binary Classification Performance Based on AD and MCI AI Models.
Each point in the box plot represents an individual study. The horizontal line inside the box indicates the median of the data, while the whiskers represent the range of the maximum and minimum values. Data points outside the whiskers are considered outliers.
Fig. 21
Fig. 21. Box plot of AI Model Performance for Binary Classification Based on AD or MCI versus HC.
a AUC for AD and HC Classification, (b) ACC, (c) SEN, (d) SPE. e AUC for MCI and HC classification, (f) ACC, (g) SEN, (h) SPE.
Fig. 22
Fig. 22. Discussion on Digital Biomarker Research for Alzheimer’s Disease.
a The current multidimensional landscape of digital biomarkers in Alzheimer’s disease. b The five key dimensions of the challenges in clinical implementation of digital biomarkers. c The relationship between the main challenges, current status, and future prospects in the field of digital biomarkers for AD. The color of the circles represents the hierarchical relationships of the topics, while the arrows indicate the connections and directional relationships between all topics.
Fig. 23
Fig. 23. Flowchart and analytical content of the bibliometrics and content analysis method used in this study.
The image illustrates the three main issues addressed by the study, the analytical workflow, and the tools and methods employed.

Similar articles

Cited by

References

    1. Crowell, V. et al. Disease severity and mortality in Alzheimer's disease: an analysis using the U.S. National Alzheimer's Coordinating Center Uniform Data Set. BMC neurology23, 302 (2023). - PMC - PubMed
    1. 2023 Alzheimer’s disease facts and figures. Alzheimer’s & dementia: J. Alzheimer’s Assoc.19, 1598-1695 (2023). - PubMed
    1. Livingston, G. et al. Dementia prevention, intervention, and care: 2020 report of the Lancet Commission. Lancet (Lond., Engl.)396, 413–446 (2020). - PMC - PubMed
    1. Scheltens, P. et al. Alzheimer’s disease. Lancet (Lond., Engl.)397, 1577–1590 (2021). - PMC - PubMed
    1. Li, X. et al. Global, regional, and national burden of Alzheimer’s disease and other dementias, 1990-2019. Front. aging Neurosci.14, 937486 (2022). - PMC - PubMed

LinkOut - more resources