. 2025 Sep;20(9):1262-1272.
doi: 10.1038/s41565-025-01955-8. Epub 2025 Jun 16.

Nanoneedles enable spatiotemporal lipidomics of living tissues

Affiliations

Nanoneedles enable spatiotemporal lipidomics of living tissues

Chenlei Gu et al. Nat Nanotechnol. 2025 Sep.

Abstract

Spatial biology provides high-content diagnostic information by mapping the molecular composition of tissues. However, traditional spatial biology approaches typically require non-living samples, limiting temporal analysis. Here, to address this limitation, we present a workflow using porous silicon nanoneedles to repeatedly collect biomolecules from live brain tissues and map lipid distribution through desorption electrospray ionization mass spectrometry imaging. This method preserves the integrity of the original tissue while replicating its spatial molecular profile on the nanoneedle substrate, accurately reflecting lipid distribution and tissue morphology. Machine learning analysis of 23 human glioma biopsies demonstrated that nanoneedle sampling enables the precise classification of disease states. Furthermore, a spatiotemporal analysis of mouse gliomas treated with temozolomide revealed time- and treatment-dependent variations in lipid composition. Our approach enables non-destructive spatiotemporal lipidomics, advancing molecular diagnostics for precision medicine.


Conflict of interest statement

Competing interests: The authors declare no competing interests.

Figures

Fig. 1
Fig. 1. The molecular replica workflow.
The process begins with the collection of mouse brains and HG biopsies (1). Nanoneedle imprinting of these specimens (2) generates molecular replicas (3) that are analysed using DESI-MSI (4). Repeated sampling of molecular replicas from the same specimen over time enables study of the evolution of its metabolic profile (5). Specimens can also be processed to produce tissue sections proximal to the molecular replica (6) to obtain molecular (7) and morphological references (8). The analysis of the DESI-MSI datasets (9) provides information on the intensity distribution of key lipids to map the tissue composition (10) as well as the ability to identify tissue regions such as white matter, grey matter and different types of lesions (11) and to determine tissue similarity and grade from HG biopsies (12). The longitudinal analysis provides insights into a tissue’s response to treatment (13). Created with BioRender.com.
Fig. 2
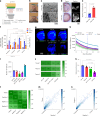
Fig. 2. Lipidomics imaging of molecular replicas.
a, Schematics of the nanoneedle imprinting system. Created with BioRender.com. b, Photographs illustrating the system approaching (top) and imprinting (bottom) nanoneedles on tissue. c, Scanning electron microscopy images of the molecular adsorbate on flat and nanoneedle substrates after imprinting. d, Photographs of the imprinted tissue and fluorescence microscopy images of the corresponding molecular replica. e, Quantification of replica-to-tissue area ratio. Data are mean ± s.e.m. (N = 3 independent biological replicates). Statistics: two-tailed unpaired t-test. f, Quantification of RNA, lipids and proteins from nanoneedle replicas with different surface chemistries (as-etched, APTES, oxidized) and a 10-µm brain tissue section. ata are mean ± s.e.m. (N = 3 independent biological replicates). Statistics: two-way ANOVA with a post-hoc Tukey’s multiple-comparisons test. g, DESI-MSI maps of grey matter (m/z 834.53, blue) and white matter (m/z 888.62, green) lipids from a tissue slice and molecular replicas generated using porous silicon nanoneedles (pSi nN), solid silicon nanoneedles (solid nN), porous silicon nanoneedles over a porous silicon layer (pSi nN + layer) and a porous silicon layer (pSi layer). h, Quantification of the number of features as a function of the confidence threshold set for peak identification in samples from g. Data are mean ± s.e.m. (N = 3 independent biological replicates). i, The feature count at a peak threshold of 2.0 (95% confidence) for samples from g. Data are mean ± s.e.m. (N = 3 independent biological replicates). j, The correlation matrix of spectra from three tissue sections and their corresponding replicas from g. k, The relative surface area of molecular replicas to original tissue for samples from g. Data are mean ± s.e.m. (N = 3 independent biological replicates). Statistics: ordinary one-way ANOVA with post-hoc Tukey’s multiple-comparisons test. l, A correlation matrix comparing three pSi nN replicas with the original tissue section. m, A correlation scatter plot of lipids peak intensities between the tissue section and the first replica. n, A correlation scatter plot of lipid peak intensities between the first and second replica. Source data
Fig. 3
Fig. 3. Spatial lipidomics of murine glioma replicas.
a, HCA maps of the top two clusters from the DESI-MSI data of a murine brain section and its molecular replica, corresponding to grey matter (blue) and white matter (yellow). b, Average spectra displaying normalized counts versus m/z, for the top two clusters associated with grey matter (GM) and white matter (WM) in section (S) and replica (R). c, Volcano plots of the differential lipid distribution between grey and white matter, highlighting the role of m/z 834.53 (PS 40:6) and 888.62 (SHexCer 42:2;O2) as grey and white matter biomarkers in both section and replica. d, An overlay map of TIC-normalized intensity for m/z 834.53 (blue) and 888.62 (yellow). e, HCA maps of the top three clusters from the DESI-MSI dataset of a tumour-bearing mouse brain section and replica, corresponding to grey matter (GM, blue), white matter (WM, yellow), and tumour (T, red). White boxes indicate regions used for lipid abundance analysis. f, Average spectra showing normalized counts versus m/z, for the three clusters associated with grey matter (GM), white matter (WM) and tumour (T) in section (S) and replica (R). g, Volcano plots comparing lipid distribution between GM and T, highlighting the most representative lipid peaks in both section and replica. h, An overlay map of cumulative TIC-normalized intensity for peaks marking grey matter (m/z 834.53 and m/z 600.51, blue), white matter (m/z 844.64, m/z 860.64 and m/z 888.62, yellow) and tumour (m/z 682.59, m/z 716.52 and m/z 736.65, red) in section and replica. The white boxes indicate regions used for lipid abundance analysis across GM, WM and T. i,j, Heatmaps showing the relative abundance of 33 lipid peaks (from analysis in g) along the major axis of the white box in e and h for the section (i) and replica (j). Top and bottom strips above each heatmap show the cluster assignment and relative lipid intensity for corresponding pixels from e and h. Source data
Fig. 4
Fig. 4. Spatial lipidomics of HG replica.
a, A bright-field image of the haematoxylin and eosin (H&E)-stained section of HG biopsy, showing infiltrated tumour (I), bulk tumour (T) and necrosis (N). b,c, HCA maps of the top three clusters from DESI-MSI images of the section (b) and replica (c). d, Volcano plots showing the differential lipid abundance analysis across I, T and N. consistently identifying m/z 600.51 (Cer 36:1;O2) for I, m/z 888.62 (SHexCer 42:2;O2) for T and m/z 680.54 (Cer 43:0;O3) for N in section and replica. e, A heatmap of the ten most representative lipids defining I, T and N in both section and replica. f, An overlay map of TIC-normalized intensity for m/z 600.51 (Cer 36:1;O2, red), 888.62 (SHexCer 42:2;O2, blue) and 680.54 (Cer 43:0;O3, yellow). Source data
Fig. 5
Fig. 5. Machine learning inference of HG grade.
a, A heatmap of correlation values between 25 tissue sections and 25 replicas from 23 biopsy samples. Samples are labelled HG plus a sequential number; multiple sections or replicas from the same biopsy include a trailing underscore and number. Sections are marked with ‘s’ and replicas with ‘r’. The red boxes indicate matched section–replica pairs. b, A count plot of correlation rank between matching tissue sections and molecular replicas. c, Pearson correlation analysis of the molecular replicas HG6_1-r, HG6_2-r, HG18_1-r and HG18_2-r, with all 25 sections. The arrows mark the reference HG6-s (blue) and HG18-s (orange) section. d, Receiver operator characteristics for the logistic regression classifier applied to the HG dataset. Data are mean ± s.d. from 100 random-seed classifications. e, Receiver operator characteristics for logistic regression cross-inference: model trained on sections, tested on replicas and vice versa. Data are mean ± s.d. from 100 random-seed classifications. TPR, true positive rate; FPR, false positive rate. f,g, SHAP value distributions of top-ranked features in the replica (f) and the section model (g). Positive SHAP values indicate contribution to high-grade predictions. h, TIC-normalized ion maps of selected replicas (R) and tissue sections (S) showing the top four peaks from f, alongside H&E-stained morphology. Source data
Fig. 6
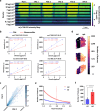
Fig. 6. Spatiotemporal lipidomics of molecular replicas.
a, A schematic of the longitudinal analysis workflow. Created with BioRender.com. b, Photographs (left) of brain 1 (B1) showing treated (T1) and untreated (T0) tissue slices at day 0 (D0) and day 5 (D5), with corresponding DESI-MSI maps (right) of grey matter (m/z 600.51, blue), white matter (m/z 888.62, yellow) and tumour (m/z 682.59, red) markers from molecular replicas of the photographed acute tissue slice. c, Quantification of grey matter, white matter and tumour areas from DESI-MSI molecular replicas data across time and treatment in three brain slices. Statistics: ordinary two-way ANOVA with post-hoc Šidák multiple-comparisons test. n.s., not significant. d, A volcano plot of lipid changes over time in untreated brains, highlighting markers for white matter (yellow), grey matter (blue) and tumour (red) and significantly increased (brown) or decreased (purple) species. N = 3 brain slices. e, A heatmap of the differentially abundant species (orange and purple) shown in d. fh, Violin plots of grey matter (f), white matter (g) and tumour (h) marker abundance in brain 1 across time and treatment. Data: solid line: median; dashed lines: upper and lower quartiles. i, A heatmap of z scores for treatment-dependent significant lipids. j, DESI-MSI maps of treated and untreated molecular replicas at day 0 and day 5 for the lipid at m/z 692.45 (PS 29:0, red) in the tumour alongside grey matter (m/z 600.51, Cer 36:1;O2, blue) and white matter (m/z 888.62, SHexCer 42:2;O2, yellow) markers. k, Violin plots of m/z 692.45 (PS 29:0) abundance. Data: solid line: median; dashed lines: upper and lower quartiles. Source data
Extended Data Fig. 1
Extended Data Fig. 1. Lipidomics on nanoneedles.
(a) DESI-MSI intensity maps showing the most intense peak at m/z 788.55 (PS 36:1) from porcine brain homogenate drop-deposited onto three flat and three nanoneedle chips, across a density range of 0–20 μg/cm². (b) Calibration curves derived from the DESI-MSI of porcine brain homogenate in panel (a), relative to lipid peaks m/z 700.52 (PE O-34:2), 788.55 (PS 36:1), 834.53 (PS 40:6), and 885.55 (PI 38:4). The standard deviation of the blank(σblank) and the calculated limit of detection (LOD) are provided. Data: mean ± s.e.m., (N = 3 independent experimental replicates). (c) Correlation scatter plot of spectra from flat and nanoneedle surfaces at a concentration of 7 µg/cm², illustrating the relative abundance of all detected species. (d-f) Optimization of DESI imaging conditions for nanoneedles: (d) maps depicting the number of features from three mouse liver replicas on nanoneedles, imaged with standard (std, left) and optimized (opt, right) DESI parameters. (e) Quantitative analysis of the number of features as a function of the confidence threshold set for peak identification, under standard (std) and optimized (opt) DESI-MSI conditions. Data: mean ± s.e.m., with 95% confidence and prediction bands from a nonlinear fit (one-phase decay model). (f) Bar graph comparing the number of features before (std) and after (opt) the optimization of DESI parameters at a peak threshold value of 2.0, corresponding to the 95% confidence threshold. Data: mean ± s.e.m. (N = 3 independent biological replicates). Statistics: two-tailed unpaired t test. Source data
Extended Data Fig. 2
Extended Data Fig. 2. Molecular replicas of living tissues.
(a) Fluorescence microscopy images of brain tissue slices showing total cells (blue) and dead cells (purple) after nanoneedle imprinting, compared with an untreated control. (b) Quantification of cell viability from (a). Data: mean with s.e.m. (N = 3 independent biological replicates). Statistics: two-tailed unpaired t-test. (c) Fluorescence microscopy images of total cells (blue) and dead cells (purple) in brain tissue slices over five days following first nanoneedle imprinting. (d) Quantification of cell viability from (c). Data: mean with s.e.m. (N = 3 independent biological replicates). Statistics: ordinary two-way ANOVA with post hoc Tukey’s multiple comparisons test. (e) Schematic indicating tumour and normal regions analysed in (f,g). Created in BioRender. Chiappini, C. (2025) https://BioRender.com/t7ha8ef. (f) Fluorescence microscopy images of normal and tumour regions showing total cells (blue) and dead cells (purple) after three days of culture with 1000 μM temozolomide or DMSO control. (g) Quantification of cell viability from (f). Data: mean with s.e.m. (N = 3 independent biological replicates). Statistics: ordinary two-way ANOVA with post hoc Šidák multiple comparisons test. (h) Quantification of the relative surface area of a molecular replica to its tissue sample on day 0 and day 5. Data: mean with s.e.m. (N = 3 independent biological replicates). Source data

References

    1. Kuett, L. et al. Three-dimensional imaging mass cytometry for highly multiplexed molecular and cellular mapping of tissues and the tumor microenvironment. Nat. Cancer3, 122–133 (2022). - PMC - PubMed
    1. Ravi, V. M. et al. Spatially resolved multi-omics deciphers bidirectional tumor–host interdependence in glioblastoma. Cancer Cell40, 639–655.e13 (2022). - PubMed
    1. Moncada, R. et al. Integrating microarray-based spatial transcriptomics and single-cell RNA-seq reveals tissue architecture in pancreatic ductal adenocarcinomas. Nat. Biotechnol.38, 333–342 (2020). - PubMed
    1. Bergholt, M. S. et al. Correlated heterospectral lipidomics for biomolecular profiling of remyelination in multiple sclerosis. ACS Cent. Sci.4, 39–51 (2018). - PMC - PubMed
    1. Jarmusch, A. K. et al. Lipid and metabolite profiles of human brain tumors by desorption electrospray ionization-MS. Proc. Natl Acad. Sci. USA113, 1486–1491 (2016). - PMC - PubMed

LinkOut - more resources