. 2025 Jun;57(6):1246-1259.
doi: 10.1038/s12276-025-01478-1. Epub 2025 Jun 16.

Thyrotropin exacerbates insulin resistance by triggering macrophage inflammation in subclinical hypothyroidism

Affiliations

Thyrotropin exacerbates insulin resistance by triggering macrophage inflammation in subclinical hypothyroidism

Haihong Zhang et al. Exp Mol Med. 2025 Jun.

Abstract

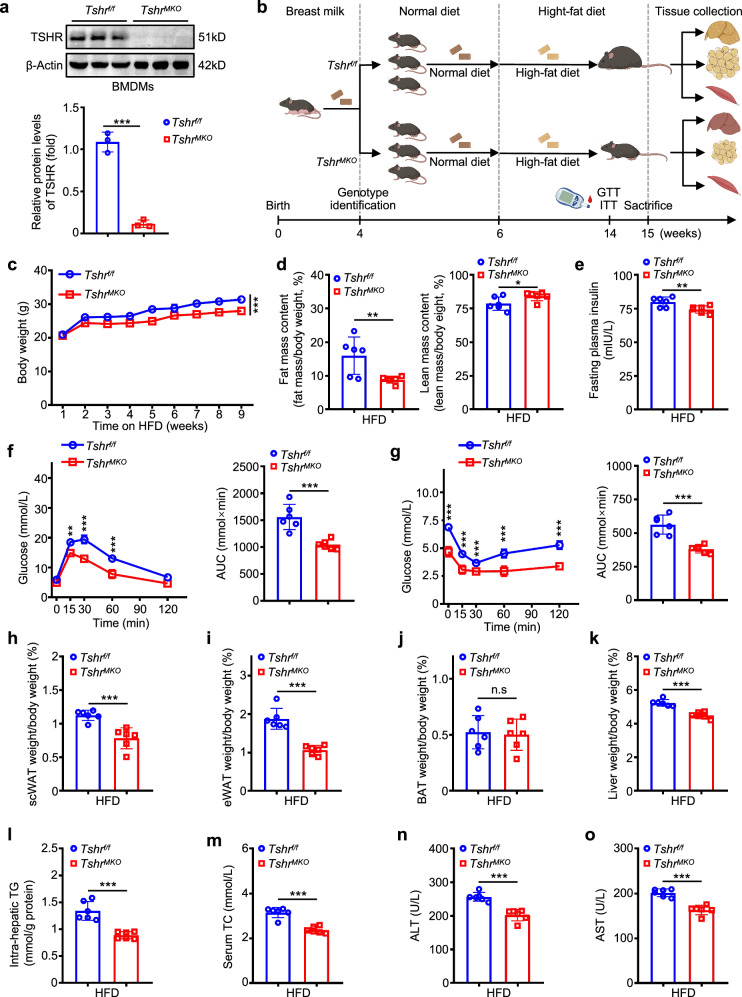
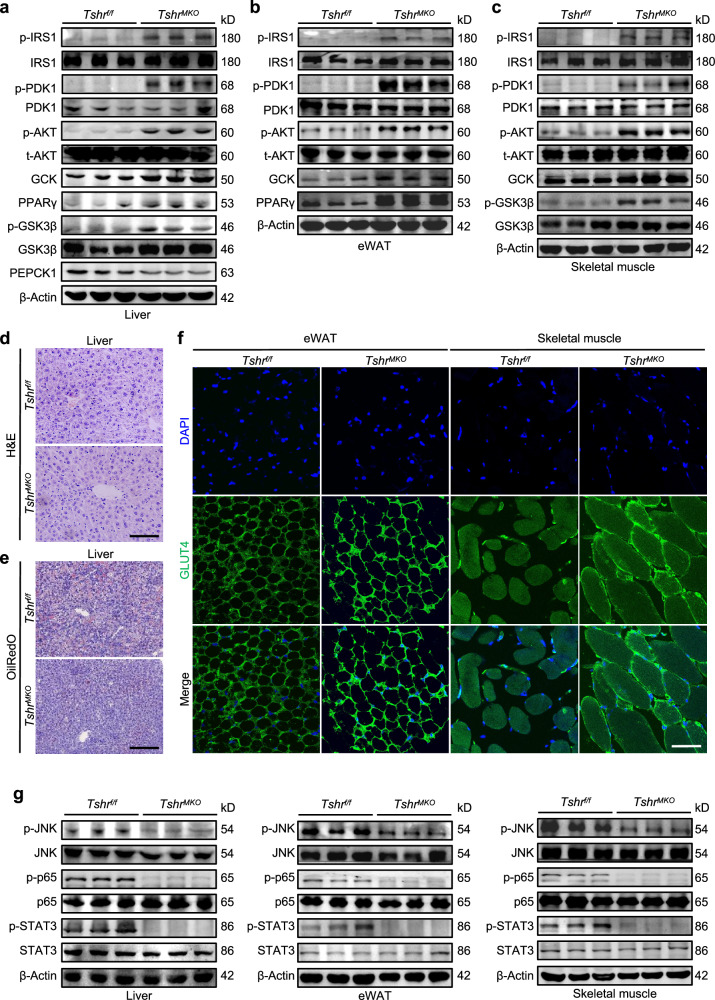
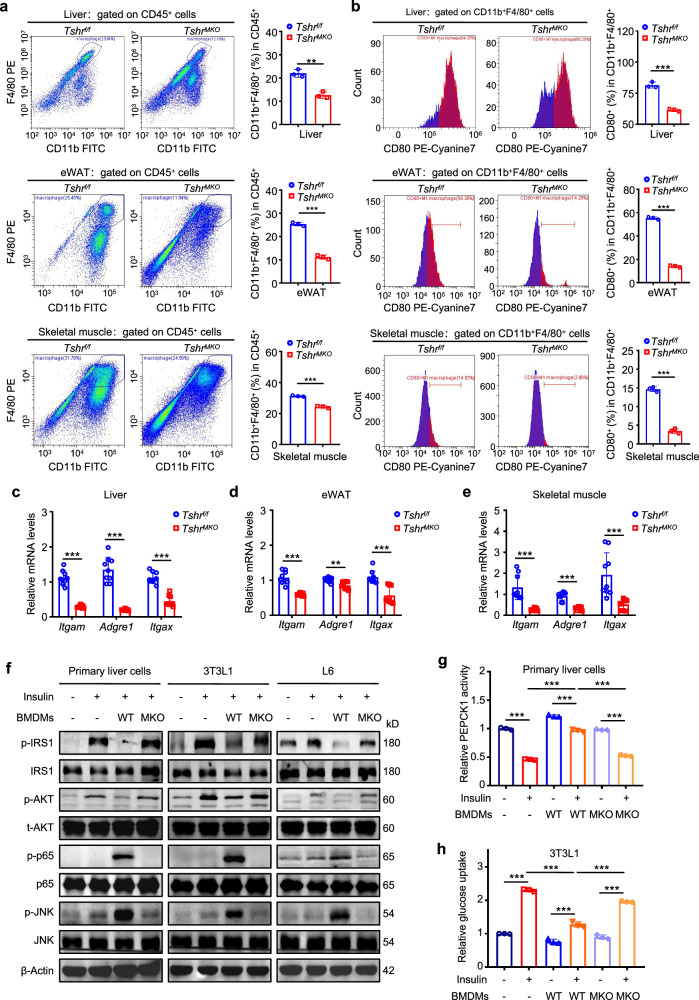
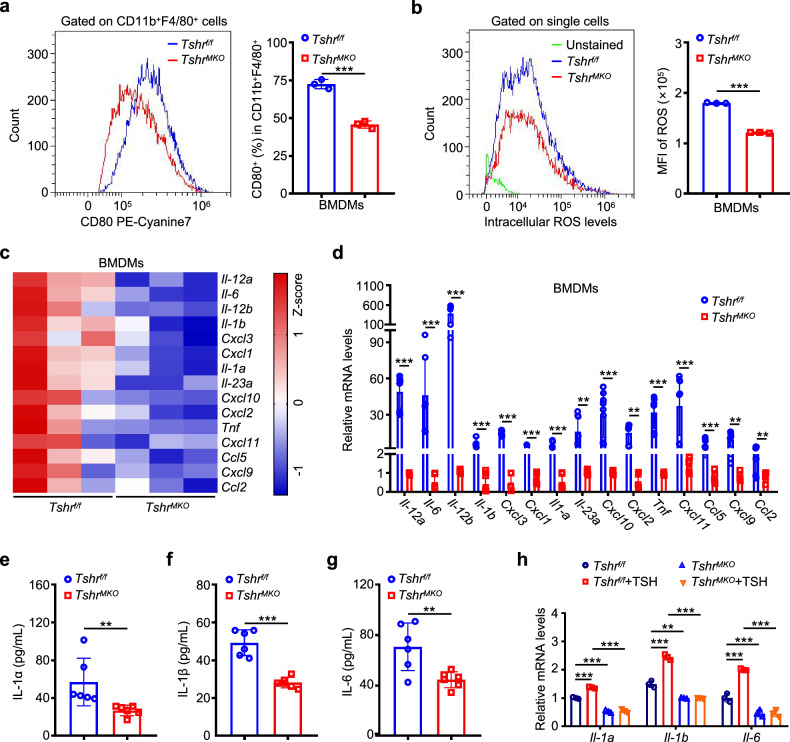
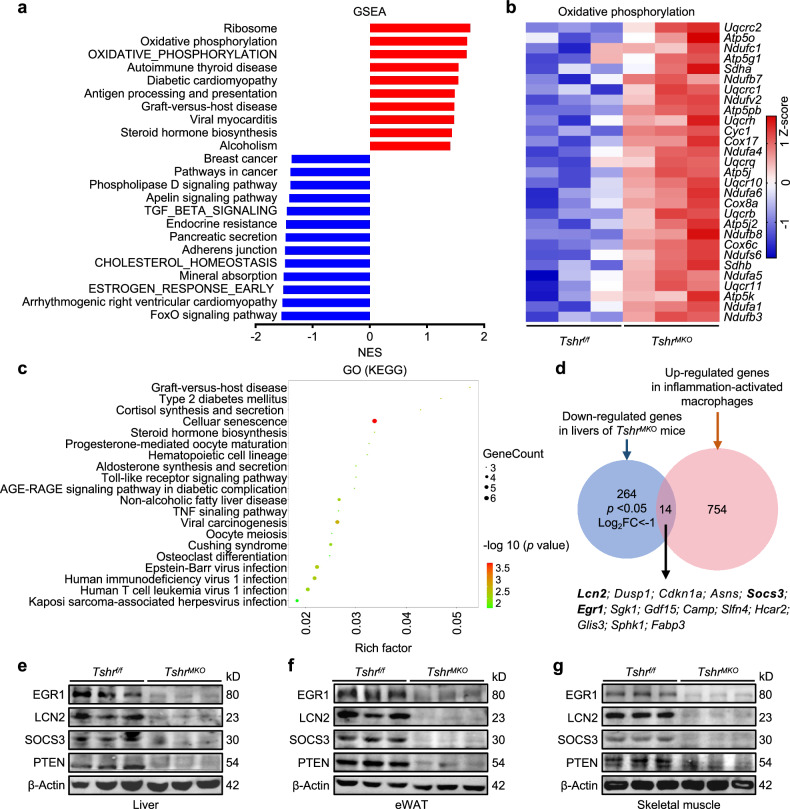
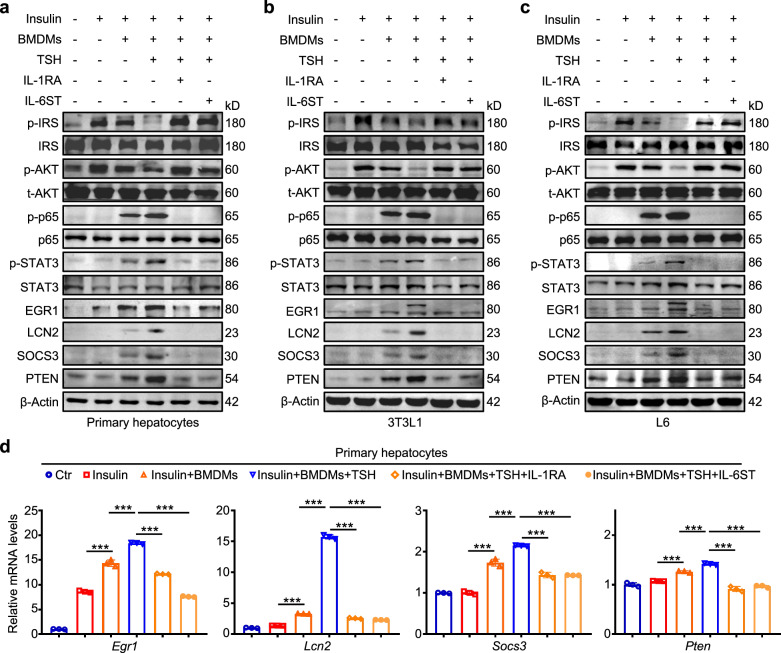
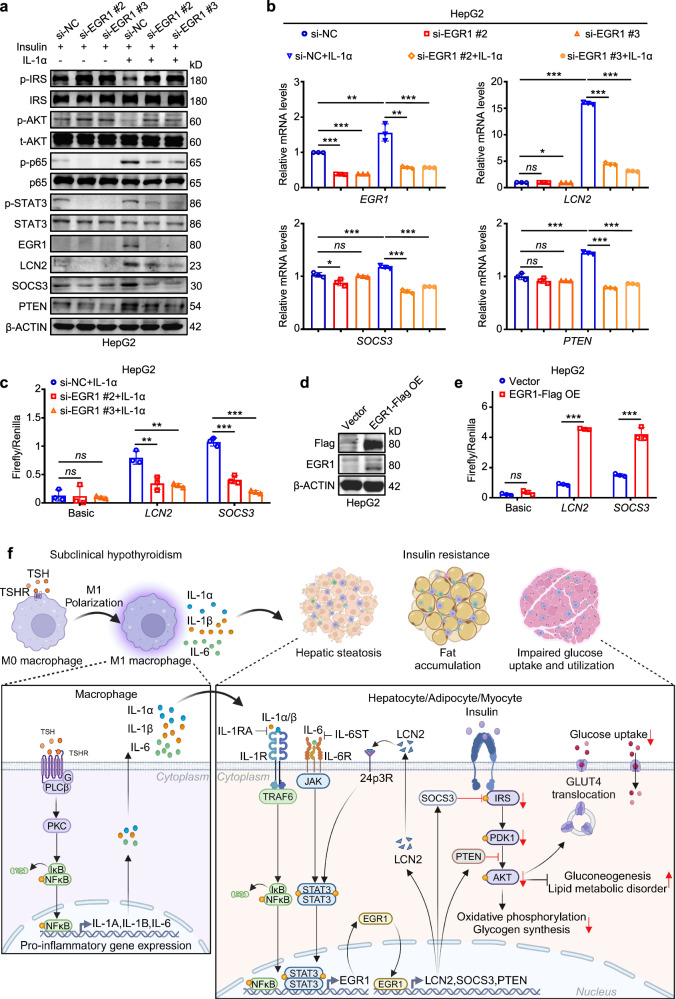
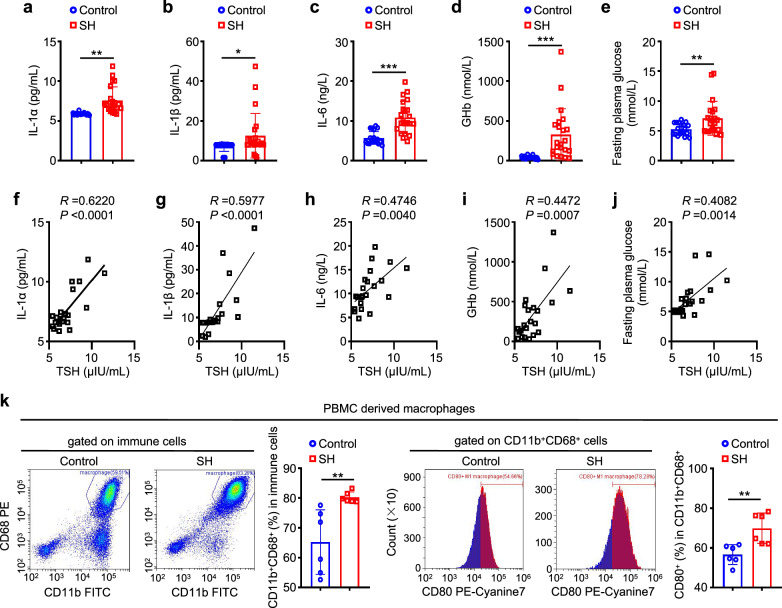
In subclinical hypothyroidism, the levels of serum thyroid-stimulating hormone (TSH) are positively correlated with insulin resistance; however, the precise mechanism is unclear. Except for thyroid follicular epithelial cells, macrophages express the highest levels of TSHR. Thus, we speculate that TSH may promote insulin resistance by triggering macrophage inflammation. Here we established a mouse model of TSH receptor (Tshr) myeloid-specific knockout (TshrMKO) and found that TshrMKO mice showed improvement on high-fat diet-induced obesity and insulin resistance compared with wild-type mice (Tshrf/f). In addition, TshrMKO mice exhibited decreased infiltration and M1 polarization of macrophages in liver, adipose and skeletal muscle. Co-culture experiments proved that Tshr-deficient macrophages decreased gluconeogenesis in hepatocytes but increased glucose uptake in adipocytes and skeletal muscle cells by improving the insulin signaling pathway. Mechanistically, increased TSH levels in subclinical hypothyroidism promoted the secretion of cytokines IL-1α, IL-1β and IL-6 by inducing macrophage M1 polarization, which upregulated EGR1 to transcriptionally activate LCN2 and SOCS3 in insulin target cells, thereby exacerbating insulin resistance. These effects could be reversed by IL-1 and IL-6 blockers IL-1RA and IL-6ST. Thus, we provided mechanistic insights into the predisposition to insulin resistance in subclinical hypothyroidism and revealed the role of TSH in metabolic disorders.


Conflict of interest statement

Competing interests: The authors declare no competing interests. Study approval: Protocols for animal research were approved by the Institutional Animal Ethics Committee of Xi’an Jiaotong University. In compliance with the Declaration of Helsinki, patients were anonymously coded for human experimentation involving specimens. The Institutional Review Board and Human Ethics Committee of the First Affiliated Hospital of Xi’an Jiaotong University authorized the study.

Figures

Fig. 1
Fig. 1. Myeloid Tshr deficiency improves HFD-induced insulin resistance and glucose intolerance.
a The protein levels of TSHR in BMDMs from TshrMKO mice and age-matched Tshrf/f littermates were determined by western blotting analysis (n = 3). b Schedule of the experiment. TshrMKO mice and age- and sex-matched Tshrf/f littermates (male, 6 weeks old) were fed a HFD for 9 weeks. GTT and ITT were tested at 14 weeks of age. At 15 weeks of age, tissues were collected. c Growth curves of body weight in HFD-fed TshrMKO and Tshrf/f mice (n = 6). d EchoMRI was used to measure the percentage of fat (left) and lean (right) body mass in HFD-fed TshrMKO and Tshrf/f mice (n = 6). e The levels of fasting plasma insulin were measured in the above mice after 8-h fasting (n = 6). f GTT (left) and area under the curve (AUC, right) in HFD-fed TshrMKO and Tshrf/f mice (n = 6). g ITT (left) and AUC (right) in HFD-fed TshrMKO and Tshrf/f mice (n = 6). Two groups of mice on HFD for 9 weeks were euthanized after 8-h fasting. hk The percentages of scWAT (h), eWAT (i), BAT (j) and liver weights to body weight (k) in HFD-fed TshrMKO and Tshrf/f mice (n = 6). lo Intrahepatic TG contents (l) as well as serum levels of total cholesterol (TC) (m), ALT (n) and AST (o) were measured using the respective commercial kits (n = 6). Data are presented as mean ± standard error of the mean (s.e.m.) (c, f and g) and as mean ± s.d. (a, d, e and ho). *P < 0.05, **P < 0.01, ***P < 0.001; ns, not significant (two-way analysis of variance (ANOVA) for c, f and g; unpaired two-tailed Student’s t-test for a, d, e and ho).
Fig. 2
Fig. 2. Myeloid Tshr deficiency enhances insulin sensitivity by improving the insulin signaling pathway in HFD-fed mice.
TshrMKO mice and age-matched Tshrf/f littermates (male, 6 weeks old) were fed with HFD for 9 weeks. They were then euthanized upon insulin administration (1.5 U/kg) for 5 min after 8-h fasting. ac Next, western blotting analysis was used to determine the levels of p-IRS1, IRS1, p-PDK1, PDK1, p-AKT, total AKT (t-AKT), GCK, PPARγ, p-GSK3β, GSK3β and PEPCK1 in liver tissues (a), the levels of p-IRS1, IRS1, p-PDK1, PDK1, p-AKT, t-AKT, GCK and PPARγ in eWAT (b) and the levels of p-IRS1, IRS1, p-PDK1, PDK1, p-AKT, t-AKT, GCK, p-GSK3β and GSK3β in skeletal muscle tissues (c). β-Actin was used as a loading control. d,e Representative H&E (d) and Oil Red O staining (e) of liver sections. Scale bars, 100 μm. f Representative immunofluorescence staining of GLUT4 (green) in eWAT and skeletal muscle sections. Nuclei were stained with DAPI (blue). Scale bars, 50 μm. g Western blotting analysis was used to determine the levels of p-JNK, p-p65 and p-STAT3 in liver, eWAT and skeletal muscle. β-Actin was used as a loading control.
Fig. 3
Fig. 3. Myeloid Tshr deficiency alleviates macrophage infiltration and M1 polarization in liver, adipose tissues and skeletal muscle of HFD-fed mice and improves insulin resistance.
Male TshrMKO mice and age-matched Tshrf/f littermates were fed with HFD for 9 weeks. Liver, eWAT and skeletal muscle were isolated from these mice. Flow cytometry was performed to analyze the effect of myeloid Tshr deficiency on macrophage infiltration and M1 polarization in liver, eWAT and skeletal muscle. a The percentage of CD11b+ F4/80+ macrophages from the CD45+ cell gate in liver, eWAT and skeletal muscle (n = 3). b The percentage of CD80+ macrophages from the CD11b+ F4/80+ cell gate in liver, eWAT and skeletal muscle (n = 3). The mRNA levels of Itgam, Adgre1 and Itgax in liver (c), eWAT (d) and skeletal muscle (e) were measured by qRT-PCR (n = 9). β-Actin was used as an internal control (n = 9). Primary hepatocytes, 3T3L1-differentiated adipocytes and L6-differentiated skeletal muscle cells were co-cultivated with Tshrf/f- or TshrMKO-derived BMDMs for 48 h and then stimulated with 100 nM insulin for 15 min. f Western blotting analysis was performed to determine the levels of p-IRS1, IRS1, p-AKT, t-AKT, p-p65, p65, p-JNK and JNK in primary hepatocytes, 3T3L1-differentiated adipocytes and L6-differentiated skeletal muscle cells. β-Actin was used as a loading control. g Relative PEPCK1 activity of primary hepatocytes with the indicated treatments (n = 3). h Relative glucose uptake of 3T3L1-differentiated adipocytes with the indicated treatments (n = 3). Data are presented as mean ± s.d. *P < 0.05, **P < 0.01, ***P < 0.001 (unpaired two-tailed Student’s t-test for a and b; one-way ANOVA for ce, g and h).
Fig. 4
Fig. 4. Myeloid Tshr deficiency suppresses M1 polarization of macrophages and the secretion of IL-1α, IL-1β and IL-6.
Tshrf/f- or TshrMKO-derived BMDMs were stimulated by 1 ng/mL TSH for 24 h, and flow cytometry was then performed to analyze the effects of myeloid Tshr deficiency on M1 polarization of macrophages and intracellular ROS levels. a CD80+ M1 macrophages from the CD11b+ F4/80+ cell gate (n = 3). b Intracellular ROS levels (left) and mean fluorescence intensity (MFI) of ROS (right) (n = 3). c A heatmap of the proinflammatory cytokines in Tshrf/f- or TshrMKO-derived BMDMs determined by mRNA sequencing. d The mRNA levels of the proinflammatory cytokines in the above BMDMs were measured by qRT-PCR. β-Actin was used as an internal control (n = 9). TshrMKO mice and age-matched Tshrf/f littermates (male, 6 weeks old) were fed with HFD for 9 weeks. Serum concentrations of IL-1α (e), IL-1β (f) and IL-6 (g) in these mice were then measured by ELISA (n = 6). h qRT-PCR assays were performed to determine mRNA levels of Il-1a, Il-1b and Il-6 in Tshrf/f- or TshrMKO-derived BMDMs stimulated by 1 ng/mL TSH for 24 h. β-Actin was used as an internal control (n = 3). Data are presented as mean ± s.d. **P < 0.01, ***P < 0.001 (unpaired two-tailed Student’s t-test for a, b and eg; one-way ANOVA for d and h).
Fig. 5
Fig. 5. Improvement of HFD-induced metabolic disorders in liver by myeloid Tshr deficiency.
TshrMKO mice and age-matched Tshrf/f littermates (male, 6 weeks old) were fed with HFD for 9 weeks. They were then euthanized upon insulin administration (1.5 U/kg) for 5 min after 8 h fasting. a GSEA of mRNA sequencing data in livers of HFD-fed Tshrf/f and TshrMKO mice (n = 3). b A heatmap of the oxidative phosphorylation members in livers determined by mRNA sequencing (n = 3). c GO analysis of differential genes from mRNA sequencing data in livers of HFD-fed Tshrf/f and TshrMKO mice (n = 3). d A Venn diagram showing overlap of 264 downregulated genes in livers of TshrMKO mice and 754 upregulated genes in inflammation-activated macrophages. The protein levels of EGR1, SOCS3, LCN2 and PTEN in liver (e), eWAT (f) and skeletal muscle (g) of HFD-fed TshrMKO and Tshrf/f mice were determined by western blotting analysis. β-Actin was used as a loading control (n = 3).
Fig. 6
Fig. 6. TSH-activated macrophages upregulate Egr1, Lcn2 and Socs3 and aggravate insulin resistance in hepatic, adipose and skeletal muscle cells via IL-1α, IL-1β and IL-6.
Primary hepatocytes, 3T3L1-differentiated adipocytes and L6-differentiated skeletal muscle cells were co-cultivated with wild-type BMDMs stimulated by 1 ng/mL TSH for 24 h and simultaneously treated by 10 ng/mL IL-1RA or IL-6ST for 48 h, followed by 100 nM insulin stimulation for 15 min. ac The levels of p-IRS1, IRS1, p-AKT, t-AKT, p-p65, p65, p-STAT3, STAT3, EGR1, LCN2, SOCS3 and PTEN in primary hepatocytes (a), 3T3L1-differentiated adipocytes (b) and L6-differentiated skeletal muscle cells (c) were then determined by western blotting analysis. β-Actin was used as a loading control. d The mRNA levels of Egr1, Lcn2, Socs3 and Pten were determined by qRT-PCR in primary hepatocytes with the indicated treatments. β-Actin was used as an internal control (n = 3). Data are presented as mean ± s.d. ***P < 0.001 (one-way ANOVA for d).
Fig. 7
Fig. 7. EGR1 aggravates insulin resistance by transcriptionally activating LCN2 and SOCS3.
EGR1-knockdown HepG2 cells and their control cells were treated with PBS or 10 ng/mL IL-1α for 48 h and then stimulated by 100 nM insulin for 15 min. a The levels of p-IRS1, IRS1, p-AKT, t-AKT, p-p65, p65, p-STAT3, STAT3, EGR1, LCN2, SOCS3 and PTEN were determined by western blotting analysis. b The mRNA levels of EGR1, LCN2, SOCS3 and PTEN in HepG2 cells with the indicated treatments (n = 3). c PGL3.0 plasmids inserted the promoter of LCN2 or SOCS3 were co-transfected with pRL-TK plasmid into EGR1-knockdown HepG2 cells or control cells, which were treated with 10 ng/mL IL-1α for 48 h. The promoter transcriptional activity of LCN2 and SOCS3 was determined by the dual-fluorescence reporter system (n = 3). d The protein levels of EGR1 and Flag in EGR1-overexpressing HepG2 cells or control cells. e PGL3.0 plasmids inserted the promoter of LCN2 or SOCS3 were co-transfected with pRL-TK plasmid into EGR1-overexpressing HepG2 cells or control cells. The promoter transcriptional activity of LCN2 and SOCS3 was determined by the dual-fluorescence reporter system. Luciferase activity was normalized to Renilla luciferase activity (n = 3). f A schematic model for TSH triggering macrophage inflammation to exacerbate insulin resistance in SH. Data are presented as mean ± s.d. *P < 0.05, **P < 0.01, ***P < 0.001; ns, not significant (one-way ANOVA for b, c and e).
Fig. 8
Fig. 8. Validation of TSH-triggered insulin resistance in patients with SH.
ae The levels of IL-1α (a), IL-1β (b), IL-6 (c), GHb (d) and FPG (e) in the serum from patients with SH and healthy controls (n = 20). fj Correlations of the levels of IL-1α (f), IL-1β (g), IL-6 (h), GHb (i) and FPG (j) with TSH levels in patients with SH (n = 20). PBMC-derived macrophages were treated with 50 ng/mL of human macrophage colony-stimulating factor (hM-CSF) for 7 days, accompanied by stimulation with the serum from patients with SH and healthy controls. Flow cytometry was then used to determine their effect on macrophage differentiation and M1 polarization. k The percentage of CD11b+CD68+ macrophages from the immune cell gate and CD80+ macrophages from the CD11b+ CD68+ cell gate (n = 6). Data are presented as mean ± s.d. *P < 0.05, **P < 0.01, ***P < 0.001 (unpaired two-tailed Student’s t-test for ae and k; Pearson linear correlation analysis for fj).

Similar articles

References

    1. Biondi, B., Cappola, A. R. & Cooper, D. S. Subclinical hypothyroidism: a review. JAMA322, 153–160 (2019). - PubMed
    1. Vanderpump, M. P. J. et al. The incidence of thyroid disorders in the community: a twenty-year follow-up of the Whickham Survey. Clin. Endocrinol.43, 55–68 (2008). - PubMed
    1. Canaris, G. J., Manowitz, N. R., Mayor, G. & Ridgway, E. C. The Colorado Thyroid Disease Prevalence Study. Arch. Intern. Med.160, 526–534 (2000). - PubMed
    1. Surks, M. I. et al. Subclinical thyroid disease. JAMA291, 228–238 (2004). - PubMed
    1. Cooper, D. S. & Biondi, B. Subclinical thyroid disease. Lancet379, 1142–1154 (2012). - PubMed

MeSH terms