. 2025 Jun 16;30(1):483.
doi: 10.1186/s40001-025-02768-0.

Exploring T-cell metabolism in tuberculosis: development of a diagnostic model using metabolic genes

Affiliations

Exploring T-cell metabolism in tuberculosis: development of a diagnostic model using metabolic genes

Shoupeng Ding et al. Eur J Med Res. .

Abstract

Objectives: The early diagnosis and immunoregulatory mechanisms of active tuberculosis (ATB) and latent tuberculosis infection (LTBI) remain unclear, and the role of metabolic genes in host-pathogen interactions requires further investigation.

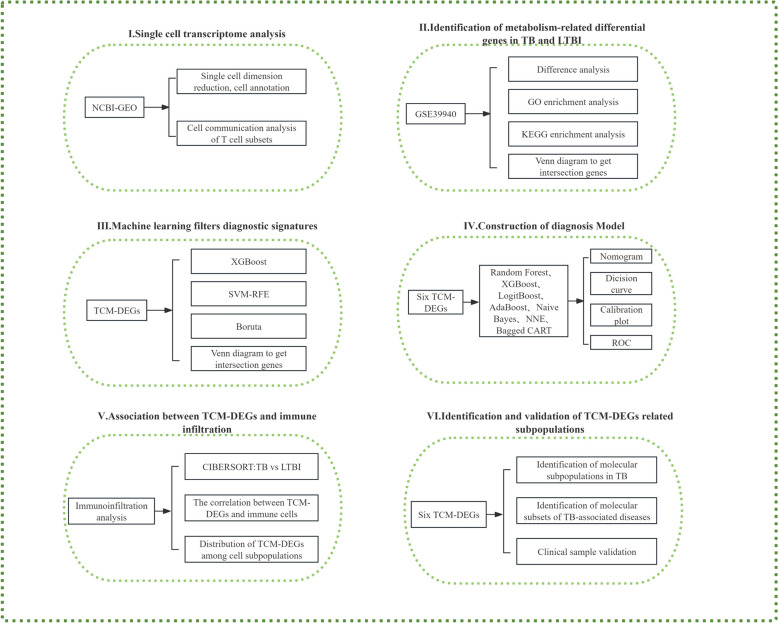
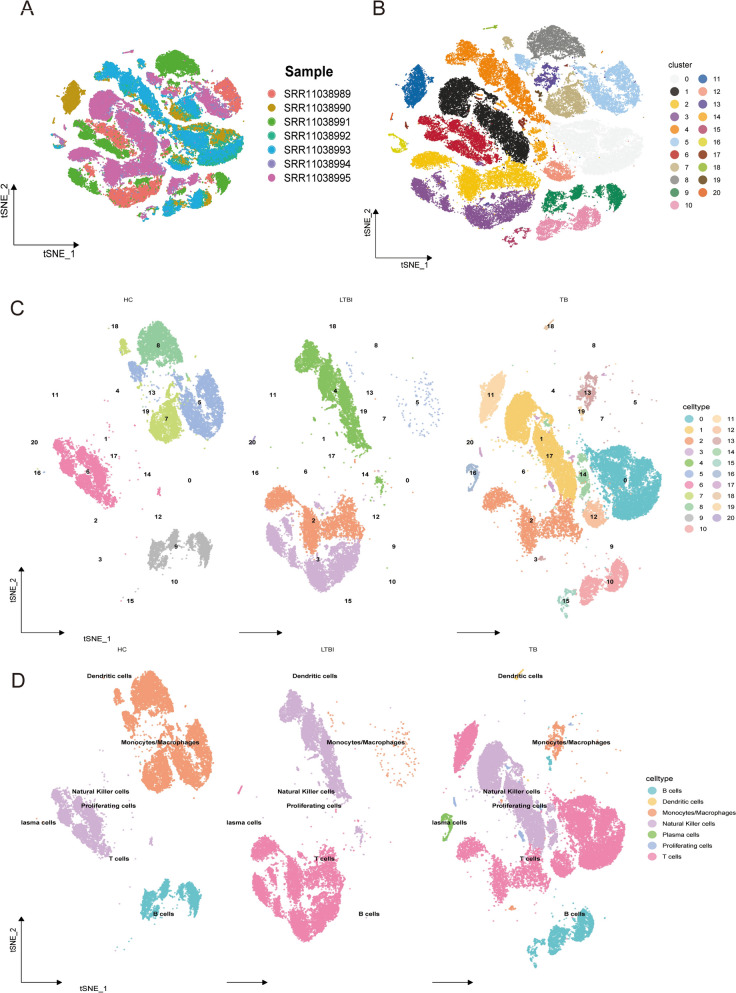
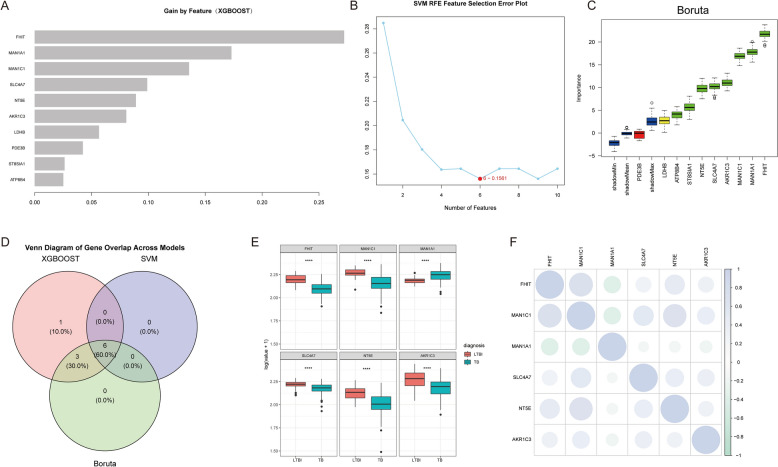
Methods: Single-cell RNA sequencing (scRNA-seq) was applied to analyze peripheral blood mononuclear cells (PBMCs) from 7 individuals, including 2 healthy controls (HC), 2 LTBI patients, and 3 ATB patients. We identified T-cell-associated metabolic differentially expressed genes (TCM-DEGs) through integrated differential expression analysis and machine learning algorithms (XGBoost, SVM-RFE, and Boruta). These TCM-DEGs were then used to construct a diagnostic model and evaluate its clinical applicability.

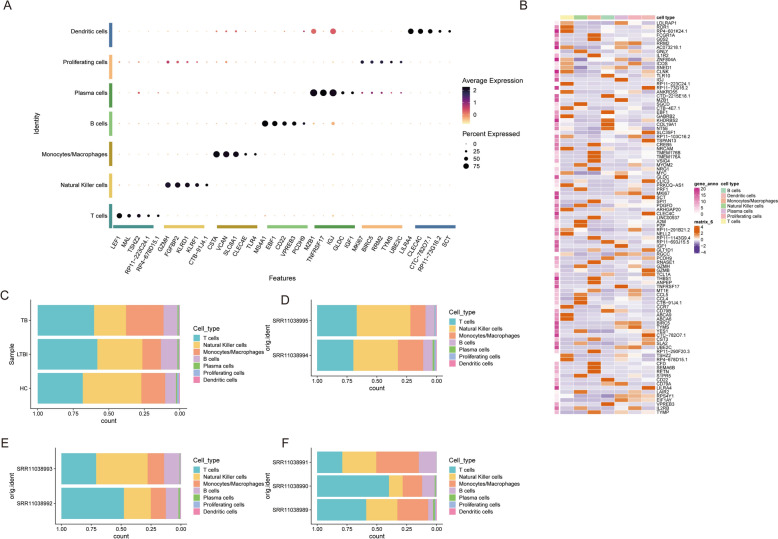
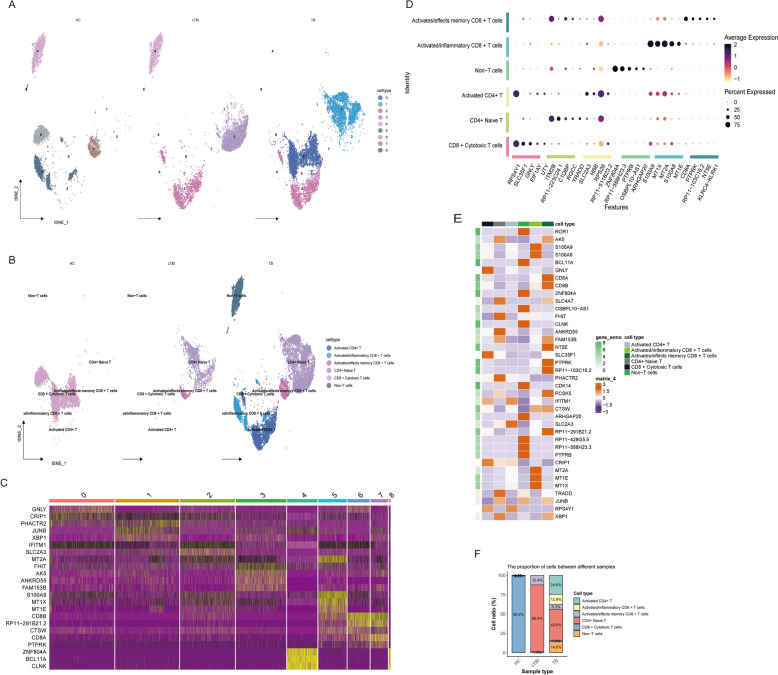
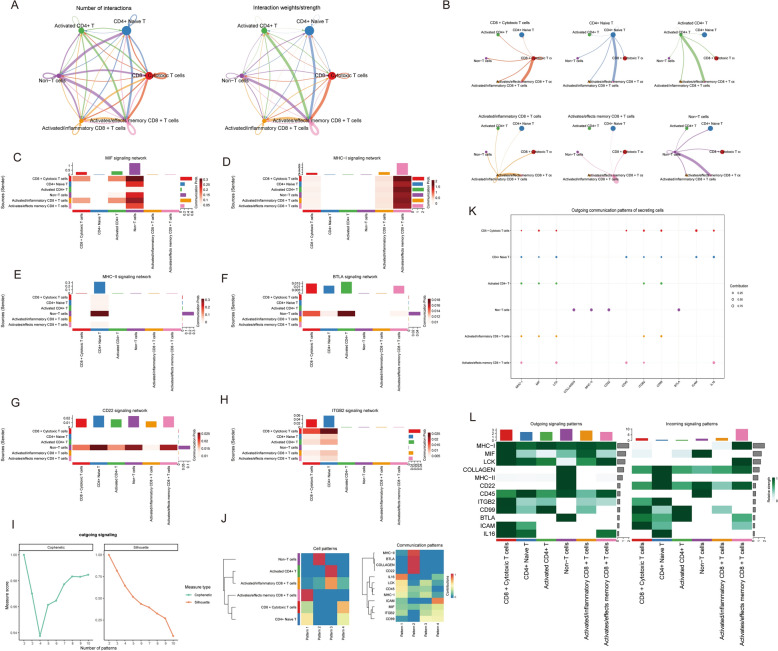
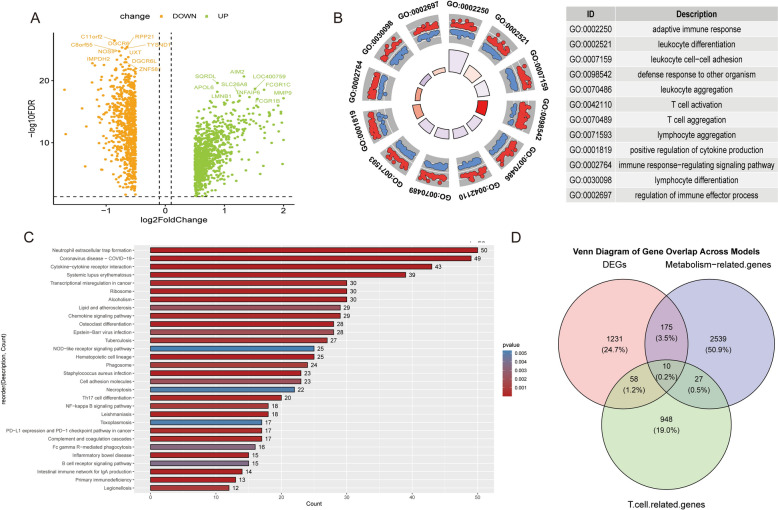
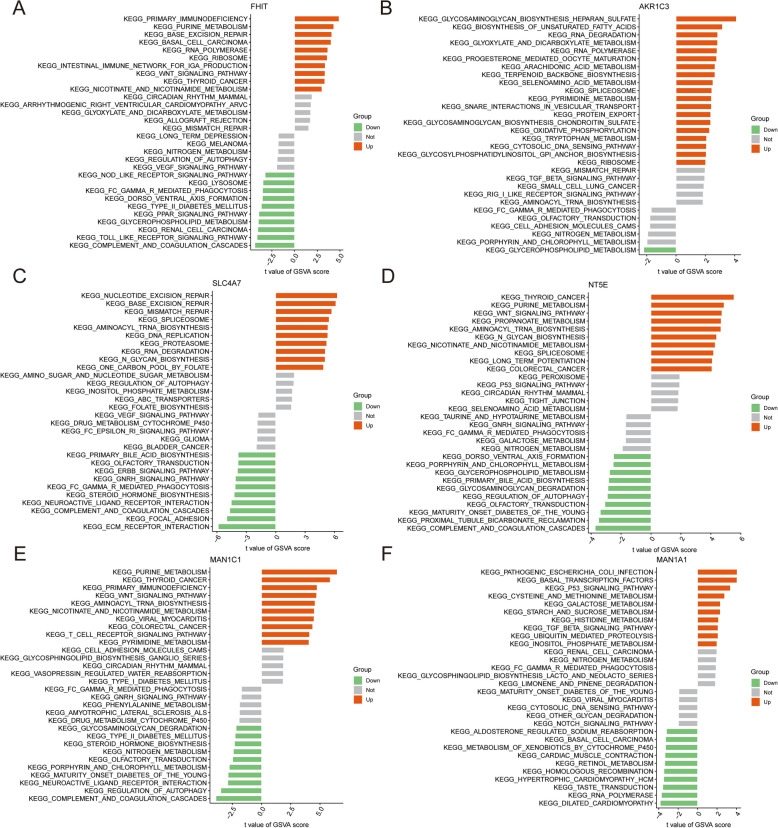
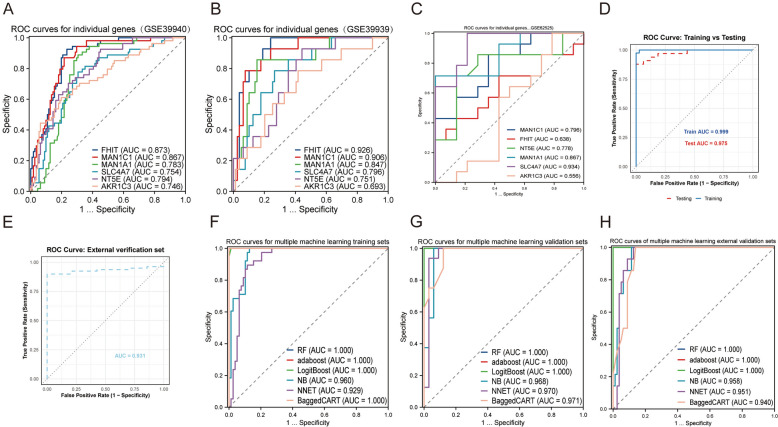
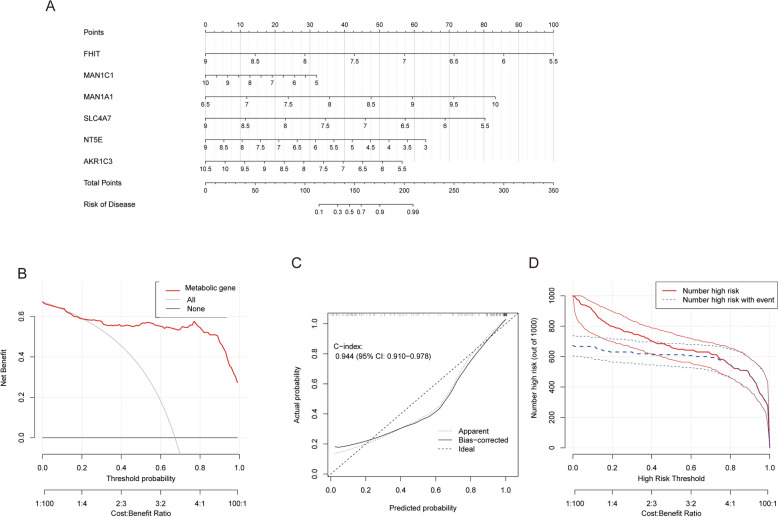
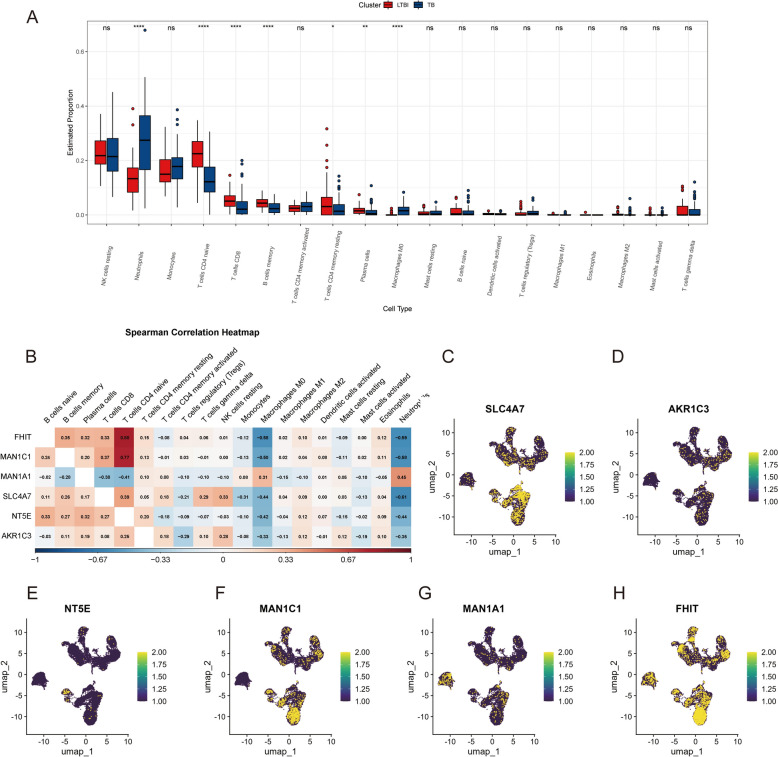
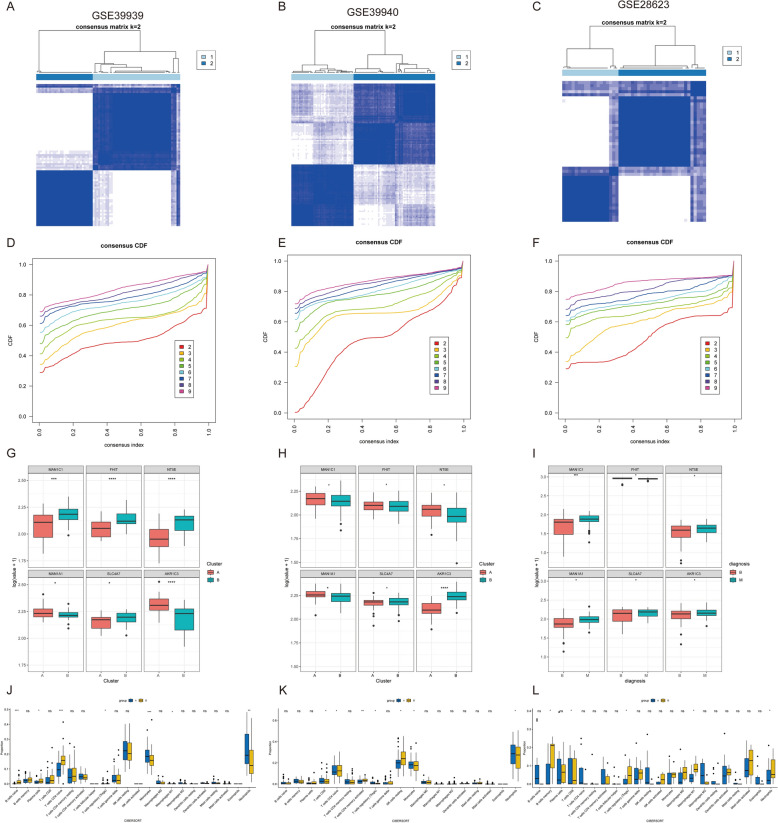
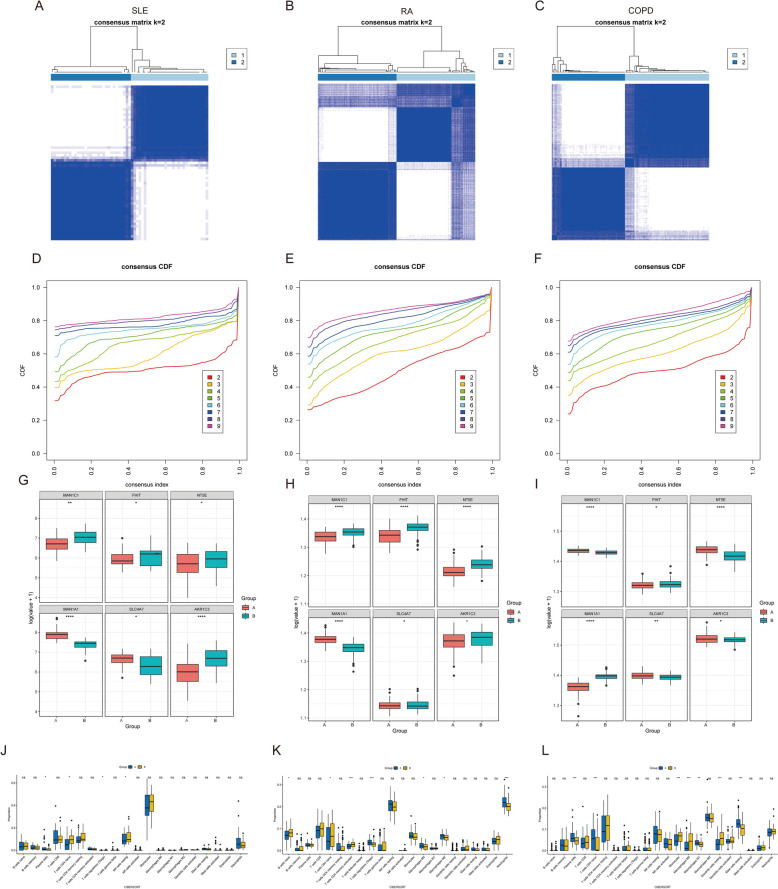
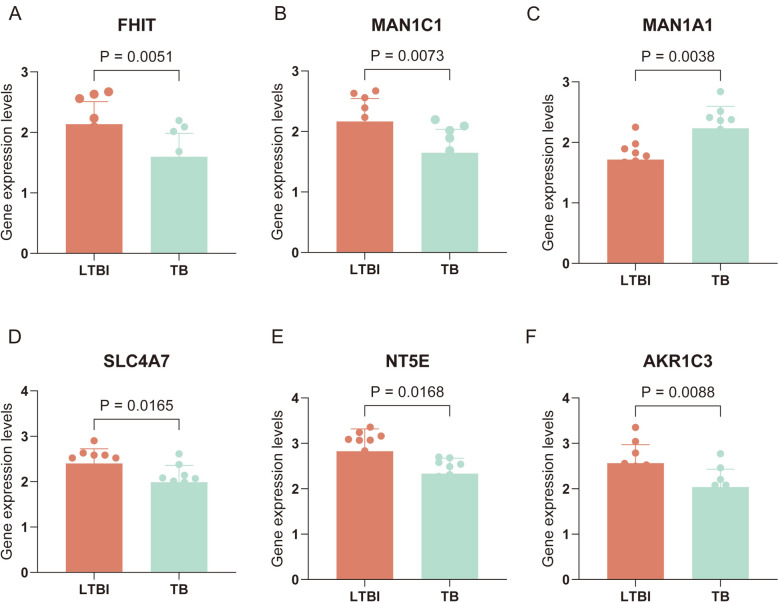
Results: The analysis revealed significant immunological alterations in TB patients, characterized by markedly elevated monocyte/macrophage populations (p < 0.001) accompanied by reduced T and NK cell counts. Notably, LTBI cases demonstrated an intermediate CD4+/CD8+ T-cell ratio, indicative of dynamic immune homeostasis. The TB cohort exhibited increased inflammatory T-cell populations, while CD8+ T-cell-mediated MHC-I and BTLA signaling pathways were identified as key regulators of immune clearance and modulation. Transcriptomic profiling identified five metabolically significant differentially expressed genes (FHIT, MAN1C1, SLC4C7, NT5E, AKR1C3; p < 0.05) that effectively distinguish between latent tuberculosis infection (LTBI) and active tuberculosis (TB). The machine learning-driven diagnostic framework demonstrated remarkable consistency across independent validation cohorts (GSE39940, GSE39939), exhibiting AUC values spanning 0.867-0.873. Molecular subtyping analysis delineated two distinct TB phenotypes: an immune-activated M1 macrophage-dominant subtype and a CD8 + T-cell infiltrated immunophenotype. Clinical validation substantiated the differential expression patterns of T-cell-related metabolic differentially expressed genes (TCM-DEGs; p < 0.05), while the nomogram predictive model achieved exceptional discriminative capacity (C-index = 0.944), demonstrating superior clinical applicability through decision curve analysis.

Conclusions: Our findings reveal that TCM-DEGs critically regulate TB progression through immune-metabolic reprogramming and cell-cell communication networks. The developed diagnostic model and molecular subtyping strategy enable precise TB-LTBI differentiation and inform immunotherapy optimization.

Keywords: Machine learning biomarkers; Metabolic gene signatures; Molecular subtypes; T-cell metabolism; Tuberculosis.


Conflict of interest statement

Declarations. Ethics approval and consent to participate: This study has been approved by the Ethics Committee of Siyang Hospital with the approval number HY2024005. Consent for publication: Not applicable. Competing interests: The authors declare no competing interests.

Figures

Fig. 1
Fig. 1
Experimental flow
Fig. 2
Fig. 2
Cell subpopulation annotation diagram. A t-SNE plot of samples, with each point representing a single cell. Cells are colored by their sample of origin (SRR11038989 to SRR11038995). B t-SNE plot showing the clustering of cells into 20 distinct clusters. Each cluster is represented by a different color. C t-SNE plots displaying cell distribution across different conditions: healthy controls (HC), latent tuberculosis infection (LTBI), and tuberculosis (TB), with colors representing different cell types. D t-SNE plots with annotated cell types, including dendritic cells, monocytes/macrophages, NK cells, plasma cells, proliferating cells, T cells, B cells, and isema cells, for each condition (HC, LTBI, and TB)
Fig. 3
Fig. 3
Characterization of cell subpopulations. A Dot plot showing key marker gene expression across different cell subpopulations. Cell types are listed on the y-axis, and features on the x-axis. Dot size indicates the percentage of cells expressing the feature, and color intensity reflects the average expression level. B Heatmap showing gene expression levels across cell types for selected genes, with rows representing genes and columns representing cell types. Red indicates high expression, and purple indicates low expression. C Bar plot depicting cell-type distribution across sample conditions: TB, LTBI, and HC. Bars represent the proportion of each cell type in each condition. D Bar plot of cell-type distribution in samples from SRR11038995 and SRR11038994 data sets, with color-coded bars representing relative cell-type proportions. E Bar plot showing cell-type distribution in SRR11038993, with bars representing relative cell-type proportions. F Bar plot showing cell-type distribution in SRR11038989, with bars representing relative cell-type proportions
Fig. 4
Fig. 4
Differentiation and expression profiling of T-cell subtypes in HC, LTBI, and TB samples. A t-SNE projection of all samples (HC, LTBI, TB) colored by identified T-cell subtypes. Each dot represents a single cell, colored by its assigned subtype. B Annotated t-SNE plot labeling specific T-cell subtypes, such as CD8 + naïve T cells, activated CD8 + T cells, and activated/inflammatory subsets across sample groups. C Heatmap showing gene expression profiles across T-cell subtypes. Each column represents a cluster/subtype, each row a gene. Color indicates expression intensity. D Dot plot of selected feature genes across major T-cell subtypes. Dot size represents the percentage of cells expressing the gene; color indicates average expression. E Heatmap highlighting differentially expressed genes between T-cell subtypes. F Bar plot showing the proportion of each T-cell subtype across the three sample groups: HC, LTBI, and TB
Fig. 5
Fig. 5
Cell–cell communication network analysis among T-cell subtypes. A Circle plots displaying the number (left) and strength (right) of interactions among T-cell subtypes. B Chord diagrams showing detailed outgoing communication from each T-cell subtype to others. C–H Heatmaps of signaling networks for individual pathways including MIF (C), MHC-I (D), MHC-II (E), BTLA (F), CCL22 (G), and ITGB2 (H). Rows are source cell types and columns are target cell types; color intensity reflects communication probability. I Line plots showing the number of outgoing signaling patterns against communication centrality (left: contribution; right: structural centrality). J Heatmaps illustrating clustering of outgoing signaling patterns (left) and communication pattern similarity between ligands/receptors and cell types (right). K Dot plot showing the outgoing communication patterns of each secreting T-cell subtype. L Heatmaps of outgoing (left) and incoming (right) signaling contributions for each T-cell subtype across various signaling pathways
Fig. 6
Fig. 6
Metabolic differences analysis. A Volcano plot showing differentially expressed genes (DEGs) between two conditions. B Circular plot of enriched Gene Ontology (GO) biological process terms among DEGs. C KEGG pathway enrichment bar chart. D Venn diagram showing overlap among different gene sets: DEGs (red), metabolism-related genes (blue), and T-cell-related genes (green). Overlapping areas represent genes shared by two or more sets, with counts and percentages annotated
Fig. 7
Fig. 7
Machine learning-based screening of differentially expressed genes. A Bar plot of feature importance from the XGBoost model. The x-axis shows gain values, representing the relative importance of each gene. B SVM–RFE (support vector machine–recursive feature elimination) error plot. The lowest point indicates the optimal number of features with minimal error (6 features). C Boxplot from the Boruta algorithm showing the importance scores of genes. Higher scores indicate greater importance in classification. D Venn diagram showing overlap of selected genes among the three models (XGBOOST, SVM, and Boruta). E Boxplots comparing expression levels (log-transformed) of top genes between LTBI (latent TB infection) and TB (active tuberculosis) groups. F Correlation matrix of selected genes. The size and color of each circle represent the strength and direction of correlation
Fig. 8
Fig. 8
GSVA enrichment analysis of hub genes. A–F GSVA-based KEGG pathway enrichment analysis for six key differential genes: FHIT (A), AKR1C3 (B), SLC4A7 (C), NT5E (D), MANT1C1 (E), and MAN1A1 (F). Each panel shows a bar plot of enriched KEGG pathways for high and low expression levels of the indicated gene. Pathways significantly enriched in the high-expression group are shown in orange, those enriched in the low-expression group in green, and non-significant pathways in gray. The x-axis represents the t value of the GSVA score
Fig. 9
Fig. 9
Construction of machine learning diagnostic models. A–C ROC curves of six key genes (FHIT, MAN1C1, MAN1A1, SLC4A7, NT5E, and AKR1C3) in three independent data sets: GSE39940 (A), GSE39939 (B), and GSE52525 (C). AUC values are listed for each gene. D ROC curve for the XGBoost model, comparing performance on the training set (AUC = 0.999) and testing set (AUC = 0.975). E ROC curve of the XGBoost model applied to an external validation set. F–H ROC curves for six machine learning algorithms on training sets (F), validation sets (G), and external validation sets (H)
Fig. 10
Fig. 10
Clinical prediction model based on TCM–DEGs. A Nomogram integrating six metabolism-related genes (FHIT, MAN1C1, MAN1A1, SLC4A7, NT5E, and AKR1C3) to predict individual disease risk. Each gene contributes a score, which sums to a total score that translates into a predicted probability of disease. B Decision curve analysis (DCA) evaluating the net clinical benefit of the metabolic gene model across different threshold probabilities. The red curve (metabolic gene) shows a higher net benefit than the"All"and"None"strategies. C Calibration plot of the predictive model. The dashed line represents apparent accuracy, the solid line is the bias-corrected performance, and the diagonal line represents ideal prediction. C-index = 0.944 (95% CI 0.910–0.978). D Clinical impact curve showing the number of high-risk individuals identified (red line) and the number of true positives (blue dashed line) at different high-risk thresholds
Fig. 11
Fig. 11
Association of metabolism-related key genes with immune cell subsets. A Boxplots comparing the proportions of immune cell subsets between latent tuberculosis infection (LTBI, red) and active tuberculosis (TB, blue) groups using CIBERSORTx deconvolution. Significant differences are indicated with asterisks (*p < 0.05; **p < 0.01; ***p < 0.001). B Spearman correlation heatmap between the expression levels of six metabolism-related genes (FHIT, MAN1C1, MAN1A1, SLC4A7, NT5E, and AKR1C3) and proportions of immune cell subsets. Positive correlations are shown in red, and negative correlations in blue. C–H UMAP visualization of single-cell transcriptomes showing expression distributions of the six key metabolism-related genes across immune cells, with expression levels indicated by color intensity
Fig. 12
Fig. 12
Identification of TCM–DEGs-related subpopulations in TB. A–C Consensus clustering heatmaps (k = 2) based on the expression profiles of metabolism-related genes across three independent GEO data sets: GSE39939 (A), GSE39940 (B), and GSE28623 (C). Blue blocks represent higher consensus within clusters. D–F Cumulative distribution function (CDF) plots showing the consensus index distributions for cluster numbers (k = 2–9) in GSE39939 (D), GSE39940 (E), and GSE28623 (F). Flatter CDF curves indicate more stable clustering. G–I Boxplots showing expression differences of the six key metabolism-related genes between identified clusters in GSE39939 (G), GSE39940 (H), and GSE28623 (I). J–L Immune cell infiltration analysis using CIBERSORTx algorithm for each data set: GSE39939 (J), GSE39940 (K), and GSE28623 (L). Boxplots show proportions of 22 immune cell types across clusters
Fig. 13
Fig. 13
Identification of TCM–DEGs-related subpopulations in other diseases. A–C Consensus clustering heatmaps for systemic lupus erythematosus (SLE, A), rheumatoid arthritis (RA, B), and chronic obstructive pulmonary disease (COPD, C) based on immune cell subsets. The consensus matrix (k = 2) indicates the degree of consistency within clusters. Dark blue represents high consistency, while white areas represent low consistency. D–F Cumulative distribution function (CDF) plots for the consensus index across various consensus numbers (k = 2–6) for SLE (D), RA (E), and COPD (F). G–I Boxplots showing the expression differences of key immune genes (MAN1C1, MAN1A1, SLC4A7, NT5E, and AKR1C3) between identified clusters in SLE (G), RA (H), and COPD (I). J–L Boxplots comparing the proportions of 22 immune cell types between clusters in SLE (J), RA (K), and COPD (L)
Fig. 14
Fig. 14
RT-qPCR validation of clinical samples. A–F Bar plots showing the expression levels of six key metabolism-related genes in patients with latent tuberculosis infection (LTBI) and active tuberculosis (TB). A FHIT expression was significantly decreased in TB compared to LTBI (p = 0.0051). B MAN1C1 expression was significantly lower in TB (p = 0.0073). C MAN1A1 expression was significantly increased in TB (p = 0.0038). D SLC4A7 expression was significantly reduced in TB (p = 0.0165). E NT5E expression was significantly lower in TB (p = 0.0168). F AKR1C3 expression was significantly decreased in TB (p = 0.0088). Bars represent mean ± SEM; significance was determined using unpaired t tests

Similar articles

References

    1. Trajman A, Campbell JR, Kunor T, et al. Tuberculosis. Lancet. 2025;405(10481):850–66. - PubMed
    1. Li Y, Deng Y, He J. Monocyte-related gene biomarkers for latent and active tuberculosis. Bioengineered. 2021;12(2):10799–811. - PMC - PubMed
    1. Krutikov M, Faust L, Nikolayevskyy V, et al. The diagnostic performance of novel skin-based in-vivo tests for tuberculosis infection compared with purified protein derivative tuberculin skin tests and blood-based in vitro interferon-gamma release assays: a systematic review and meta-analysis. Lancet Infect Dis. 2022;22(2):250–64. - PubMed
    1. Jonas DE, Riley SR, Lee LC, et al. Screening for latent tuberculosis infection in adults: updated evidence report and systematic review for the US Preventive Services Task Force. JAMA. 2023;329(17):1495–509. - PubMed
    1. Jaccard A, Wyss T, Maldonado-Pérez N, et al. Reductive carboxylation epigenetically instructs T cell differentiation. Nature. 2023;621(7980):849–56. - PubMed