. 2025 Jun 16;13(1):143.
doi: 10.1186/s40168-025-02130-w.

The impact of early-life exposures on growth and adult gut microbiome composition is dependent on genetic strain and parent- of- origin

Affiliations

The impact of early-life exposures on growth and adult gut microbiome composition is dependent on genetic strain and parent- of- origin

M Nazmul Huda et al. Microbiome. .

Abstract

Background: Early-life exposure to environmental factors can have long-lasting impacts on offspring health into adulthood and therefore is an emerging public health concern. In particular, the impact of maternal environmental exposures such as diet and antibiotic use on the establishment of the offspring gut microbiome has been recently highlighted as a potential link to disease risk. However, the long-term effects are poorly understood. Moreover, interindividual host genetic differences have also been implicated in modulating the gut microbiome, suggesting that these differences may modulate susceptibility to environmentally induced dysbiosis and exacerbate related health outcomes. Our understanding of how the developmental environment and genetics interact to modulate offspring long-term gut microbiota and health is still limited.

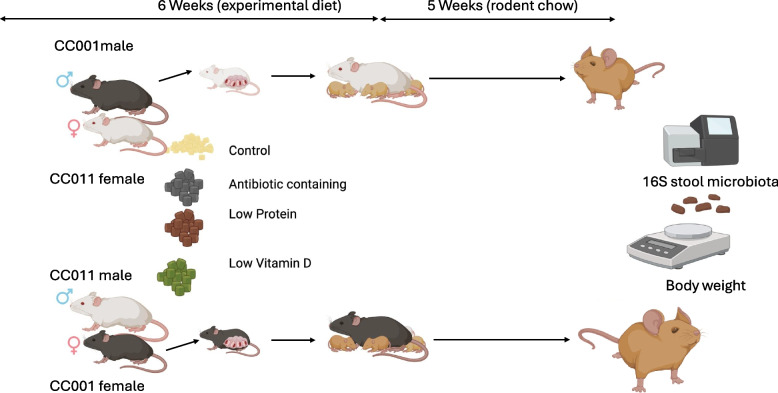
Methods: In this study, we investigated the effects of early exposure to known or putative dietary insults on the microbiome (antibiotic exposure, protein deficiency, and vitamin D deficiency) in a novel population of mice. Dams were maintained on purified AIN93G antibiotic-containing (AC), low-protein (LP), low-vitamin D (LVD), or mouse control (CON) diets from 5 weeks prior to pregnancy until the end of lactation. After weaning, mice were transferred to new cages and fed a standardized chow diet. The parent-of-origin (PO) effect was determined via F1 offspring from reciprocal crosses of recombinant inbred intercross (RIX) of Collaborative Cross (CC) mice, where all F1 offspring within a reciprocal pair were genetically identical except for the X- and Y-chromosomes and mitochondrial genomes. We assayed offspring bodyweight and the gut bacterial microbiota via 16S rRNA gene sequencing at 8 weeks of age.

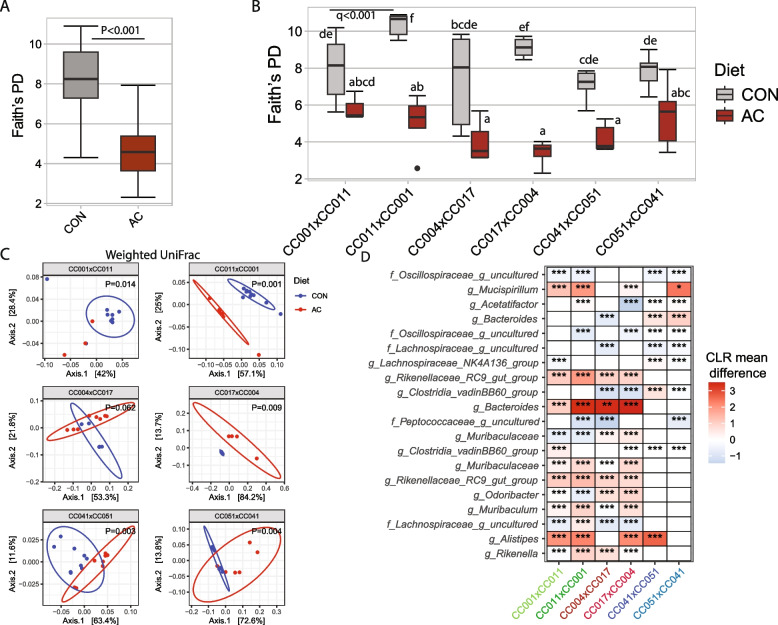
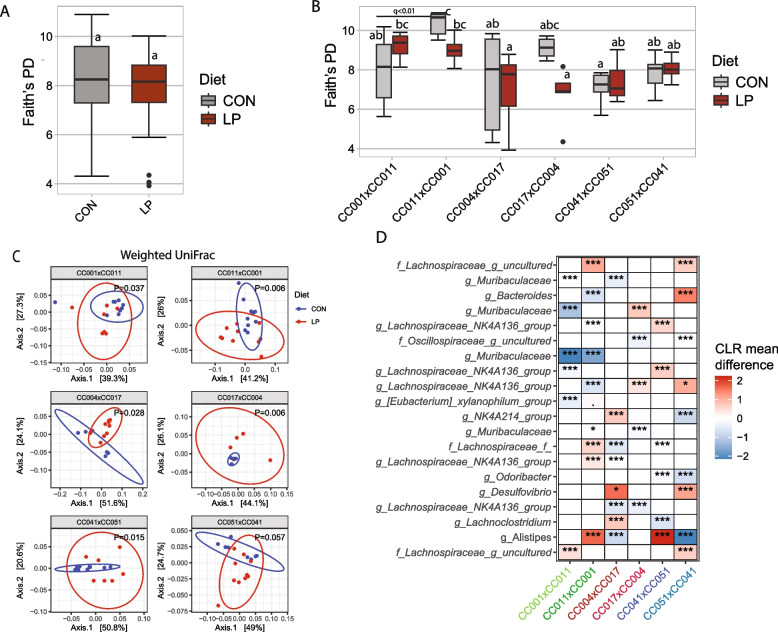
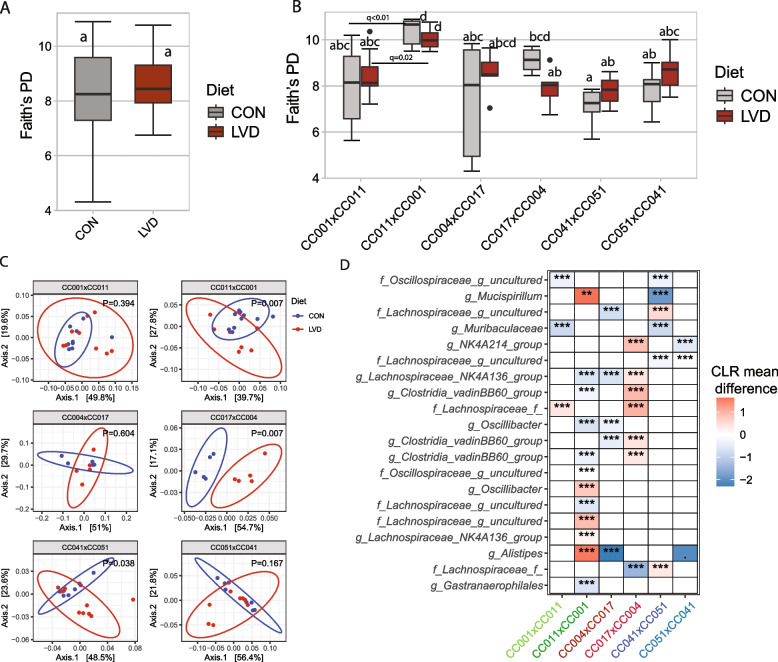
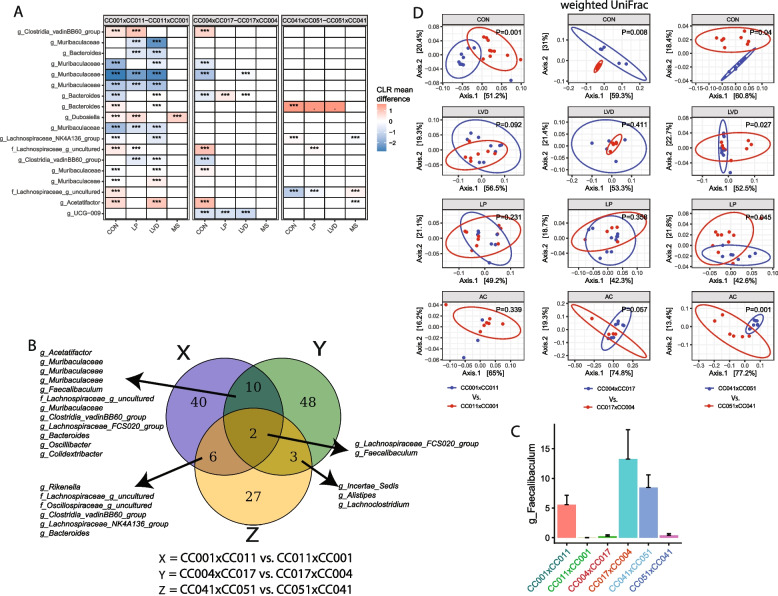
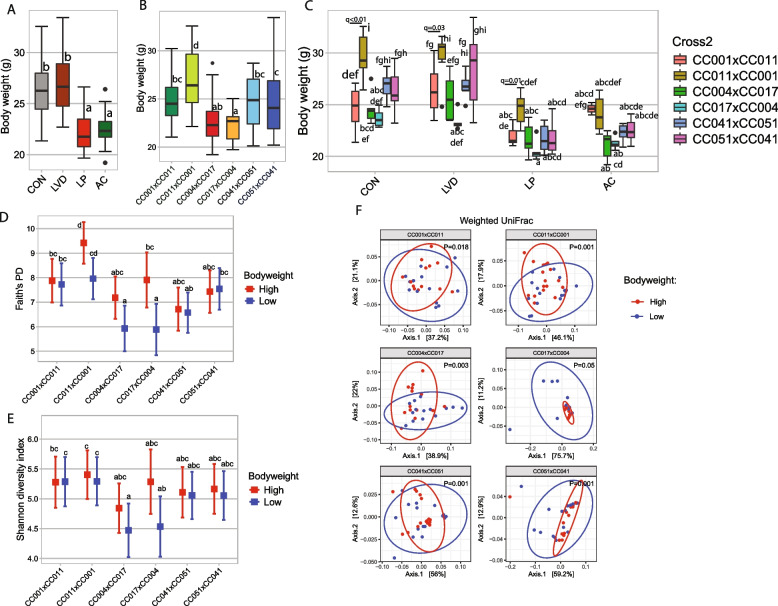
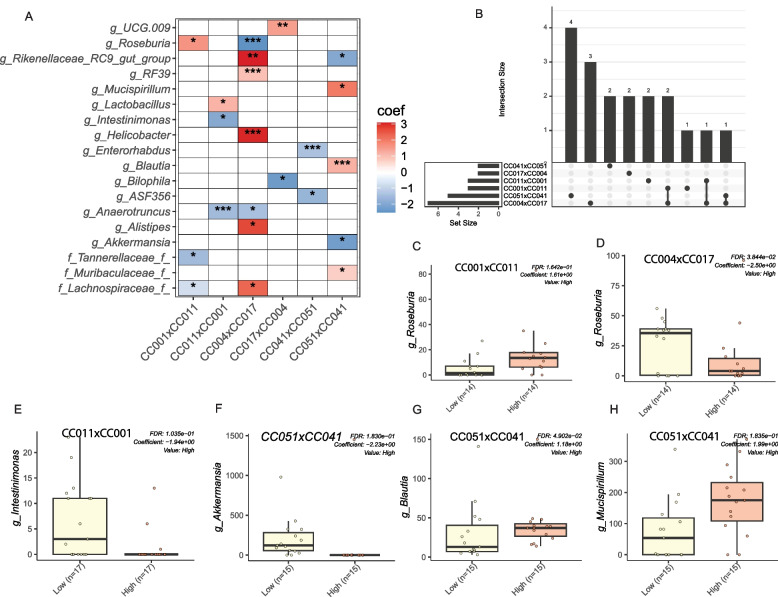
Results: Our study revealed that early developmental exposure to antibiotics, protein deficiency, and vitamin D deficiency had long-lasting effects on offspring bodyweight and gut microbial diversity and composition, depending on the genetic background. Several bacterial genera and ASVs, including Bacteroides, Muribaculaceae, Akkermansia, and Bifidobacterium, are influenced by developmental insults. We also observed a significant effect of PO on offspring gut microbiota and growth. For example, the offspring of CC011xCC001 mice had increased bodyweight, microbial diversity indices, and several differential bacterial abundances, including those of Faecalibaculum, compared with those of the corresponding reciprocal cross CC001xCC011.

Conclusion: Our results show that maternal exposure to nutritional deficiencies and antibiotics during gestation and lactation has a lasting impact on offspring gut microbiota composition. The specific responses to a diet or antibiotic can vary among F1 strains and may be driven by maternal genetics. Video Abstract.

Keywords: Antibiotics; Developmental environment; Genetics; Gut microbiota; Parent-of-origin.


Conflict of interest statement

Declarations. Ethics approval and consent to participate: Not applicable Consent for publication: Not applicable Competing interests: The authors declare no competing interests.

Figures

Fig. 1
Fig. 1
Study design. Inbred CC001, CC011, CC004, CC017, CC041, and CC051 male and female mice were obtained to generate male offspring (F1) by reciprocal crossbreeding. Mothers were placed on experimental diets (AC, LP, LVD, and control) 5 weeks before mating, throughout gestation, and until offspring weaning. F1 male offspring were weaned on postnatal day 21 and transferred to standard rodent chow. At 8 weeks of age, F1 mice were weighed and euthanized to collect cecum samples. The cecum was flash-frozen and stored at − 80 °C until analysis
Fig. 2
Fig. 2
Antibiotic exposure during development affects bodyweight and the gut microbiota at 8 weeks of age. A Faith’s phylogenetic diversity score of offspring gut microbiota at 8 weeks in AC and control groups. ANCOVA models were adjusted for the cross. B Comparisons of Faith’s PD between reciprocal crosses within each diet. The Wilcoxon test was used to compare each pair of reciprocal crosses. P-values were corrected for multiple comparisons using the Benjamini–Hochberg method. C Weighted UniFrac β-diversity principal coordinate plot of the offspring gut microbiota stratified by crosses. Colors represent maternal AC or CON diets as indicated. The ellipse indicates a 95% CI of the clusters by maternal diets. D Heatmap of differential ASV abundance in the gut microbiota of offspring whose mother maintained on the AC diet compared to the control group. The top 20 most differentially abundant (based on cumulative ANCOM W-value) ASVs were selected for the graph. On the Y-axis, maximum taxonomic information has been presented. Colors represent CLR mean differences (effect size) of the ASV abundance between AC and CON diets. Red indicates higher, and blue represents lower ASV abundance in the AC diet compared to the mouse control diet. White represents a nonsignificant result obtained from ANCOM analysis. ANCOM models were FDR (BH method) corrected, and a significant sub-hypothesis test at a level of adj.P < 0.05 was counted towards the W-value. “***” = ≥ W0.9, “**” = ≥ W0.8, “*” = ≥ W0.7, “.” = ≥ W0.6. The full list of the differential ASV abundance is available in Supplemental Table 6. Corresponding differential genera abundance has been depicted in Supplemental Table 7
Fig. 3
Fig. 3
Protein deficiency during the developmental period affects bodyweight and the gut microbiota at 8 weeks of age. A Faith’s phylogenetic diversity score of offspring gut microbiota at 8 weeks in LP and control groups. ANCOVA models were adjusted for the cross. B Comparisons of Faith’s PD between reciprocal crosses within each diet. The Wilcoxon test was used to compare each pair of reciprocal crosses. P-values were corrected for multiple comparisons using the Benjamini–Hochberg method. C Weighted UniFrac β-diversity principal coordinate plot of the offspring gut microbiota stratified by crosses. Colors represent different maternal LP or CON diets, as indicated. The ellipse indicates a 95% CI of the clusters by maternal diets. D Heatmap of differential ASV abundance in the gut microbiota of offspring mother maintained on an LP diet, compared to the control group. The top 20 most differentially abundant (based on cumulative ANCOM W-value) ASV were selected for the graph. On the Y-axis, maximum taxonomic information has been presented. Color represents CLR mean differences (effect size) of ASV abundance between LP and CON diets. Red indicates higher, and blue represents lower ASV abundance in the LP diet compared to the mouse control diet. White represents a nonsignificant result obtained from ANCOM analysis. ANCOM models were FDR (BH method) corrected, and a significant sub-hypothesis test at a level of adj.P < 0.05 was counted towards W-value. “***” = ≥ W0.9, “**” = ≥ W0.8, “*” = ≥ W0.7, “.” = ≥ W0.6. The full list of the differential ASV abundance is available in Supplemental Table 6. Corresponding differential genera abundance has been depicted in Supplemental Table 7
Fig. 4
Fig. 4
Vitamin D deficiency during the developmental period affects gut microbiota in adulthood but does not affect growth. A Faith’s phylogenetic diversity score of offspring gut microbiota at 8 weeks in LVD and control groups. ANCOVA models were adjusted for the cross. B Comparisons of Faith’s PD between reciprocal crosses within each diet. The Wilcoxon test was used to compare each pair of reciprocal crosses. P-values were corrected for multiple comparisons using the Benjamini–Hochberg method. C Weighted UniFrac β-diversity principal coordinate plot of the offspring gut microbiota stratified by crosses. Colors represent different maternal LVD or CON diets as indicated. The ellipse indicates a 95% CI of the clusters by maternal diets. D Heatmap of differential ASV abundance in the gut microbiota of offspring mother maintained on the LVD diet compared to the control group. The top 20 most differentially abundant (based on cumulative ANCOM W-value) ASV were selected for the graph. On the Y-axis, maximum taxonomic information has been presented. Colors represent CLR mean differences (effect size) of the ASC abundance between LVD and CON diets. Red indicates higher, and blue represents lower ASV abundance in the LVD group compared to the control. White represents a nonsignificant result obtained from ANCOM analysis. ANCOM models were FDR (BH method) corrected, and a significant sub-hypothesis test at a level of adj.P < 0.05 was counted towards W-value. “***” = ≥ W0.9, “**” = ≥ W0.8, “*” = ≥ W0.7, “.” = ≥ W0.6. The full list of the differential ASV abundance is available in Supplemental Table 6. Corresponding differential genera abundance has been depicted in Supplemental Table 7
Fig. 5
Fig. 5
Parent-of-origin is associated with offspring gut microbial β-diversity and composition at adulthood. A Heatmap of differential ASV abundance between reciprocal crosses as indicated. The top 20 most differentially abundant (based on cumulative ANCOM W-value) ASVs were selected for the graph. On the Y-axis, maximum taxonomic information has been presented. Colors represent CLR mean differences (effect size) of ASV abundance between corresponding reciprocal crosses (e.g., CC001xCC011 vs CC011xCC001). ANCOM models were FDR (BH method) corrected, and a significant sub-hypothesis test at a level of adj.P < 0.05 was counted towards the W-value. “***” = ≥ W0.9, “**” = ≥ W0.8, “*” = ≥ W0.7, “.” = ≥ W0.6. The full list of the differential ASV abundance is available in Supplemental Table 6. Corresponding differential genera abundance has been depicted in Supplemental Fig. 3, and the full list is available in Supplemental Table 7. B Venn diagram showing the common differential ASV abundance among offspring from the different combinations of reciprocal crosses as indicated. C Relative abundance of the differential ASV in the genus Faecalibaculum lineage among different reciprocal crosses. D Weighted UniFrac β-diversity principal coordinate plot of the offspring gut microbiota stratified by diets. The colors represent reciprocal cross pairs as indicated. The ellipse indicates the 95% CI of the clusters according to the reciprocal cross
Fig. 6
Fig. 6
Gut microbial diversity is associated with bodyweight across all reciprocal crosses. Distribution of bodyweight among A treatment groups, B crosses, and C reciprocal cross with each diet. Boxes without a common letter are significantly different from others. P-values were corrected for multiple comparisons using the Benjamini–Hochberg method, and adjusted P-values (q-values) were reported. Comparisons of D Faith’s PD α-diversity and E Shannon diversity index between high and low bodyweight for each cross. F Comparisons of weighted UniFrac β-diversity between high and low bodyweight in each cross
Fig. 7
Fig. 7
Specific gut bacteria are associated with bodyweight across all CC mouse crosses. A Heatmap showing the association between bacterial genus and bodyweight. The top 20 most influential (based on cumulative absolute coefficient value) genera were selected for the graph. On the Y-axis, maximum taxonomic information has been presented. The association was determined by MaAsLin-2. Bodyweight was categorized as high (above median) and low (below median) for each of the CC crosses. MAaslin-2 model was adjusted for diet. Red indicates a positive association between gut genera abundance and bodyweight, whereas blue indicates a negative association between gut genera abundance and bodyweight. B Upset plot to showcase the common gut genera found associated with bodyweight among different CC crosses. C, D, E, F, G, H indicating the abundance of Roseburia, Intestinimonas, Akkermansia, Blautia, and Mucispirillum in CC mice strains having high and low bodyweight as indicated

Similar articles

References

    1. Cox LM, et al. Altering the intestinal microbiota during a critical developmental window has lasting metabolic consequences. Cell. 2014;158(4):705–21. - PMC - PubMed
    1. Huda MN, et al. Bifidobacterium abundance in early infancy and vaccine response at 2 years of age. Pediatrics. 2018;143(2): e20181489. - PMC - PubMed
    1. Collado MC, et al. Human gut colonisation may be initiated in utero by distinct microbial communities in the placenta and amniotic fluid. Sci Rep. 2016;6(1): 23129. - PMC - PubMed
    1. Hinde K, Lewis ZT. Mother’s littlest helpers. Science. 2015;348(6242):1427–8. - PubMed
    1. Batool R, et al. Protein–energy malnutrition: a risk factor for various ailments. Crit Rev Food Sci Nutr. 2014;55(2):242–53. - PubMed

MeSH terms

LinkOut - more resources