. 2025 Jun 16;14(1):85.
doi: 10.1186/s40164-025-00672-1.

Multi-omics analyses of the heterogenous immune microenvironment in triple-negative breast cancer implicate UQCRFS1 potentiates tumor progression

Affiliations

Multi-omics analyses of the heterogenous immune microenvironment in triple-negative breast cancer implicate UQCRFS1 potentiates tumor progression

Yuhui Tang et al. Exp Hematol Oncol. .

Abstract

Background: Triple-negative breast cancer (TNBC) is commonly characterized by high-grade and aggressive features, resulting in an augmented likelihood of distant metastasis and inferior prognosis for patients. Tumor immune microenvironment (TME) has been recently considered to be tightly correlated with tumor progression and immunotherapy response. However, the actual heterogenous TME within TNBC remains more explorations.

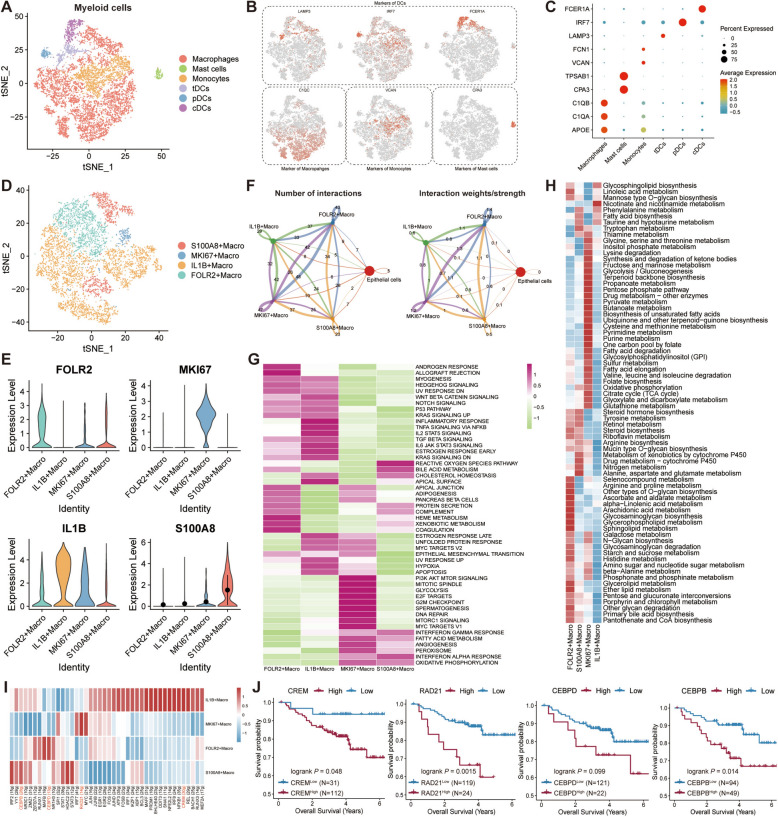
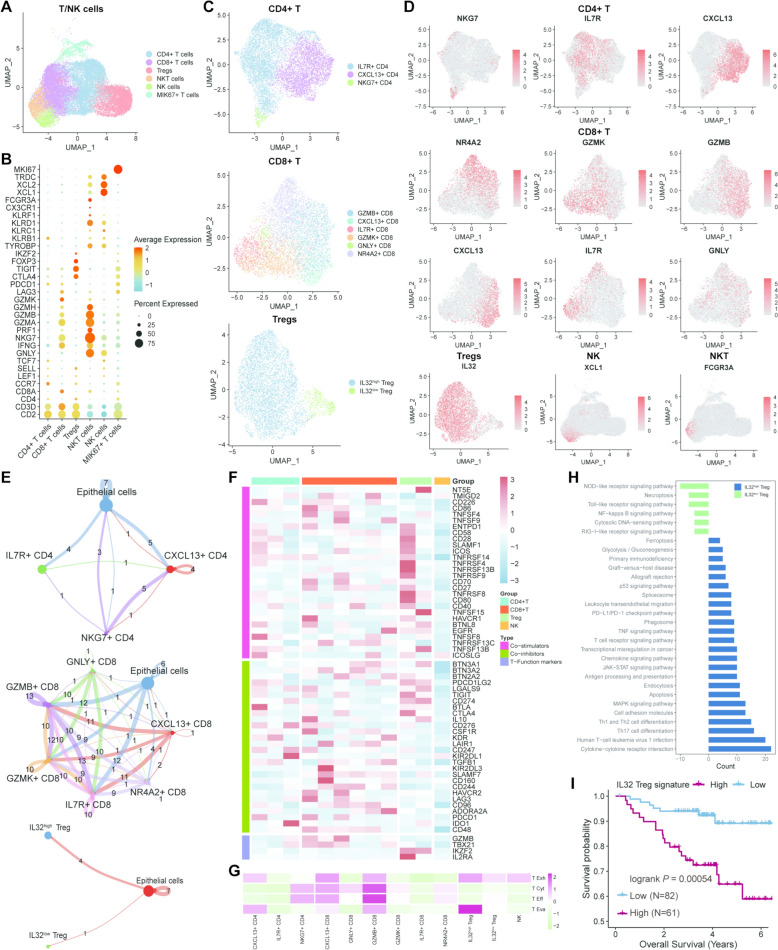
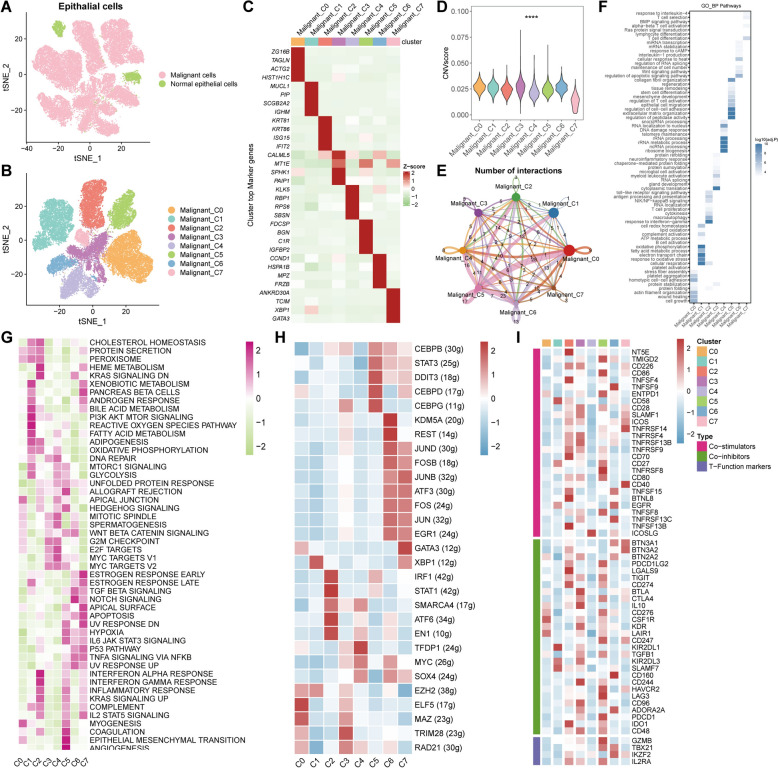
Methods: The thorough analyses of different cell types within TME were conducted on the self-tested single-cell RNA sequencing dataset which contained nine TNBC treatment-naïve patients, including subclusters classification, CellChat algorithm, transcription factors (TFs) expression, pseudotime analysis and functional enrichment assay. The malignant epithelial cluster was confirmed by copy number variations analysis, and subsequently LASSO-Cox regression was carried out to establish a Malignant Cell Index (MCI) model on the basis of five crucial genes (BGN, SDC1, IMPDH2, SPINT1, and UQCRFS1), which was validated in several TNBC cohorts through Kaplan-Meier survival and immunotherapy response analyses. The public spatial transcriptome, proteome data and qRT-PCR, western blotting experiments were exploited to corroborate UQCRFS1 expression in RNA and protein levels. Additionally, functional experiments were implemented to unravel the impacts of UQCRFS1 on TNBC cells.

Results: The diverse subclusters of TME cells within TNBC were clarified to display distinct characteristics in cell-cell interactions, TFs expression, differentiation trajectory and functional pathways. Particularly, IL32high Treg imparted an essential effect on tumor evasion and predicted a worsened prognosis of TNBC patients. Furthermore, MCI model enabled to notify the inferior prognosis and immunotherapy resistance in TNBC. Ultimately, UQCRFS1 knockdown dampened the proliferative and migratory competence in vitro as well as tumor growth in vivo of TNBC cells.

Conclusions: Our study offers innovative perspectives on comprehending the heterogeneity within TME of TNBC, thereby facilitating the elucidation of TNBC biology and providing clinical recommendations for TNBC patients' prognosis, such as IL32high Treg infiltration, MCI evaluation, and UQCRFS1 expression.

Keywords: IL32high Treg; Immunotherapy resistance; Multi-omics; Triple-negative breast cancer; Tumor immune microenvironment; UQCRFS1.


Conflict of interest statement

Declarations. Ethical approval and consent to participate: All procedures in this study concerning human participants were executed in accordance with the ethical standards of the National Research Committee and the 1964 Helsinki Declaration. And the study was approved by the Ethics Committee Board of Guangdong Provincial People's Hospital. All the animal experiments were conducted by approvement of The Animal Care and Use Committee of Guangdong Provincial People's Hospital. Consent for publication: All patients for scRNA-sequencing in this study have provided informed consent for the utilization of biopsy specimens. Competing interests: The authors declare no competing interests.

Figures

Fig. 1
Fig. 1
Overview of the study design and workflow based on the multi-omics analyses. A The biopsy tissues from nine treatment-naïve TNBC patients in Guangdong Provincial People’s Hospital (GDPH) were collected and subsequently dissociated for single-cell RNA sequencing (scRNA-sequencing). Additionally, the dissection of heterogenous tumor microenvironment (TME) was finalized by clustering, subclusters annotation, cell–cell chatting analysis, pseudotime analysis, TFs expression pattern and functional enrichment assays. B The malignant cell type was confirmed by CNV analysis and the Malignant Cell Index (MCI) was constructed by the expression of five key genes and was validated in four internal datasets using a series of algorithm analyses. Ultimately, the biological effect of UQCRFS1 was investigated through in vitro and in vivo experiments
Fig. 2
Fig. 2
Determination of the major cellular compositions of TME in the single-cell atlas of TNBC. A, B tSNE plots revealing the patient labels (A) and the major cell types (B). C The proportional representation of eight major cell types across nine patients. DF The top marker genes of every single major cell type in heatmap (D), tSNE plots (E), and bubble plot (F). G The cellular interactions among these major cell types in the quantitative (left) and intensity (right) levels. H The frequency of the top interaction genes of these major cell types in the outgoing (left) and incoming (right) signaling patterns
Fig. 3
Fig. 3
Clarification of myeloid cell subclusters in TNBC. A tSNE plot of the subclusters of myeloid cells. B, C The top marker genes of each subcluster of myeloid cells in tSNE plots (B) and bubble plot (C). D The detail subclusters of macrophages in tSNE plot. E The top marker genes of macrophage subclusters in violin plots. F The cellular interactions among macrophage subclusters in the quantitative (left) and intensity (right) levels. G The functional pathways enrichment analysis using HALLMARK gene sets in macrophage subclusters. H The metabolic pathway enrichment analysis through scMetabolism algorithm in macrophage subclusters. I TFs expression pattern of macrophage subclusters. J Survival analyses of the specific TF marking every single macrophage subcluster in GSE96058 dataset
Fig. 4
Fig. 4
Characterization of fibroblasts and B/plasma cells in TNBC. A tSNE plot unveiling the subgroups of fibroblasts. B The top marker genes of fibroblast subclusters in heatmap. C The cellular interactions among fibroblast subclusters in the quantitative (left) and intensity (right) levels. D, E The top genes expression related to differentiation process (D) and the differentiation trajectory plots (E) of fibroblast subclusters through pseudotime analysis. F Functional pathways enrichment analysis in fibroblast subclusters using KEGG dataset. G The expression patterns of the genes from extracellular matrix (ECM), matrix metalloproteinases (MMPs), TGF-β, Neo- angiogenesis (Neo-Anigio), contractile, RAS, and proinflammatory processes in fibroblast subclusters. H The subclusters of B/plasma cells in tSNE plot. I, J The top marker genes of B/plasma cell subclusters in tSNE plots (I) and bubble plot (J). K The differentiation trajectory plots of B/plasma cell subclusters by pseudotime algorithm. L The functional pathways enrichment analysis in B/plasma cell subclusters based on HALLMARK database. M TFs expression pattern of B/plasma cell subclusters. N tSNE plots unraveling the expression of XBP1 and STAT1 in B/plasma cells
Fig. 5
Fig. 5
Verification of the heterogenous T/NK cells in TNBC. A UMAP plot indicating the heterogeneity of T/NK cells. B The top marker genes of T/NK cell subclusters in bubble plot. C The reclustering results of CD4+ T (top), CD8+ T (middle), and Tregs (bottom) cells in UMAP plots. D The top marker genes of T/NK cell subclusters in UMAP plots. E The cellular interactions among the subclusters of CD4+ T (top), CD8+ T (middle), and Tregs (bottom) as well as epithelial cells in the quantitative levels. F The expression patterns of genes related to the co-stimulation, co-inhibition, and certain function of T cells in T/NK cell subclusters. G The functional scores correlated to T exhaustion, T cytotoxic process, T effector and T evasion of the detailed subclusters of T/NK cells. H The differentially functional pathways related to the immune regulation in IL32high and IL32low Tregs. I Survival analysis based on the score of IL32high-Tregs-related signature of TNBC patients in GSE96058
Fig. 6
Fig. 6
Discrimination of the normal and malignant epithelial cells in TNBC. A tSNE plot disclosing the normal and malignant cells in epithelial cells using “inferCNV” algorithm. B The reclustering result of malignant cells in tSNE plot. C The top marker genes of malignant cell subclusters in heatmap. D The CNV score of malignant cell subclusters. E The number of interactions among malignant cell subclusters. F, G The functional pathway enrichment of malignant cell subclusters using GO_BP (F) and HALLMARK (G) gene sets. H TFs expression pattern of malignant cell subclusters. I The expression patterns of genes related to the co-stimulation, co-inhibition, and certain function of T cells in malignant cell subclusters
Fig. 7
Fig. 7
Construction and validation of Malignant Cell Index (MCI) model in TNBC patients. A Venn diagram depicting the clinically significant genes promoted in the malignant cells of scRNA-sequencing after performing univariate Cox regression in GSE58812 and TCGA-TNBC cohorts. B The interaction network of 28 overlapping genes. C The result of Lasso Cox regression analysis using these 28 genes in GSE58812 (left) and the partial likelihood deviance for the Lasso regression (right). D PCA analysis based on the MCI value of TNBC patients in the training and validation cohorts. E The adjusted MCI value (top) and the dead/alive status (bottom) of TNBC patients in the training and validation cohorts. F Heatmaps illustrating the expression patterns of MCI-included genes (BGN, SDC1, IMPDH2, SPINT1, and UQCRFS1) in MCIhigh and MCIlow groups. G Survival analyses based on the comparison between patients with MCIhigh and MCIlow values
Fig. 8
Fig. 8
Establishment of a clinical nomogram including MCI and the significance of MCI in predicting immunotherapy resistance. A, B The results of univariate Cox (A) and multivariate Cox (B) regression utilizing age, tumor size, positive nodes and MCI of TNBC patients in GSE58812. C Construction of a prognostic nomogram consisting of MCI to predict 2-, 3-, and 5-year OS in TNBC patients. D Calibration curve to evaluate the congruity between the projected and observed rates of survival. E Decision curve analysis (DCA) to assess the clinical decision-making benefits of the nomogram. F Survival analysis based on the patients with high- and low- nomogram score. G The comparison of MCI of patients between nCR and pCR groups in GSE173839. H The proportion of patients with nCR or pCR status in MCIhigh and MCIlow groups. I ROC analysis to evaluate the accuracy of MCI applied in immunotherapy response prediction. JL UMAP plots displaying the major cell types (J), nCR/pCR status (K), and MCI values (L) of seven TNBC patients undergoing neoadjuvant ICB therapy in GDPH cohort. M, N The MCI values of total cell types (M) and the different major cell types (N) between nCR and pCR groups of GDPH cohort. * means p < 0.05, ** means p < 0.01, *** means p < 0.001, **** means p < 0.0001
Fig. 9
Fig. 9
UQCRFS1 is significantly enhanced in TNBC samples and potentiates tumor progression. A The expression level of UQCRFS1 in the paired non-tumoral and TNBC samples of GSE76250 dataset. B qRT-PCR analysis validating the mRNA expression of UQCRFS1 in MCF-10A and TNBC cell lines. C The protein expression of UQCRFS1 in the normal and TNBC samples of FUSCC proteome dataset. D Western blotting analysis validating the protein level of UQCRFS1 in MCF-10A and TNBC cell lines. E The classification of different spatial areas (left) and the expression of UQCRFS1 (right) in spatial transcriptome of a TNBC patient. F The statistical level of UQCRFS1 expression in (E). G Validation of two siRNAs targeting UQCRFS1 in MDA-MB-231 and BT549 cells. H The result of CCK-8 assays under the situation of UQCRFS1 knockdown. I, J The representative pictures of transwell (I) and colony formation (J) assays. K The statistical results of transwell (left) and colony formation (right) assays. L Validation of the shRNA targeting UQCRFS1 in TNBC cells. M The representative images of xenograft tumor morphology using MDA-MB-231 (top) and BT549 (bottom) cells. N The representative images of optical luciferase imaging assays in vivo. O, P The quantitative data of tumor weights (O) and tumor growth curves (P) of xenograft tumors. Error bars represent mean ± SD. * means p < 0.05, ** means p < 0.01, *** means p < 0.001, **** means p < 0.0001

Similar articles

Cited by

References

    1. Sung H, Ferlay J, Siegel RL, Laversanne M, Soerjomataram I, Jemal A, et al. Global cancer statistics 2020: GLOBOCAN estimates of incidence and mortality worldwide for 36 cancers in 185 countries. CA Cancer J Clin. 2021;71(3):209–49. - PubMed
    1. Bianchini G, De Angelis C, Licata L, Gianni L. Treatment landscape of triple-negative breast cancer—expanded options, evolving needs. Nat Rev Clin Oncol. 2022;19(2):91–113. - PubMed
    1. Bareche Y, Venet D, Ignatiadis M, Aftimos P, Piccart M, Rothe F, et al. Unravelling triple-negative breast cancer molecular heterogeneity using an integrative multiomic analysis. Ann Oncol. 2018;29(4):895–902. - PMC - PubMed
    1. Yang F, Xiao Y, Ding JH, Jin X, Ma D, Li DQ, et al. Ferroptosis heterogeneity in triple-negative breast cancer reveals an innovative immunotherapy combination strategy. Cell Metab. 2023;35(1):84-100 e8. - PubMed
    1. Karaayvaz M, Cristea S, Gillespie SM, Patel AP, Mylvaganam R, Luo CC, et al. Unravelling subclonal heterogeneity and aggressive disease states in TNBC through single-cell RNA-seq. Nat Commun. 2018;9(1):3588. - PMC - PubMed

LinkOut - more resources