. 2025 Jun 16;20(1):71.
doi: 10.1186/s13024-025-00860-x.

Interrogating the plasma proteome of repetitive head impact exposure and chronic traumatic encephalopathy

Affiliations

Interrogating the plasma proteome of repetitive head impact exposure and chronic traumatic encephalopathy

Rowan Saloner et al. Mol Neurodegener. .

Abstract

Background: Exposure to repetitive head impacts (RHI) is associated with increased risk for chronic traumatic encephalopathy (CTE), a neurodegenerative tauopathy, and other neuropathological changes. Biological drivers of RHI-related neurodegeneration are not well understood. We interrogated the plasma proteome in aging adults with prior RHI compared to healthy controls (CTL) and individuals with Alzheimer's disease (AD), including a subset characterized neuropathologically at autopsy.

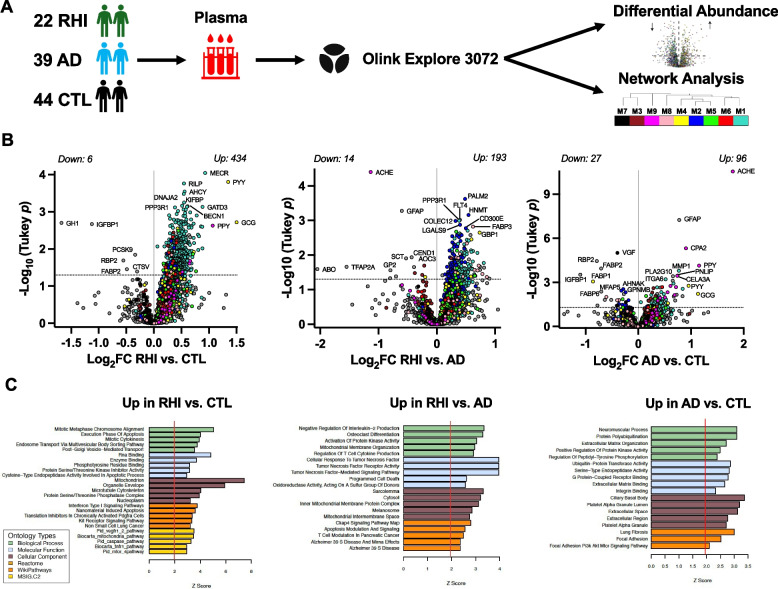
Methods: Proximity extension assay (Olink Explore®) quantified 2,779 plasma proteins in 22 RHI patients (all AD-biomarker negative), 39 biomarker-confirmed AD, and 44 CTL. A subset of participants went to autopsy (N = 16) allowing for comparisons of the antemortem plasma proteome between autopsy-confirmed CTE + (N = 7) and CTE- (N = 9). Differential abundance and co-expression network analyses identified plasma proteomic signatures of RHI, which were functionally annotated using gene ontology and cell type enrichment analysis. Nonparametric correlations examined plasma proteomic associations with orthogonally-measured plasma biomarkers, global cognitive function, and semi-quantitative ratings of neuropathology burden at autopsy.

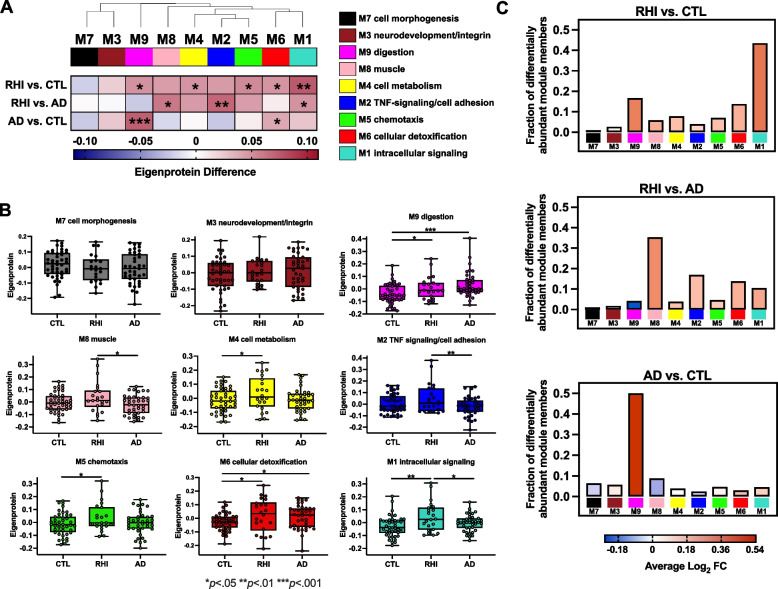
Results: Differential abundance analysis revealed 434 increased (vs. 6 decreased) proteins in RHI vs. CTL and 193 increased (vs. 14 decreased) in RHI vs. AD. Network analysis identified 9 protein co-expression modules (M1-M9), of which 7 were elevated in RHI compared to AD or CTL. Modules with increased abundance in RHI were enriched for mitochondrial/metabolic, cell division, and immunovascular (e.g., cell adhesion, TNF-signaling) processes. RHI-related modules exhibited strong and selective correlations with immunoassay-based plasma IL-6 in RHI cases, including the M2 TNF-signaling/cell adhesion module which harbored proteins that strongly tracked with cognitive function. RHI-related plasma protein signatures were similar in the subset of participants with autopsy-confirmed CTE, including immune and metabolic modules that positively correlated with medial temporal lobe tau and TDP-43 burden.

Conclusions: Molecular pathways in plasma most consistently implicated in RHI were tied to immune response, mitochondrial function, and cell metabolism. RHI-related proteomic signatures tracked with antemortem cognitive severity and postmortem neuropathological burden, providing converging evidence for their role in disease progression. Differentially abundant proteins and co-expression modules in RHI may inform mechanisms linking RHI to increased dementia risk, thus guiding diagnostic biomarker and therapeutic development for at-risk populations.

Keywords: Alzheimer’s disease; Biomarker; Chronic traumatic encephalopathy; Inflammation; Mixed neuropathology; Plasma proteomics; Repetitive head impacts; Traumatic brain injury; Traumatic encephalopathy syndrome.


Conflict of interest statement

Declarations. Ethics approval and consent to participate: All data were collected following study procedures that were reviewed and approved by the UCSF institutional review board (IRB-01) and participants provided informed consent prior to participation. Consent for publication: Not Applicable. Competing interests: The authors declare no competing interests.

Figures

Fig. 1
Fig. 1
Study design and differential plasma protein abundance across RHI, AD, and control (CTL). Legend: A) Plasma was collected in a clinical cohort of 22 AD-biomarker negative patients with substantial prior repetitive head injury (RHI), 39 AD-biomarker positive patients with cognitive impairment, and 44 AD-biomarker negative controls (CTL). Plasma proteomics was performed on the Olink Explore proximity-extension assay. After data processing, a total of 2,779 proteins were examined in downstream differential abundance and weighted gene co-expression network analysis (WGCNA). B Differential abundance analyses examined individual plasma protein differences across RHI, AD, and CTL. Pairwise differential protein abundance is represented by volcano plots of average log2 difference by negative log10 p-value for each given comparison. Proteins are colored by the network module in which they were assigned to. Pairwise comparisons were performed using one-way ANOVA with Tukey post-hoc test. The horizontal dotted line represents Tukey p < 0.05. C Gene ontology (GO) analysis was performed on proteins exhibiting increased abundance in RHI vs. CTL, RHI vs. AD, and AD vs. CTL. Biological enrichment is shown by z score, transformed from a Fisher’s exact test
Fig. 2
Fig. 2
Plasma protein co-expression network across RHI, AD, and CTL. Legend: A) A plasma protein co-expression network was built using weighted gene correlational network analysis (WGCNA). The plasma network consisted of 9 protein co-expression modules. Module relatedness is shown in the dendrogram above the heatmap. GO analysis was used to identify the principal biology represented by each module. Increased eigenprotein abundance for each comparison is indicated in red, whereas decreased eigenprotein abundance is indicated in blue. ***p <.001, **p <.01, *p <.05. B Module eigenprotein levels by case status across the 9 plasma network modules. Box plots represent the median and 25th and 75th percentiles, and box hinges represent the interquartile range of the two middle quartiles within a group. Min and max data points define the extent of whiskers (error bars). ***p <.001, **p <.01, *p <.05. C Bar heights represent the fraction of module member proteins that exhibited differential abundance. Bars are color coded by the average log2 fold-change (FC) of module member proteins
Fig. 3
Fig. 3
Olink-based plasma module associations with orthogonally-measured IL-6, GFAP, and NFL. Legend: A) Correlation of IL-6, GFAP, and NFL measured by immunoassay (x-axis) to Olink-based IL-6, GFAP, and NFL (y-axis). MSD = Meso Scale Discovery. B Heatmap of plasma module eigenprotein correlations (Spearman’s rho) with immunoassay-based IL-6, GFAP, and NFL, stratified by study group. ***p <.001, **p <.01, *p <.05. C Scatterplot of select module eigenprotein correlations with IL-6 across RHI, AD, and CTL
Fig. 4
Fig. 4
Plasma proteome associations with pathology-confirmed chronic traumatic encephalopathy (CTE) and neuropathological burden. Legend: A Heatmap of plasma module eigenprotein differences between CTE+ and CTE- cases. Asterisks denote statistically significant differences. B Differential abundance of plasma proteins between CTE+ and CTE-. Differential protein abundance is represented by a volcano plot of average log2 difference by negative log10 p-value. Proteins are colored by the module in which they were assigned to. The horizontal dotted line represents p < 0.05. C GO analysis was performed on proteins exhibiting increased abundance in CTE+ vs. CTE-. Biological enrichment is shown by z score, transformed from a Fisher’s exact test. D Eigenprotein levels by CTE + and CTE- for the 4 plasma network modules with significant differences. Data points are symbol coded based on comorbid AD neuropathology. E Scatterplot of select module eigenprotein correlations (biweight midcorrelations [bicor]) with semi-quantitative ratings of neurodegeneration (ND), tau, and TDP-43. Data points are color and symbol coded based on CTE status with and without comorbid AD neuropathology
Fig. 5
Fig. 5
Plasma proteome associations with global cognition in RHI cases. Legend: A Differential correlations (Spearman’s rho) of plasma proteins with global cognitive z-scores in RHI cases. Differential correlation is represented by a volcano plot of Spearman’s rho correlations by negative log10 p-value. Proteins are colored by the module in which they were assigned to. The horizontal dotted line represents p < 0.05. B Bar heights represent the fraction of module member proteins that exhibited significant correlation with global cognition. Bars are color coded by the average correlation coefficient of module member proteins. C Heatmap of plasma module eigenprotein correlations with global cognition in RHI cases. **p <.01, *p <.05. D Scatterplot of statistically significant module eigenprotein correlations with global cognitive z-scores (M2 TNF-signaling/cell adhesion and M3 neurodevelopment/integrin). E For proteins assigned to M2 TNF-signaling/cell adhesion, an individual protein’s strength of connectivity to M2 (x-axis) is plotted against the individual protein’s correlation with global cognitive z-score (y-axis). Proteins that exhibited stronger intramodular connectivity tended to exhibit stronger relationships with global cognition. Annotated proteins are M2 members that were significantly negatively correlated with global cognition and exhibited increased abundance in RHI vs. CTL and/or CTE+ vs. CTE- comparisons

References

    1. Brett BL, Gardner RC, Godbout J, Dams-O’Connor K, Keene CD. Traumatic brain injury and risk of neurodegenerative disorder. Biol Psychiatry. 2022;91(5):498–507. - PMC - PubMed
    1. Taghdiri F, Khodadadi M, Sadia N, Mushtaque A, Scott OFT, Hirsch-Reinhagen V, et al. Unusual combinations of neurodegenerative pathologies with chronic traumatic encephalopathy (CTE) complicates clinical prediction of CTE. Eur J Neurol. 2024;31:e16259. - PMC - PubMed
    1. Asken BM, Tanner JA, VandeVrede L, Casaletto KB, Staffaroni AM, Mundada N, et al. Multi-modal biomarkers of repetitive head impacts and traumatic encephalopathy syndrome: a clinicopathological case series. J Neurotrauma. 2022;39(17–18):1195–213. - PMC - PubMed
    1. Bieniek KF, Cairns NJ, Crary JF, Dickson DW, Folkerth RD, Keene CD, et al. The Second NINDS/NIBIB Consensus meeting to define neuropathological criteria for the diagnosis of chronic traumatic encephalopathy. J Neuropathol Exp Neurol. 2021;80(3):210–9. - PMC - PubMed
    1. Bieniek KF, Blessing MM, Heckman MG, Diehl NN, Serie AM, Paolini MA 2nd, et al. Association between contact sports participation and chronic traumatic encephalopathy: a retrospective cohort study. Brain Pathol. 2020;30(1):63–74. - PMC - PubMed