

Comparison of WHO and CDC growth charts for defining weight status in the young population in Israel: a population-based cross-sectional study
- PMID: 40524275
- PMCID: PMC12168255
- DOI: 10.1186/s13584-025-00699-z
Comparison of WHO and CDC growth charts for defining weight status in the young population in Israel: a population-based cross-sectional study
Abstract
Background: In Israel, the absence of national growth charts leads to the use of CDC or WHO growth charts to assess pediatric growth indices. This population-based cross-sectional study compared BMI z-scores and weight classifications using CDC and WHO charts in children insured by Clalit Health Services (CHS).
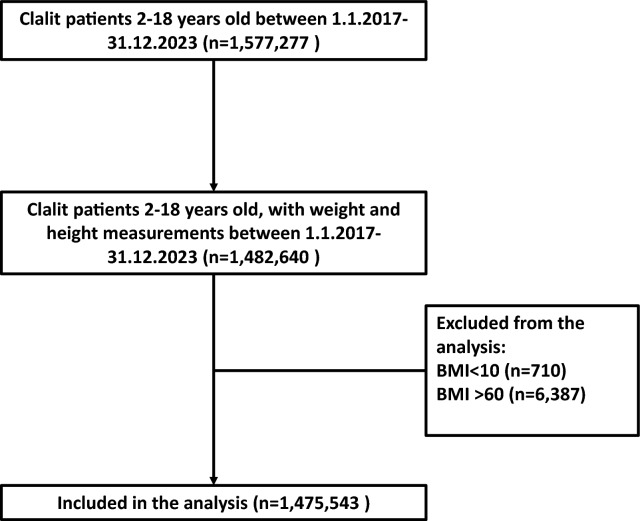
Methods: The study analyzed the CHS electronic database for patients aged 2-18 years with at least one recorded BMI measurement from January 2017 to December 2023. Exclusion criteria included improbable BMI measurements (> 60 kg/m2 or < 10 kg/m2). Demographic data, height, and weight were collected, and BMI z-scores were calculated using both CDC and WHO growth charts. Results were stratified by sex and age groups (2-5 years and > 5-18 years).
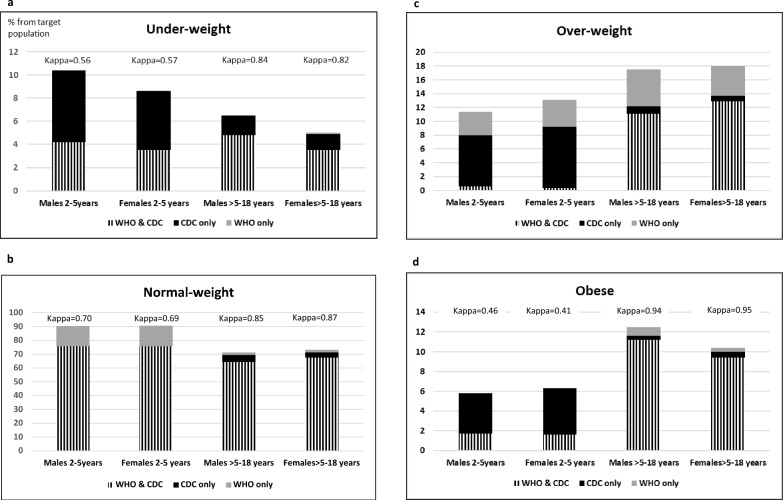
Results: The cohort included 1,475,543 children: 488,008 aged 2-5 years (52% male) and 987,535 aged > 5-18 years (51% male). In the younger group, the median CDC BMI z-scores were below 0 (< 50th percentile), while the median WHO BMI z-scores were above 0 for both sexes, with significant differences between methods (P < 0.001). BMI z-scores were lower in males than in females across both methods (P < 0.001). In the older group, for both methods, the median BMI z-scores were above 0. WHO z-scores had higher medians in males compared to CDC z-scores (P < 0.001), while in females, z-scores were similar between methods (P = 0.210). CDC showed lower median z-scores for males compared to females (P < 0.001), whereas WHO results were comparable between sexes (P = 0.337). There were significant discrepancies in weight classification, particularly in the 2-5 age group. Overweight rates were over 4% higher using CDC charts compared to WHO (P < 0.001), with minimal agreement (Kappa = 0.06 for males, 0.01 for females). In the older group, WHO classified 4% more children as overweight than CDC (P < 0.001), with moderate agreement in males (Kappa = 0.74) and strong agreement in females (Kappa = 0.81).
Conclusions: The study underscores the risk of misclassifying childhood overweight and obesity depending on the growth standard used, particularly in younger children. Policymakers should carefully choose appropriate standards and consider developing national growth charts tailored to the local pediatric population, while allocate resources for early interventions addressing both undernutrition and overnutrition.
Keywords: BMI z-scores; CDC growth chart; Pediatric patients; WHO growth charts; Weight-status classification.
© 2025. The Author(s).
Conflict of interest statement
Declarations. Ethics approval and consent to participate: The study was approved by Rabin Medical Center’s (RMC) ethics review committee (study number RMC 0251–24). Consent for publication: In accordance with the Ministry of Health regulations, the institutional ethics committee (RMC) did not require written informed consent, as data were collected anonymously from computerized medical files, with no active participation of patients. Competing interests: The authors declare that they have no competing interests.
Figures
Similar articles
-
Height, weight and BMI percentiles and nutritional status relative to the international growth references among Pakistani school-aged children.BMC Pediatr. 2012 Mar 19;12:31. doi: 10.1186/1471-2431-12-31. BMC Pediatr. 2012. PMID: 22429910 Free PMC article.
-
The effectiveness of web-based programs on the reduction of childhood obesity in school-aged children: A systematic review.JBI Libr Syst Rev. 2012;10(42 Suppl):1-14. doi: 10.11124/jbisrir-2012-248. JBI Libr Syst Rev. 2012. PMID: 27820152
-
Comparison of the 2005 growth charts for Saudi children and adolescents to the 2000 CDC growth charts.Ann Saudi Med. 2008 Sep-Oct;28(5):334-40. doi: 10.5144/0256-4947.2008.334. Ann Saudi Med. 2008. PMID: 18779639 Free PMC article.
-
Screening and Interventions for Childhood Overweight [Internet].Rockville (MD): Agency for Healthcare Research and Quality (US); 2005 Jul. Rockville (MD): Agency for Healthcare Research and Quality (US); 2005 Jul. PMID: 20722132 Free Books & Documents. Review.
-
Folic acid supplementation and malaria susceptibility and severity among people taking antifolate antimalarial drugs in endemic areas.Cochrane Database Syst Rev. 2022 Feb 1;2(2022):CD014217. doi: 10.1002/14651858.CD014217. Cochrane Database Syst Rev. 2022. PMID: 36321557 Free PMC article.
References
-
- WHO multicenter growth reference group. Assessment of differences in linear growth among population in the WHO multicenter growth references study. Acta Paediatr. 2006;450:56–65. - PubMed
-
- Kuczmarski RJ, Ogden CL, Guo SS, Grummer-Strawn LM, Flegal KM, Mei Z, et al. The 2000 CDC growth charts for the United States: methods and development. Vital Health Stat. 2004;11(246):1–190. - PubMed
-
- Flegal KM, Ogden CL, Wei R, Kuczmarski RJ, Johnson CL. Prevalence of Overweight in US children: comparison of growth charts from the center for disease control and prevention with other reference values for body mass index. Am J Clin Nutr. 2001;73:1086–93. - PubMed
-
- Rito A, Wijnhoven TM, Rutter H, Carvalho MA, Paixao E, Ramos C, et al. Prevalence of obesity among Portuguese children (6–8 years old) using three definition criteria: COSI Portugal, 2008. Pediatr Obes. 2012;7:413–22. - PubMed
MeSH terms
LinkOut - more resources
Full Text Sources
Medical
