. 2025 Jun;45(3):493-507.
doi: 10.19852/j.cnki.jtcm.2025.03.007.

Hamayou () protein hydrolysate ameliorates depression by regulating the mitogen-activated protein kinase pathway

Affiliations

Hamayou () protein hydrolysate ameliorates depression by regulating the mitogen-activated protein kinase pathway

L I Weijia et al. J Tradit Chin Med. 2025 Jun.

Abstract

Objective: To clarify the effect of Hamayou (Oviductus Ranae) protein hydrolysate (ORPH) on depression and its exact underlying mechanism from a new perspective.

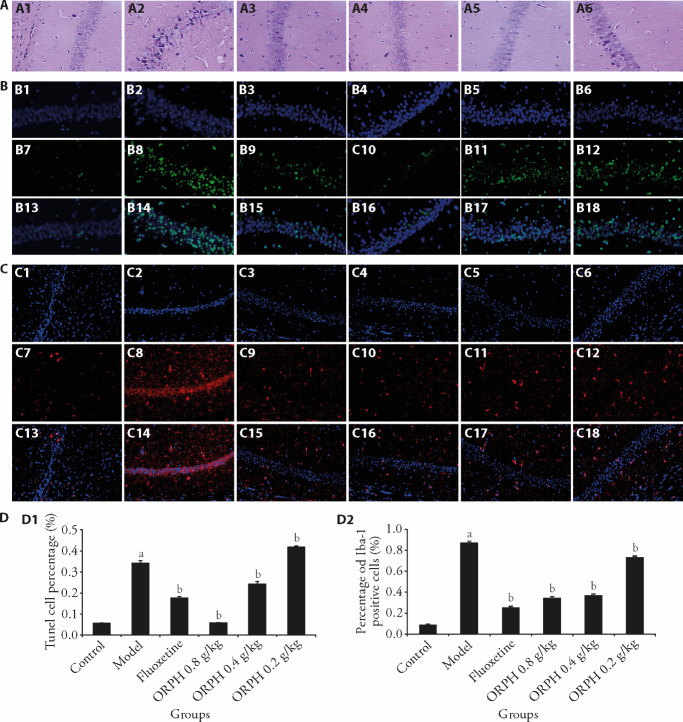
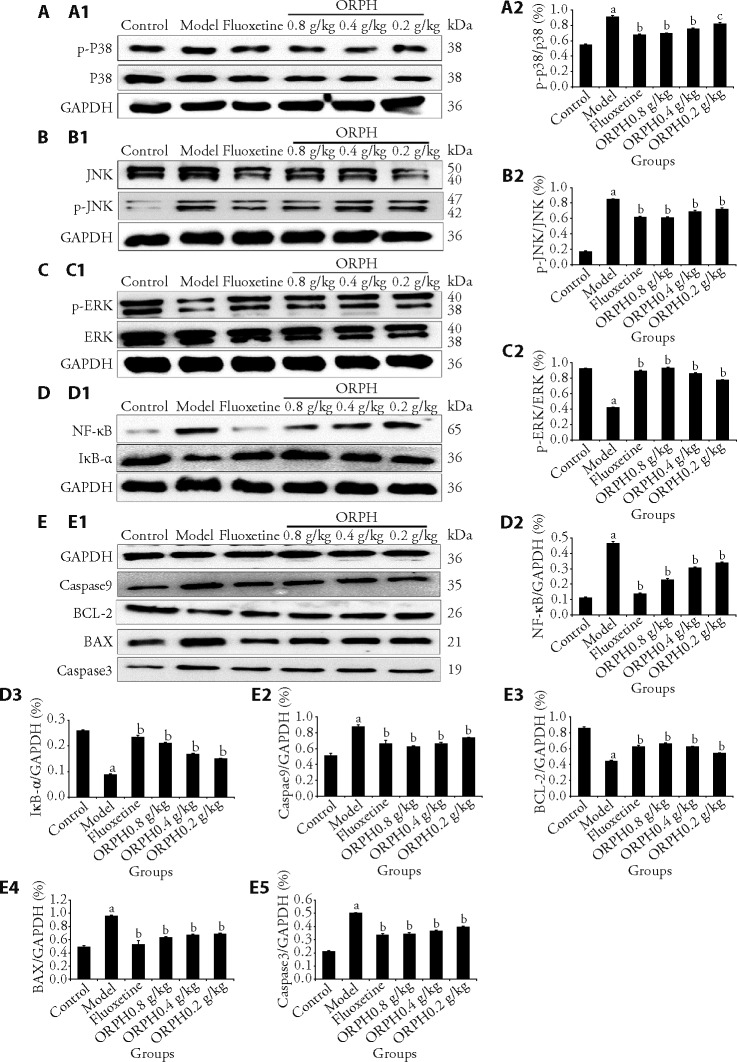
Methods: We used the Chronic Unpredictable Mild Stress (CUMS) method to prepare a mouse model of depression and lipopolysaccharide (LPS) to prepare a model of BV2 cellular inflammation to investigate the antidepressant effect and mechanism of action of ORPH. Behavioral changes in mice and cerebral blood flow were detected by behavioral experiments and scatter imaging. Levels of corticosterone (CORT), proinflammatory cytokines and neurotransmitter were detected by enzyme-linked immunosorbent assay. Furthermore, hematoxylin-eosin staining, Tunel staining were used to evaluate the effect of ORPH. The distribution and expression of ionized calcium bindingadaptor molecule-1 (Iba-1) in mouse hippocampal tissue and BV2 cells were detected by immunofluorescence. Mitogen-activated protein kinase (MAPK) pathway related protein expression was detected by Western blot.

Results: ORPH improved depression-like behavior, ameliorated brain tissue damage and apoptosis, and inhibited microglia activation in brain tissue in mice. In addition, ORPH reduced expression of B-cell lymphoma-2 (Bcl-2)-associated X (Bax), cysteinyl aspartate specific proteinase 3 (Caspase3), cysteinyl aspartate specific proteinase 9 (Caspase9), nuclear factor- kappa B (NF-κB), phosphorylation-p38 (p-p38), phosphorylation-Jun N-terminal kinase (p-JNK) proteins, and increased expression of Bcl-2, inhibitory kappa B alpha (IκB-α), phosphorylation-extracellular regulated protein kinases 1/2 (p-ERK1/2) proteins. On the other hand, there were fewer Iba-1-positive cells, lower expression of NF-κB, p-p38, p-JNK and p-ERK1/2 proteins, and higher expression of IκB-α proteins in BV2 cells in the ORPH group. In addition, ORPH increased 5-hydroxytryptamine, norepinephrine levels and decreased CORT, interleukin-1β (IL-1β), interleukin -6 (IL-6), tumor necrosis factor-α (TNF-α) levels.

Conclusion: ORPH was able to improve depression-like behaviors and that it took effects by promoting cerebral blood flow, inhibition of hypothalamic-pituitary-adrenal axis overactivation, improving the structural damage of hippocampal tissues, and inhibiting the inflammatory response. ORPH can reduced neuronal damage and inhibiting apoptosis by promoting the MAPK pathway.

Keywords: Hamayou (); apoptosis; depression; inflammation; mitogen-activated protein kinases; protein hydrolysates.


Figures

Figure 1
Figure 1. ORPH effects on hippocampal organization.
A: HE staining of mice hippocampal tissue (× 200). A1: Control group, A2: Model group, A3: Fluoxetine group, A4: ORPH 0.8 g/kg group, A5: ORPH 0.4 g/kg group, A6: ORPH 0.2 g/kg group. B: Tunel staining of mice hippocampal tissue (× 400). B1, B2, B3, B4, B5, B6: represent the DAPI staining of the hippocampus in the Control group, Model group, Fluoxetine group, ORPH 0.8 g/kg group, ORPH 0.4 g/kg group, ORPH 0.2 g/kg group of mice. B7, B8, B9, B10, B11, B12: represent the Tunel staining of the hippocampus in the Control group, Model group, Fluoxetine group, ORPH 0.8 g/kg group, ORPH 0.4 g/kg group, ORPH 0.2 g/kg group of mice. B13, B14, B15, B16, B17, B18: represent DAPI merged with Tunel staining of the hippocampus in the Control group, Model group, Fluoxetine group, ORPH 0.8 g/kg group, ORPH 0.4 g/kg group, ORPH 0.2 g/kg group of mice; C: the expression of Iba-1 in hippocampal tissue of mice (× 200). C1, C2, C3, C4, C5, C6: represent the DAPI staining of the hippocampus in the Control group, Model group, Fluoxetine group, ORPH 0.8 g/kg group, ORPH 0.4 g/kg group, ORPH 0.2 g/kg group of mice. C7, C8, C9, C10, C11, C12: represent the Iba-1 staining of the hippocampus in the Control group, Model group, Fluoxetine group, ORPH 0.8 g/kg group, ORPH 0.4 g/kg group, ORPH 0.2 g/kg group of mice. C13, C14, C15, C16, C17, C18: represent DAPI merged with Iba-1 staining of the hippocampus in the Control group, Model group, Fluoxetine group, ORPH 0.8 g/kg group, ORPH 0.4 g/kg group, ORPH 0.2 g/kg group of mice; D: analysis results of Tunel staining and Iba-1 Expression. D1: proportion of Tunel positive cells in B, D2: proportion of Iba-1 positive cells in C. Control: unstressed and intragastrically given 0.2 mL distilled water daily. Model: modeled and were intragastrically with distilled water. Fluoxetine: modeled and were intragastrically with Fluoxetine 3 mg/kg g·kg-1·d-1. ORPH 0.8 g/kg: modeled and were intragastrically with Hamayou (Oviductus Ranae) protein hydrolysate 0.8 g·kg-1·d-1. ORPH 0.4 g/kg: modeled and were intragastrically with Hamayou (Oviductus Ranae) protein hydrolysate 0.4 g·kg-1·d-1. ORPH 0.2 g/kg: modeled and were intragastrically with Hamayou (Oviductus Ranae) protein hydrolysate 0.2 g·kg-1·d-1. ORPH: Hamayou (Oviductus Ranae) protein hydrolysate; HE: hematoxylin-eosin; Tunel: TdT-mediated dUTP Nick-End Labeling; DAPI: 4',6-diamidino-2-phenylindole; Iba-1: Ionized calcium binding adapter molecule-1. Differences were evaluated by one-way analysis of variance. Data are presented as mean ± standard deviation (n = 6 in D1 and n = 5 in D2). aP < 0.01, compared with the Control group; bP < 0.01, compared with the model group.
Figure 2
Figure 2. Regulation of inflammatory factors and MAPK signaling pathways by ORPH in depression model mice
A: p38 and p-p38 proteins expression in hippocampal tissue assessed by Western blot. A1: representative band of p38 and p-p38 proteins detected by WB, A2: p-p38 decreased after treatment; B: JNK and p-JNK proteins expression in hippocampal tissue assessed by Western blot. B1: representative band of JNK and p-JNK proteins detected by WB, B2: p-JNK decreased after treatment; C: ERk and p-ERK proteins expression in hippocampal tissue assessed by Western blot. C1: representative band of ERK and p-ERK proteins detected by WB, C2: p-ERK increased after treatment; D: NF-κb and IκB-α proteins expression in hippocampal tissue assessed by Western blot. D1: representative band of NF-κb and IκB-α proteins detected by WB, D2: NF-κb decreased after treatment, D3: IκB-α increased after treatment; E: Caspase9, BCL-2, BAX and Caspase3 proteins expression in hippocampal tissue assessed by Western blot. E1: representative band of Caspase9, BCL-2, BAX and Caspase3 proteins detected by WB, E2: Caspase9 decreased after treatment, E3: BCL-2 increased after treatment, E4: BAX decreased after treatment, E5: Caspase3 decreased after treatment. Control: unstressed and intragastrically given 0.2 mL distilled water daily. Model: modeled and were intragastrically with distilled water. Fluoxetine: modeled and were intragastrically with Fluoxetine 3 mg/kg g·kg-1·d-1. ORPH 0.8 g/kg: modeled and were intragastrically with Hamayou (Oviductus Ranae) protein hydrolysate 0.8 g·kg-1·d-1. ORPH 0.4 g/kg: modeled and were intragastrically with Hamayou (Oviductus Ranae) protein hydrolysate 0.4 g·kg-1·d-1. ORPH 0.2 g/kg: modeled and were intragastrically with Hamayou (Oviductus Ranae) protein hydrolysate 0.2 g·kg-1·d-1. P38: P38 MAPK; JNK: C-Jun N-terminal kinase; ERK: extracellular signal-regulated kinase; NF-κB: nuclear factor-κB; IκB-α: inhibitor of NF-κB; Bcl-2: B-cell lymphoma-2; BAX: Bcl-2-associated X. Differences were evaluated by one-way analysis of variance; Data are presented as mean ± standard deviation (n = 3); aP < 0;01, compared with the Control group; bP < 0;01, cP < 0;05, compared with the Model group.
Figure 3
Figure 3. Effect of ORPH on BV2 cells
A: the effect of ORPH on the morphology of BV2 cells over a period of 24 h (× 200); B: expression of Iba-1 in BV2 cells (× 200); C: proportion of Iba-1 positive cells in B. A1: control group; A2: model group; A3: ORPH 1.0 mg/mL group; A4: ORPH 0.5 mg/mL group; A5: ORPH 0.25 mg/mL group. B1, B2, B3, B4, B5: represent the DAPI staining of BV2 cells in the Control group, Model group, ORPH 1.0 mg/mL group, ORPH 0.5 mg/mL group, ORPH 0.25 mg/mL group. B6, B7, B8, B9, B10: represent the Iba-1 staining of BV2 cells in the Control group, Model group, ORPH 1.0 mg/mL group, ORPH 0.5 mg/mL group, ORPH 0.25 mg/mL group. B11, B12, B13, B14, B15: represent the DAPI merged with Iba-1 staining of BV2 cells in the Control group, Model group, ORPH 1.0 mg/mL group, ORPH 0.5 mg/mL group, ORPH 0.25 mg/mL group. Control: BV2 cells in complete medium without LPS or ORPH. Model: BV2 cells in complete medium with LPS (200 ng/mL) for 24 h. ORPH 1.0 mg/mL: BV2 cells in complete medium with LPS (200 ng/mL) and Hamayou (Oviductus Ranae) protein hydrolysate 1.0 mg/mL for 24 h. ORPH 0.5 mg/mL: BV2 cells in complete medium with LPS (200 ng/mL) and Hamayou (Oviductus Ranae) protein hydrolysate 0.5 mg/mL for 24 h. ORPH 0.25 mg/mL: BV2 cells in complete medium with LPS (200 ng/mL) and Hamayou (Oviductus Ranae) protein hydrolysate 0.25 mg/mL for 24 h. ORPH: Hamayou (Oviductus Ranae) protein hydrolysate; DAPI: 4',6-diamidino-2-phenylindole; Iba-1: Ionized calcium binding adapter molecule-1. Differences were evaluated by one-way analysis of variance. Data are presented as mean ± standard deviation (n = 3). aP < 0.01, compared with the Control group; bP < 0.01, compared with the Model group.
Figure 4
Figure 4. Regulation of inflammatory factors and MAPK signaling pathways by ORPH in BV2 cells
A: effect of ORPH on inflammatory factor level in BV2 cell supernatant; B: protein expression bands of p38 in BV2 Cells; C: protein expression bands of JNK in BV2 Cells; D: protein expression bands of ERK in BV2 Cells; E: protein expression bands of NF-κB, IκB-α in BV2 Cells. A1: IL-1β decreased after treatment, A2: IL-6 decreased after treatment, A3: TNF-α decreased after treatment. B1: representative band of p38 and p-p38 proteins detected by WB, B2: p-p38 decreased after treatment. C1: representative band of JNK and p-JNK proteins detected by WB, C2: p-JNK decreased after treatment. D1: representative band of ERK and p-ERK proteins detected by WB, D2: p-ERK decreased after treatment. E1: representative band of IκB-α and NF-κB proteins detected by WB, E2: IκB-α increased after treatment, E3: NF-κB decreased after treatment. Control: BV2 cells in complete medium without LPS or ORPH. Model: BV2 cells in complete medium with LPS (200 ng/mL) for 24 h. ORPH 1.0 mg/mL: BV2 cells in complete medium with LPS (200 ng/mL) and Hamayou (Oviductus Ranae) protein hydrolysate 1.0 mg/mL for 24 h. ORPH 0.5 mg/mL: BV2 cells in complete medium with LPS (200 ng/mL) and Hamayou (Oviductus Ranae) protein hydrolysate 0.5 mg/mL for 24 h. ORPH 0.25 mg/mL: BV2 cells in complete medium with LPS (200 ng/mL) and Hamayou (Oviductus Ranae) protein hydrolysate 0.25 mg/mL for 24 h. MAPK: mitogen-activated protein kinase; ORPH: Hamayou (Oviductus Ranae) protein hydrolysate; IL-1β: interleukin-1β; IL-6: interleukin-6; TNF-α: tumor necrosis factor-α; JNK: C-Jun N-terminal kinase; ERK: extracellular signal-regulated kinase; GAPDH: glyceraldehyde-3-phosphate dehydrogenase; NF-κB: nuclear factor-κB; IκB-α: inhibitor of NF-κB; Bcl-2: B-cell lymphoma-2; BAX: Bcl-2-associated X. Differences were evaluated by one-way analysis of variance. Data are presented as mean ± standard deviation (n = 3). aP < 0.01, compared with the Control group; bP < 0.01, cP < 0.05 compared with the Model group.

References

    1. Marwaha S, Palmer E, Suppes T, Cons E, Young AH, Upthegrove R. Novel and emerging treatments for major depression. Lancet 2023; 10371: 141-53. - PubMed
    1. Delgado P. Depression: the case for a monoamine deficiency. J Clin Psychiatry 2000; 61: 7-11. - PubMed
    1. Parker K, Schatzberg A, Lyons D. Neuroendocrine aspects of hypercortisolism in major depression. Horm Behav 2003; 43: 60-6. - PubMed
    1. Zutphen E, Rhebergen D, Exel E, et al. Brain-derived neurotrophic factor as a possible predictor of electroconvulsive therapy outcome. Transl Psychiatry 2019; 9: 155. - PMC - PubMed
    1. Majidi J, Kosari-Nasab M, Salari A. Developmental minocycline treatment reverses the effects of neonatal immune activation on anxiety- and depression-like behaviors, hippocampal inflammation, and HPA axis activity in adult mice. Brain Res Bull 2016; 120: 1-13. - PubMed

LinkOut - more resources