. 2025 Dec;17(1):2519697.
doi: 10.1080/19490976.2025.2519697. Epub 2025 Jun 16.

Proton-pump inhibitors increase C. difficile infection risk by altering pH rather than by affecting the gut microbiome based on a bioreactor model

Affiliations

Proton-pump inhibitors increase C. difficile infection risk by altering pH rather than by affecting the gut microbiome based on a bioreactor model

Julia Schumacher et al. Gut Microbes. 2025 Dec.

Abstract

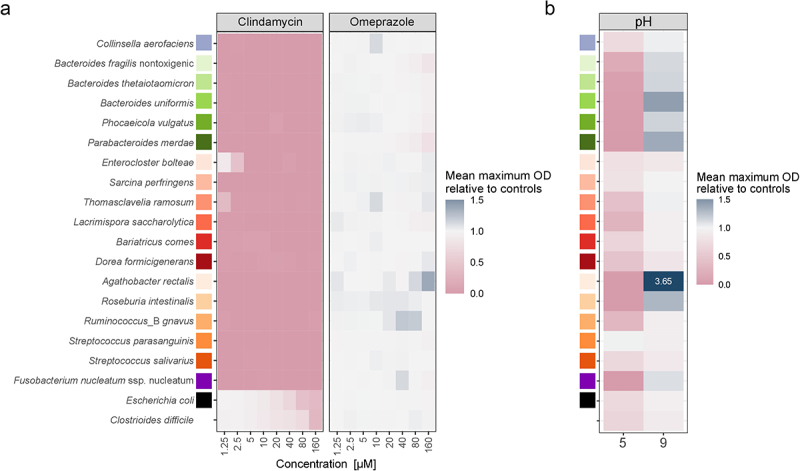
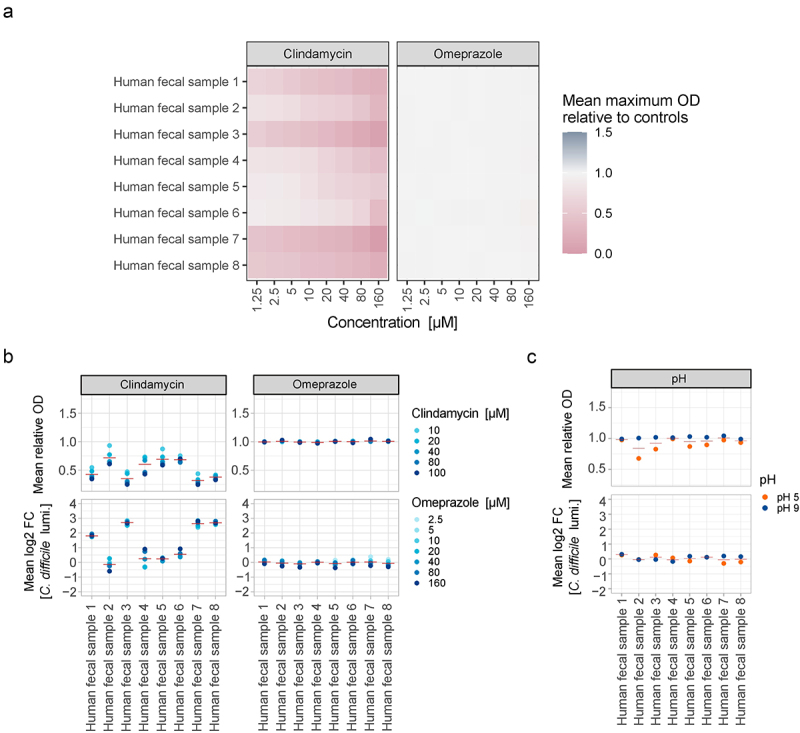
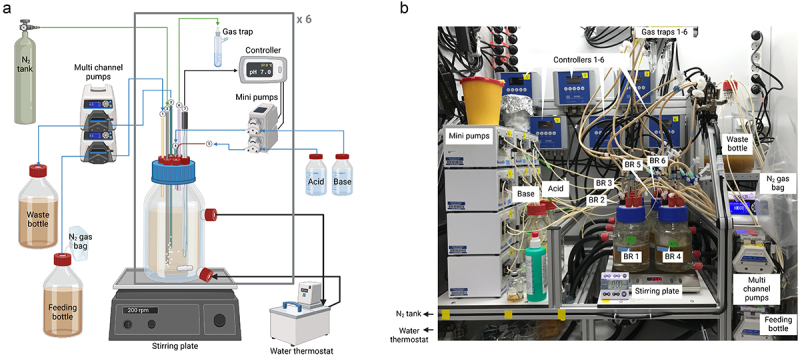
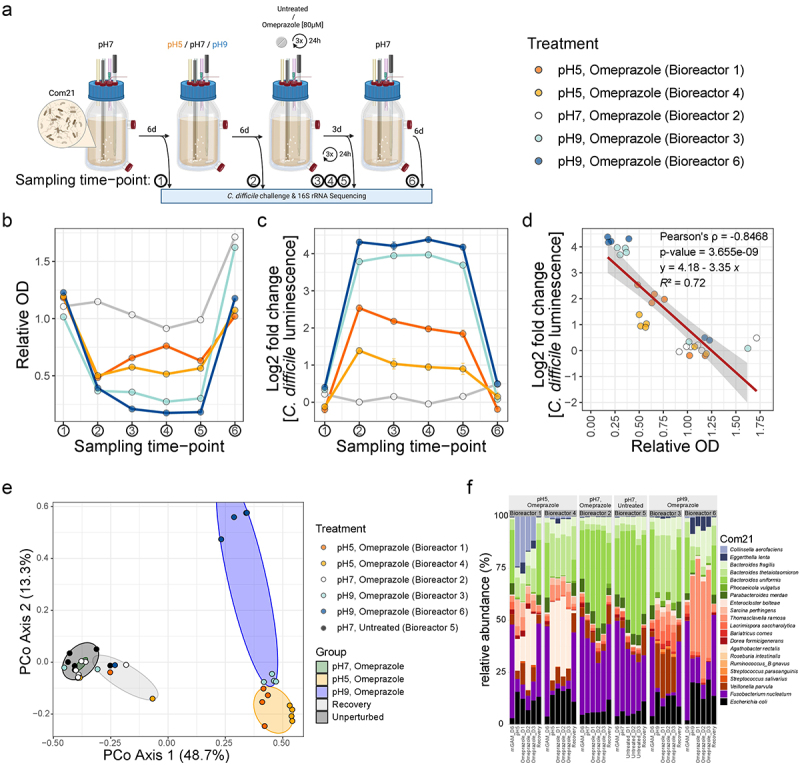
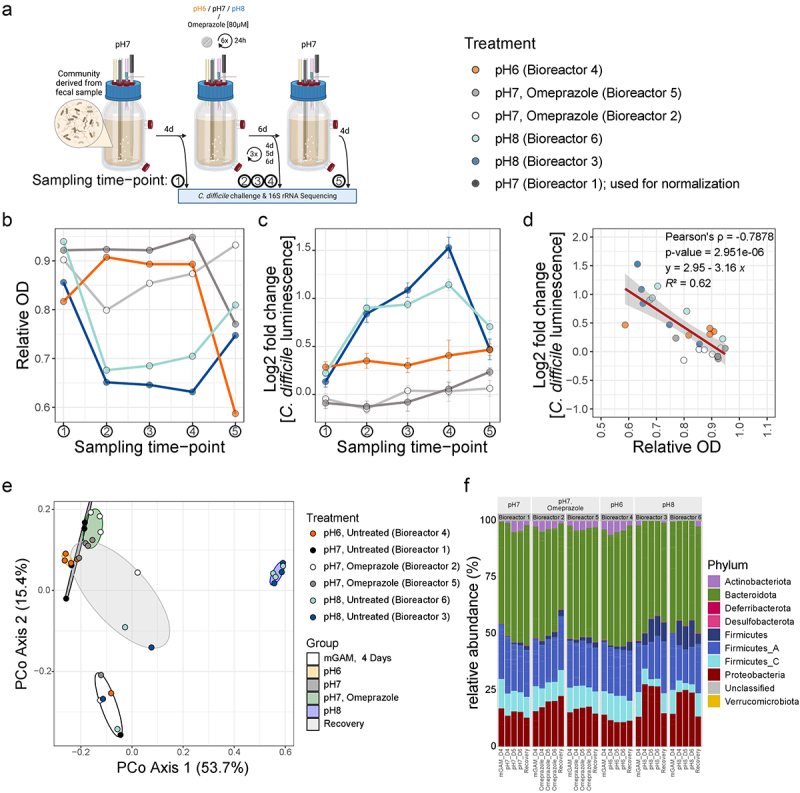
Clostridioides difficile infections often occur after antibiotic use, but they have also been linked to proton-pump inhibitor (PPI) therapy. The underlying mechanism - whether infection risk is due to a direct effect of PPIs on the gut microbiome or changes in gastrointestinal pH - has remained unclear. To disentangle both possibilities, we studied the impact of the proton-pump inhibitor omeprazole and pH changes on key members of the human gut microbiome and stool-derived microbial communities from different donors in vitro. We then developed a custom multiple-bioreactor system to grow a model human microbiome community and a stool-derived community in chemostat mode and tested the effects of omeprazole exposure, pH changes, and their combination on C. difficile growth within these communities. Our findings show that changes in pH significantly affect the gut microbial community's biomass and the abundances of different bacterial taxa, leading to increased C. difficile growth within the community. However, omeprazole treatment alone did not result in such effects. These findings imply that the higher risk of C. difficile infection following proton-pump inhibitor therapy is probably because of alterations in gastrointestinal pH rather than a direct interaction between the drug and the microbiome. This understanding offers a new perspective on infection risks in proton-pump inhibitor therapy.

Keywords: Proton-pump inhibitor; bioreactor; clostridioides difficile infection; colonization resistance; gut microbiota.


Conflict of interest statement

No potential conflict of interest was reported by the author(s).

Figures

Figure 1.
Figure 1.
Individual sensitivity of 19 Com21 members to omeprazole and pH. a) Growth of Com21 members in the presence of different concentrations of clindamycin and omeprazole in monoculture. Heatmap depicts the mean maximum optical density (OD) of cultures in the stationary phase compared to untreated controls (N = 3). b) Growth of Com21 members at different pH in monoculture. Heatmap depicts the mean maximum OD of cultures in the stationary phase compared to OD at pH 7.4. Values outside the legend range are written within the heatmap tile (N = 3).
Figure 2.
Figure 2.
Neither omeprazole treatment nor changes in pH promote the growth of C. difficile within human stool-derived microbial communities. a) Growth of communities derived from eight human fecal samples in the presence of different concentrations of clindamycin (left) and omeprazole (right). Heatmap depicts the mean maximum optical density (OD) of cultures in the stationary phase compared to untreated control growth (N = 3). b) Top: mean OD of the eight communities relative to untreated controls after treatment with different concentrations of clindamycin (left) or omeprazole (right) for 24 h. Red horizontal line depicts the mean per stool-derived community across all concentrations (N = 3) bottom: mean log2 Fold change (FC) of C. difficile growth as determined by C. difficile luminescence after 5 h in clindamycin (left) or omeprazole (right) treated communities relative to untreated controls. Red horizontal line depicts the mean per stool-derived community across all concentrations (N = 3). c) Top: mean OD of eight human stool-derived communities relative to controls at pH 7.4 after growth at different pH for 24 h. Red horizontal line depicts the mean per community (N = 3) bottom: mean FC of C. difficile growth as determined by C. difficile luminescence after 5 h in pH-exposed communities relative to controls at pH 7.4. Red horizontal line depicts the mean per stool-derived community (N = 3).
Figure 3.
Figure 3.
Overview of the multiple-bioreactor system. a) Schematic overview of a single bioreactor bottle. Each double-walled bioreactor bottle has a volume of 500 mL. 1: fresh medium is introduced at a desired flow rate through the feeding port from a feeding bottle; 2: the desired gas mix is introduced into the bottle through a stainless-steel tube with an attached sparger; 3: spent medium is removed through a stainless-steel tube and collected in a waste bottle. This port is also used as a sampling port where samples can be taken with a syringe; 4: a syringe punched through a rubber stopper is used as base port; 5: the acid port is a button once cannula punched through the same rubber stopper as the base port; 6: the gas-out port is connected to a foam trap; 7: an autoclavable pH/pt1000-electrode measuring the pH and temperature is connected to a multi-parameter controller. Each controller is connected to two mini-pumps that are triggered to pump acid or base when the pH falls out of range. All bioreactor bottles are placed on a multi-stirrer plate and stirred with a magnetic stirrer. Temperature is maintained by a water jacket connected to a water thermostat. As indicated by the brackets and the x6 we have 6 bioreactors which can be used simultaneously. Created with BioRender.com. b) Picture of the complete setup. The water thermostat and the gas line are not visible. BR: bioreactor.
Figure 4.
Figure 4.
Changes in pH decrease community biomass, significantly alter community composition, and increase growth of C. difficile in Com21. a) Schematic overview of the bioreactor workflow. Com21 was grown for six HRTs in chemostat mode with mGAM at pH 7. After this period, the pH was either changed to pH 5 or pH 9 for six HRTs or left unchanged. Subsequently, omeprazole was added daily at 80 µM to five of the six bioreactors for three consecutive HRTs, after which all bioreactors were returned to pH 7 for another six HRTs. Sampling points are indicated with arrows. Created with BioRender.com. b) Relative OD of the bioreactors over time at every sampling time point compared to the median OD of the untreated control (bioreactor 5). Bioreactors 1 and 4 were switched to pH 5, bioreactors 3 and 6 to pH 9, and bioreactor 2 remained at pH 7. All bioreactors, except the control bioreactor 5 used for normalization, underwent omeprazole treatment at 80 µM. c) Log2 Fold change in C. difficile growth in the bioreactor communities at every time point. C. difficile growth was quantified by luminescence measurement after 5 h and normalized to the median luminescence of C. difficile in the untreated control (bioreactor 5) at the same time point. The mean with standard deviation of 10 technical replicates is shown. d) Correlation of relative community OD to log2 Fold change in C. difficile growth. Values from plots B and C are shown with colors indicating the corresponding bioreactor. The red line represents the linear trendline, with its function, R2 value, Pearson correlation, and p-value provided in the plot. e) Principal coordinate analysis of bray-curtis dissimilarity. Data points are color-coded by bioreactor and grouped by treatment (colored ellipses). The untreated control (bioreactor 5), initial compositions of all bioreactors, and pH 7 treatment of bioreactor 2 are grouped as ‘unperturbed’. The three omeprazole treatment sampling points of bioreactor 2 are grouped as ‘pH7, omeprazole’. Sampling points at pH 5 (with and without omeprazole) for bioreactors 1 and 4 are grouped as ‘pH 5, omeprazole’. Sampling points at pH 9 (with and without omeprazole) for bioreactors 3 and 6 are grouped as ‘pH 9, omeprazole’. All recovery sampling points (except bioreactor 5) are grouped under ‘recovery’. f) Relative abundance of each member of Com21 at the indicated sampling time points. Panels are grouped by bioreactor: bioreactors 1 and 4 were changed to pH 5 with omeprazole, bioreactors 3 and 6 were changed to pH 9 with omeprazole, bioreactor 2 was treated with omeprazole, and bioreactor 5 was left untreated.
Figure 5.
Figure 5.
Changes in pH decrease community biomass, alter community composition, and increase growth of C. difficile in human stool-derived communities. a) Schematic overview of the bioreactor workflow. A human stool-derived community was grown for four HRTs in chemostat mode with mGAM at pH 7. After this period, the pH was either changed to pH 6 or pH 8 for six HRTs or left unchanged with and without addition of 80 µM omeprazole every 24 h. After the six HRTs, all bioreactors were returned to pH 7 for four HRTs. Sampling points are indicated with arrows. Created with BioRender.com. b) Relative OD of the bioreactors over time at every sampling time point compared to the median OD of the untreated control (bioreactor 1). Bioreactor 4 was switched to pH 6, bioreactors 3 and 6 to pH 8, and bioreactors 2 and 5 remained at pH 7 with the addition of 80 µM omeprazole daily. c) Log2 Fold change in C. difficile growth in the bioreactor communities at every time point. C. difficile growth was quantified by luminescence measurement after 5 h and normalized to the median luminescence of C. difficile in the untreated control (bioreactor 1) at the same time point. The mean with standard deviation of 10 technical replicates is shown. d) Correlation of relative community OD to log2 Fold change in C. difficile growth. Values from plots B and C are shown with colors indicating the corresponding bioreactor. The red line represents the linear trendline, with its function, R2 value, Pearson correlation, and p-value provided in the plot. e) Principal coordinate analysis of bray-curtis dissimilarity. Data points are color-coded by bioreactor and grouped by treatment (colored ellipses). Initial compositions of all bioreactors are grouped as ‘mGAM, 4 days’. The untreated bioreactor 1 is grouped as ‘pH 7’. The three omeprazole treatment sampling points of bioreactor 2 and 5 are grouped as ‘pH7, omeprazole’. Sampling points at pH 6 for bioreactor 4 are grouped as ‘pH 6’. Sampling points at pH 8 for bioreactors 3 and 6 are grouped as ‘pH 8’. All recovery sampling points (except bioreactor 1) are grouped under ‘recovery’. f) Relative abundance (at phylum level) of human stool-derived sample 1 in the bioreactors at the indicated sampling time points. Panels are grouped by bioreactor: bioreactor 1 was left untreated, bioreactors 2 and 5 were treated with omeprazole, bioreactor 4 was changed to pH 6, and bioreactors 3 and 6 were changed to pH 8.

References

    1. Balsells E, Shi T, Leese C, Lyell I, Burrows J, Wiuff C, Campbell H, Kyaw MH, Nair H.. Global burden of Clostridium difficile infections: a systematic review and meta-analysis. J Glob Health. 2019;9(1):010407. doi: 10.7189/jogh.09.010407. - DOI - PMC - PubMed
    1. Guh AY, Adkins SH, Li Q, Bulens SN, Farley MM, Smith Z, Holzbauer SM, Whitten T, Phipps EC, Hancock EB, et al. Risk factors for community-associated Clostridium difficile infection in adults: a case-control study. Open Forum Infect Dis. 2017;4(4):ofx171. doi: 10.1093/ofid/ofx171. - DOI - PMC - PubMed
    1. Furuya-Kanamori L, Stone JC, Clark J, McKenzie SJ, Yakob L, Paterson DL, Riley TV, Doi SAR, Clements AC. Comorbidities, exposure to medications, and the risk of community-acquired Clostridium difficile infection: a systematic review and meta-analysis. Infect Control Hosp Epidemiol. 2015;36(2):132–21. doi: 10.1017/ice.2014.39. - DOI - PubMed
    1. Miller AC, Arakkal AT, Sewell DK, Segre AM, Tholany J, Polgreen PM. Comparison of different antibiotics and the risk for community-associated Clostridioides difficile infection: A case–control study. Open Forum Infect Dis. 2023;10(8):ofad413. doi: 10.1093/ofid/ofad413. - DOI - PMC - PubMed
    1. Deshpande A, Pasupuleti V, Thota P, Pant C, Rolston DDK, Sferra TJ, Hernandez AV, Donskey CJ. Community-associated Clostridium difficile infection and antibiotics: a meta-analysis. J Antimicrob Chemother. 2013;68(9):1951–1961. doi: 10.1093/jac/dkt129. - DOI - PubMed

MeSH terms

LinkOut - more resources