. 2025 Aug;24(8):e70123.
doi: 10.1111/acel.70123. Epub 2025 Jun 16.

Short-Term Severe Energy Restriction Promotes Molecular Health and Reverses Aging Signatures in Adults With Prediabetes in the PREVIEW Study

Affiliations

Short-Term Severe Energy Restriction Promotes Molecular Health and Reverses Aging Signatures in Adults With Prediabetes in the PREVIEW Study

Maria Lastra Cagigas et al. Aging Cell. 2025 Aug.

Abstract

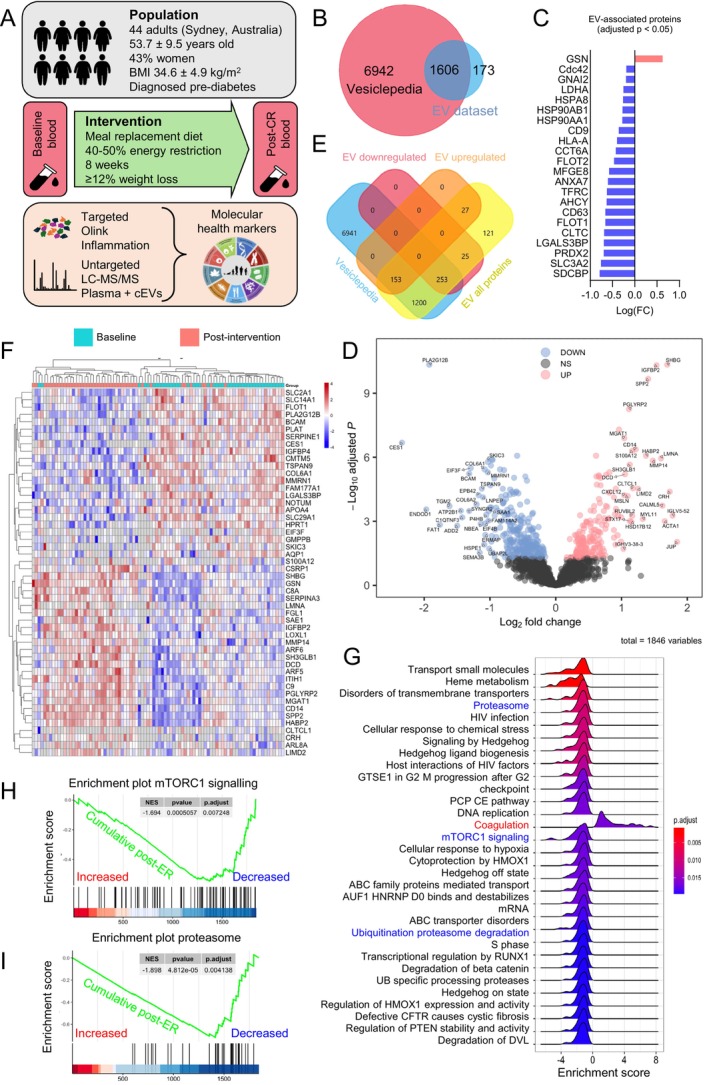
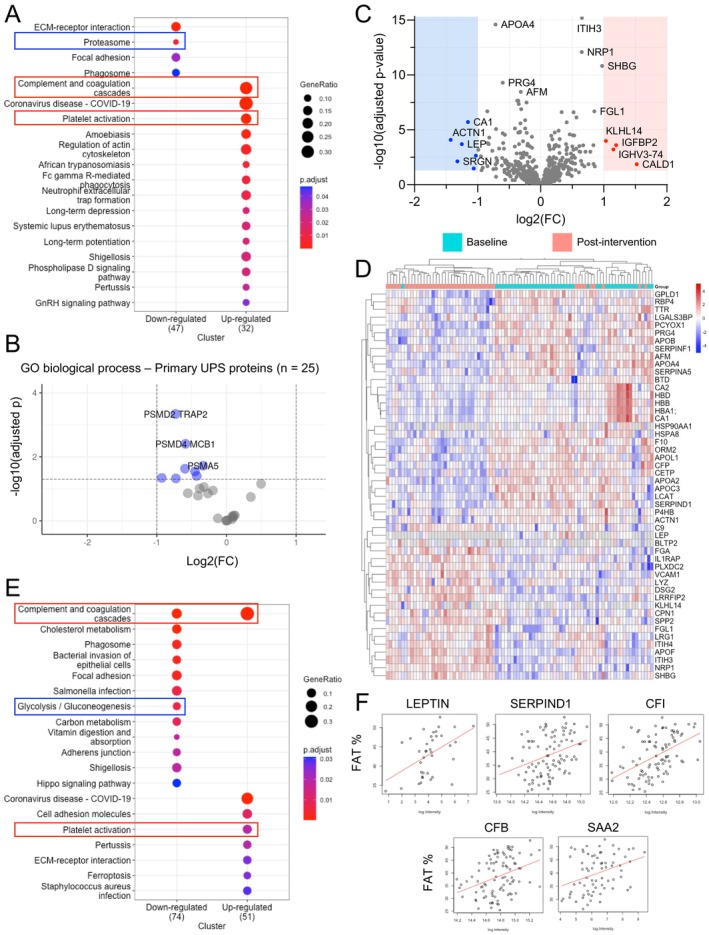
Prediabetes, characterized by impaired fasting glucose and/or glucose tolerance, is associated with organ damage, increased mortality, and accelerated aging, even before diabetes onset. Severe short-term energy restriction while maintaining essential nutrient intake is among the most effective strategies for weight loss, metabolic health improvement, and delaying type 2 diabetes progression. Extracellular vesicles contribute to these metabolic benefits; however, the impact of energy-restriction-induced weight loss on the extracellular vesicle proteome remains incompletely understood. This study employed targeted and untargeted proteomics to investigate the effect of an 8-week severely energy-restricted diet on the plasma proteome in adults with prediabetes from Sydney, Australia, as part of the PREVIEW study. Circulating extracellular vesicles were enriched in plasma using an immunoaffinity-based protocol. A total of 44 participants who achieved at least a 12% weight loss and provided informed consent were included in the study. Paired changes in over 2000 proteins between baseline and week 8 were analyzed. Following the intervention, multiple proteins associated with inflammation and senescence were significantly reduced, reversing the increase commonly associated with aging. The decline in inflammatory and senescence markers may have been mediated by extracellular vesicles, as indicated by significantly lower circulating levels of several vesicular markers. Additionally, several markers of protein synthesis downstream of mTORC1 and protein degradation were significantly reduced in vesicle-enriched plasma, suggesting decreased intercellular secretion and/or trafficking. Overall, this study identifies a diet-induced proteomic signature suggestive of reduced inflammation, lower senescence, and enhanced vesicle-associated proteostasis, potentially conferring health benefits beyond glycemic control.


Conflict of interest statement

L.F. and J.B.M. are authors of widely recognized nutrition books on metabolic health. The remaining authors declare no conflicts of interest. This article was not commissioned, and the funding sources had no role in the study design, data interpretation, or the generation of the findings. No author received financial or other benefits for their contributions to this work.

Figures

FIGURE 1
FIGURE 1
Energy‐restriction‐induced weight loss reduces circulating extracellular vesicle (cEV) markers. (A) Diagram of study design, population, intervention, and methodology. BMI, Body Mass Index; ER, Energy Restriction; cEV, circulating extracellular vesicles; LC–MS/MS, liquid chromatography with tandem mass spectrometry. (B) Overlap between cEV‐enriched plasma proteins from LC–MS/MS (EV dataset, blue) and proteins annotated in Vesiclepedia (pink). Vesiclepedia was accessed in October 2024. (C) All differentially expressed proteins (adj p < 0.05) from the EV dataset that belong to the “top 100 EV‐associated proteins” in Vesiclepedia. Significantly decreased (n = 21, blue) and significantly increased (n = 1, pink) proteins. (D) Volcano plot of cEV proteins from LC–MS/MS at week 8 relative to baseline, including significantly decreased (blue), unchanged (gray), and significantly increased (pink) (adj p < 0.05). Proteins with absolute FC ≥ 2 are named. (E) Overlap of differentially expressed cEV proteins from “D” with the Vesiclepedia database. (F) Top 50 significantly differentially expressed cEV proteins by adj p‐value, paired. Each row represents a significantly decreased (blue) or increased (red) protein. Each column represents a study participant at baseline (teal) and at week 8 (pink). (G) GSEA of significantly enriched pathways post‐intervention relative to baseline, including downregulated (negative enrichment score) and upregulated (positive enrichment score) pathways from the cEVs dataset. Adj p‐values are color‐coded. (H, I) Related to “G,” enrichment plots of the mTORC1 signaling pathway and the proteasome post‐CR. The green lines represent the cumulative enrichment score, with proteins increased on the left (red) and decreased on the right (blue). Adj p = 0.0072 and 0.0041, respectively. Input = cEV proteins.
FIGURE 2
FIGURE 2
Energy‐restriction‐induced weight loss reduces markers of protein synthesis downstream of mTORC1. Diagram of the glucose/insulin/mTORC1/eIF4E/protein synthesis signaling pathway. For all graphs, the arrows represent protein levels for each study participant (n = 44) from baseline to post‐intervention. Increased levels are shown by increasing arrows in red, whereas decreased levels are shown by decreasing arrows in blue. All changes shown are significant (p and adj p < 0.05), except for eIF4E (p < 0.05 but adj p > 0.05). Glucose and insulin were measured and previously reported by the PREVIEW study. All other proteins were extracted from the LC–MS/MS proteomics dataset. Protein color represents decreased abundance (blue), increased abundance (red), not measured/not detected (gray), or statistically non‐significant (green). P, phosphorylation; eIF, eukaryotic translation initiation factor.
FIGURE 3
FIGURE 3
Energy‐restriction‐induced weight loss reduces markers of protein degradation via the ubiquitin‐proteasome system. (A) Top differentially expressed pathways from KEGG pathway enrichment analysis post‐CR. Input = cEV dataset. Adj p‐values are color‐coded. Pathways of interest are labeled (red rectangle = increased, blue rectangle = decreased). Larger circles represent higher protein ratios. (B) Volcano plot of proteins with the primary annotated “Gene Ontology (GO) Biological Process” as the ubiquitin‐proteasome system. N = 25 proteins. Input = cEV dataset. Significantly decreased proteins are labeled (blue, adj p < 0.05). No significantly increased proteins were detected. (C) Volcano plot of all proteins from the neat plasma dataset. N = 569 proteins (one protein, APOF, is out of the chart axis due to a large adj p = 6.49E‐21). Significantly decreased (blue, adj p < 0.05) and significantly increased (red, adj p < 0.05) with absolute FC > 2 are labeled. (D) Top 50 significantly differentially expressed neat plasma proteins by adj p‐value, paired. Each row represents a significantly decreased (blue) or increased (red) protein. Each column represents a study participant at baseline (teal) and at week 8 (pink). (E) The same KEGG analysis as per “A” with input = neat plasma dataset. Pathways of interest are labeled (red rectangle = increased, blue rectangle = decreased). (F) Scatter plots of selected proteins significantly correlated with both body fat % at baseline and with Δ fat % (fat % at post‐intervention minus fat % at baseline). Input = neat plasma dataset. Each dot represents a measurement of baseline fat % and respective protein level in a study participant. Red lines (best fit lines) with a positive slope represent a positive association between fat % and protein abundance. All reported significant changes are adj p < 0.05.
FIGURE 4
FIGURE 4
Energy‐restriction‐induced weight loss lowers senescence factors and reverses the aging effect of multiple inflammatory proteins. (A) Volcano plot of all proteins from the Olink Targeted Inflammation Panel. N = 92 proteins. Significantly decreased post‐intervention (blue, adj p < 0.05, n = 25 proteins) and significantly increased post‐intervention (red, adj p < 0.05, n = 4 proteins) are labeled. Top differentially expressed proteins by p‐value are named. (B) Individual abundances for the top 9 differentially expressed proteins by p‐value, paired. Each dot represents the protein abundance in each study participant at baseline and week 8. NPX, Normalized Protein Expression. (C) All significant SASP proteins (adj p < 0.05) from the Olink dataset that belong to the curated SASP list provided in Supporting Information. Significantly decreased (n = 7, blue) and significantly increased (n = 1, pink) SASP proteins. (D, E) Correlation of results from the Olink inflammation panel post‐intervention with the human plasma proteome across lifespan in two previously published datasets. Representation of the intervention effect (X axis, protein abundance changes post‐ER) and the calculated aging effect from TWC Stanford and CDW Biogen (Y axis, protein abundance changes with increasing age).

Similar articles

References

    1. Akbar, N. , Azzimato V., Choudhury R. P., and Aouadi M.. 2019. “Extracellular Vesicles in Metabolic Disease.” Diabetologia 62, no. 12: 2179–2187. 10.1007/s00125-019-05014-5. - DOI - PMC - PubMed
    1. Alfadda, A. A. , Turjoman A. A., Moustafa A. S., et al. 2014. “A Proteomic Analysis of Excreted and Circulating Proteins From Obese Patients Following Two Different Weight‐Loss Strategies.” Experimental Biology and Medicine 239, no. 5: 568–580. 10.1177/1535370214523894. - DOI - PubMed
    1. Altun, M. , Besche H. C., Overkleeft H. S., et al. 2010. “Muscle Wasting in Aged, Sarcopenic Rats Is Associated With Enhanced Activity of the Ubiquitin Proteasome Pathway.” Journal of Biological Chemistry 285, no. 51: 39597–39608. 10.1074/jbc.M110.129718. - DOI - PMC - PubMed
    1. Anfossi, G. , Russo I., and Trovati M.. 2009. “Platelet Dysfunction in Central Obesity.” Nutrition, Metabolism, and Cardiovascular Diseases 19, no. 6: 440–449. 10.1016/j.numecd.2009.01.006. - DOI - PubMed
    1. Aversa, Z. , White T. A., Heeren A. A., et al. 2024. “Calorie Restriction Reduces Biomarkers of Cellular Senescence in Humans.” Aging Cell 23, no. 2: e14038. 10.1111/acel.14038. - DOI - PMC - PubMed

Further Reading

    1. Assarsson, E. , Lundberg M., Holmquist G., et al. 2014. “Homogenous 96‐Plex PEA Immunoassay Exhibiting High Sensitivity, Specificity, and Excellent Scalability.” PLoS One 9: e95192. - PMC - PubMed
    1. Carrasco‐Zanini, J. , Pietzner M., Davitte J., et al. 2024. “Proteomic Signatures Improve Risk Prediction for Common and Rare Diseases.” Nature Medicine 30: 2489–2498. - PMC - PubMed
    1. Coppé, J.‐P. , Desprez P. Y., Krtolica A., and Campisi J.. 2010. “The Senescence‐Associated Secretory Phenotype: The Dark Side of Tumor Suppression.” Annual Review of Pathology: Mechanisms of Disease 5, no. 1: 99–118. - PMC - PubMed
    1. Kassambara, A. 2018. Ggpubr: ‘ggplot2’ Based Publication Ready Plots. R package version
    1. Lehallier, B. , Gate D., Schaum N., et al. 2019. “Undulating Changes in Human Plasma Proteome Profiles Across the Lifespan.” Nature Medicine 25, no. 12: 1843–1850. - PMC - PubMed

LinkOut - more resources