

Real-Time Monitoring of Chemisorption of Antibodies onto Self-Assembled Monolayers Deposited on Gold Electrodes Using Electrochemical Impedance Spectroscopy
- PMID: 40524552
- PMCID: PMC12224300
- DOI: 10.1021/acs.langmuir.5c01062
Real-Time Monitoring of Chemisorption of Antibodies onto Self-Assembled Monolayers Deposited on Gold Electrodes Using Electrochemical Impedance Spectroscopy
Abstract
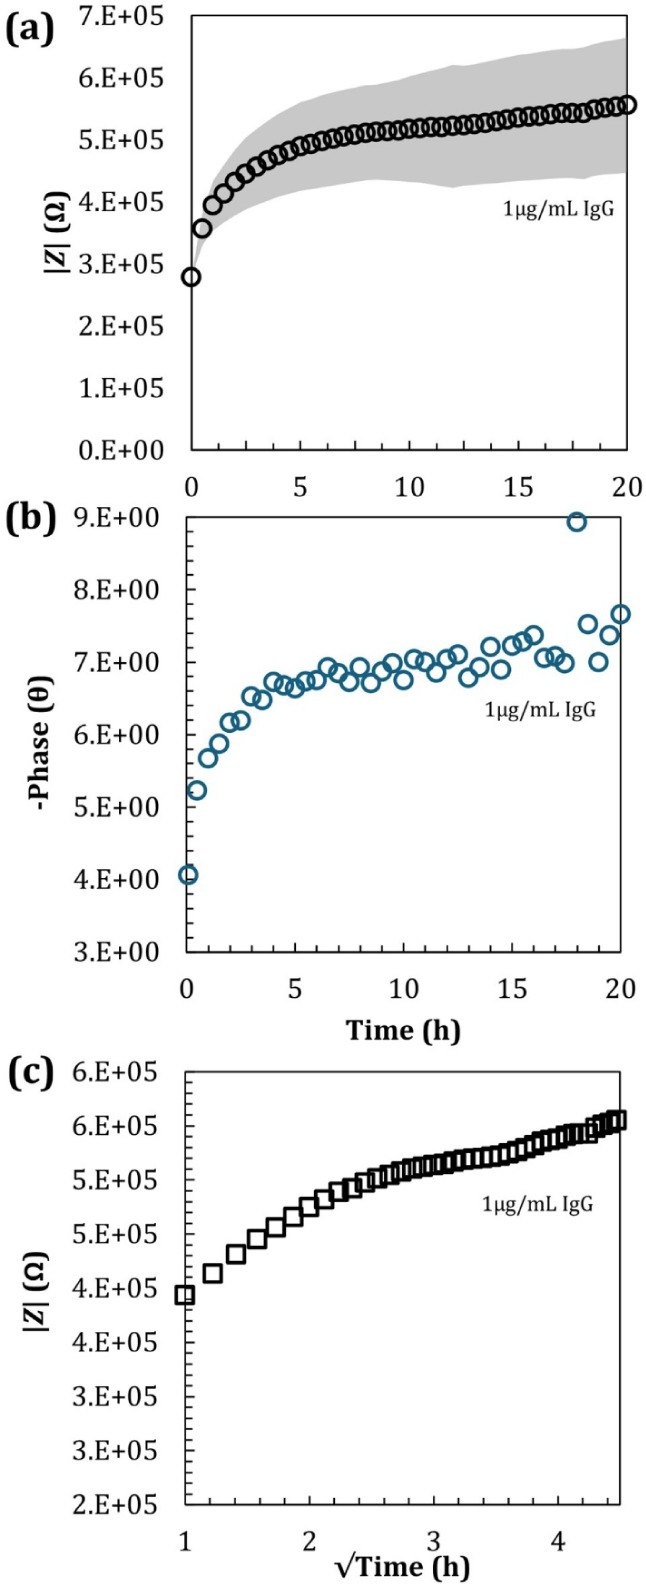
Understanding protein binding to biosensing surfaces is paramount to the design and performance of biosensing devices in fields such as point-of-care testing and bioanalytics. Here, we systematically demonstrated the use of electrical impedance spectroscopy (EIS) and equivalent circuit modeling for real-time tracking of chemisorption of IgG antibody to large-area circular gold electrodes (1.3 mm2) functionalized with a self-assembled monolayer (SAM). Using 1 μg/mL IgG and 5 mM of [Fe(CN)6]3-/4-, the measured low-frequency impedance proved sensitive to both equilibrium and kinetics of antibody binding, with a slope of ∼74 kΩ/h for the first 2 h and taking approximately 4 h to reach equilibrium in a standard 6 mm-diameter well. Changes in impedance were found to be proportional to the reciprocal of the change in capacitance up to half-to-full IgG monolayer bound to the SAM. Further experiments with a flat microchannel confirmed that the low-frequency impedance and equivalent charge-transfer resistance (Rct) depend not only on antibody diffusion but also on the surface-to-volume ratio, which can represent a major challenge previously unreported for the miniaturization of EIS in microfluidic devices. This challenge arises as it requires a higher concentration of [Fe(CN)6]3-/4-, of 50 mM or above, which was found to interfere with Rct during chemisorption at low IgG concentrations. Chemisorption of IgG to SAM was confirmed with fluorescence microscopy and FTIR. This study marks, to the best of our knowledge, the first experimental demonstration of EIS as a real-time technique for quantitation of Langmuir isotherms during chemisorption of antibodies to SAM, with the potential to improve the design of EIS-based biosensors, especially those integrated into microfluidic devices.
Figures


Similar articles
-
Bioengineered nerve conduits and wraps for peripheral nerve repair of the upper limb.Cochrane Database Syst Rev. 2022 Dec 7;12(12):CD012574. doi: 10.1002/14651858.CD012574.pub2. Cochrane Database Syst Rev. 2022. PMID: 36477774 Free PMC article.
-
Home treatment for mental health problems: a systematic review.Health Technol Assess. 2001;5(15):1-139. doi: 10.3310/hta5150. Health Technol Assess. 2001. PMID: 11532236
-
Transcutaneous electrical nerve stimulation (TENS) for fibromyalgia in adults.Cochrane Database Syst Rev. 2017 Oct 9;10(10):CD012172. doi: 10.1002/14651858.CD012172.pub2. Cochrane Database Syst Rev. 2017. PMID: 28990665 Free PMC article.
-
Signs and symptoms to determine if a patient presenting in primary care or hospital outpatient settings has COVID-19.Cochrane Database Syst Rev. 2022 May 20;5(5):CD013665. doi: 10.1002/14651858.CD013665.pub3. Cochrane Database Syst Rev. 2022. PMID: 35593186 Free PMC article.
-
Antibody tests for identification of current and past infection with SARS-CoV-2.Cochrane Database Syst Rev. 2022 Nov 17;11(11):CD013652. doi: 10.1002/14651858.CD013652.pub2. Cochrane Database Syst Rev. 2022. PMID: 36394900 Free PMC article.
References
-
- Barbosa A. I., Barreto A. S., Reis N. M.. Transparent, Hydrophobic Fluorinated Ethylene Propylene Offers Rapid, Robust, and Irreversible Passive Adsorption of Diagnostic Antibodies for Sensitive Optical Biosensing. ACS Appl. Bio Mater. 2019;2(7):2780–2790. doi: 10.1021/acsabm.9b00214. - DOI - PubMed
-
- Deshpande, S. S. Enzyme Immunoassays; Chapman & Hall: New York, 1996.
-
- Davies, C. Introduction to Immunoassay Principles. In The Immunoassay Handbook, Wild, D. , Eds.; Elsevier Ltd: Oxford, 2001; pp. 19-26.
-
- Elghajiji A., Wang X., Weston S. D., Zeck G., Hengerer B., Tosh D., Rocha P. R. F.. Electrochemical Impedance Spectroscopy as a Tool for Monitoring Cell Differentiation from Floor Plate Progenitors to Midbrain Neurons in Real Time. Adv. Biol. 2021;5(6):2100330. doi: 10.1002/adbi.202100330. - DOI - PubMed
MeSH terms
Substances
LinkOut - more resources
Full Text Sources
