. 2025 Jun 14;12(1):2518773.
doi: 10.1080/23723556.2025.2518773. eCollection 2025.

GSTP1 knockdown induces metabolic changes affecting energy production and lipid balance in pancreatic cancer cells

Affiliations

GSTP1 knockdown induces metabolic changes affecting energy production and lipid balance in pancreatic cancer cells

Jenna N Duttenhefner et al. Mol Cell Oncol. .

Abstract

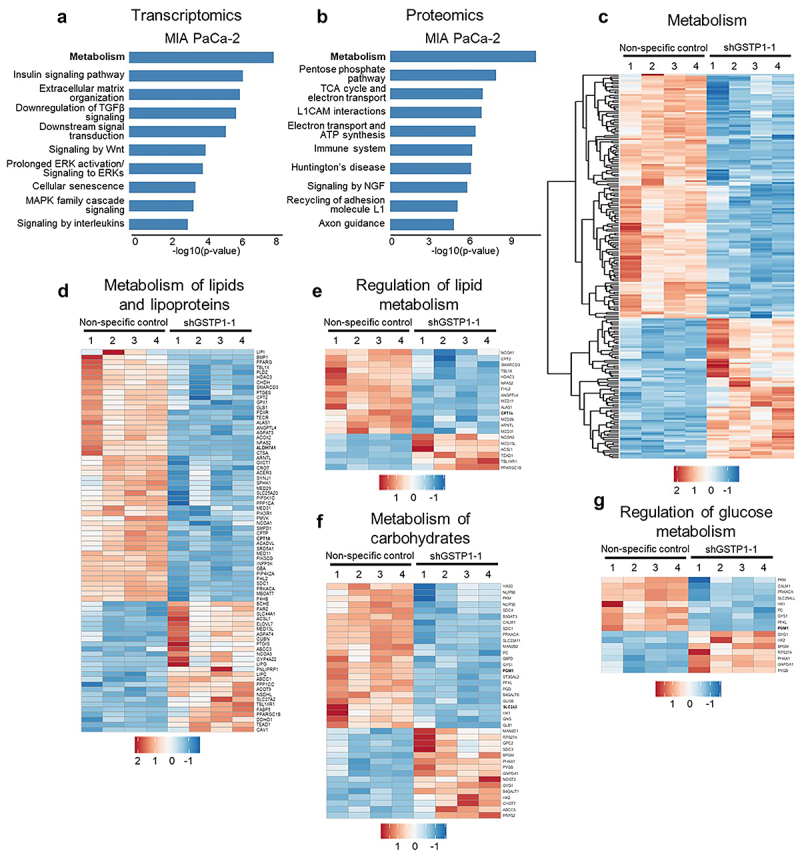
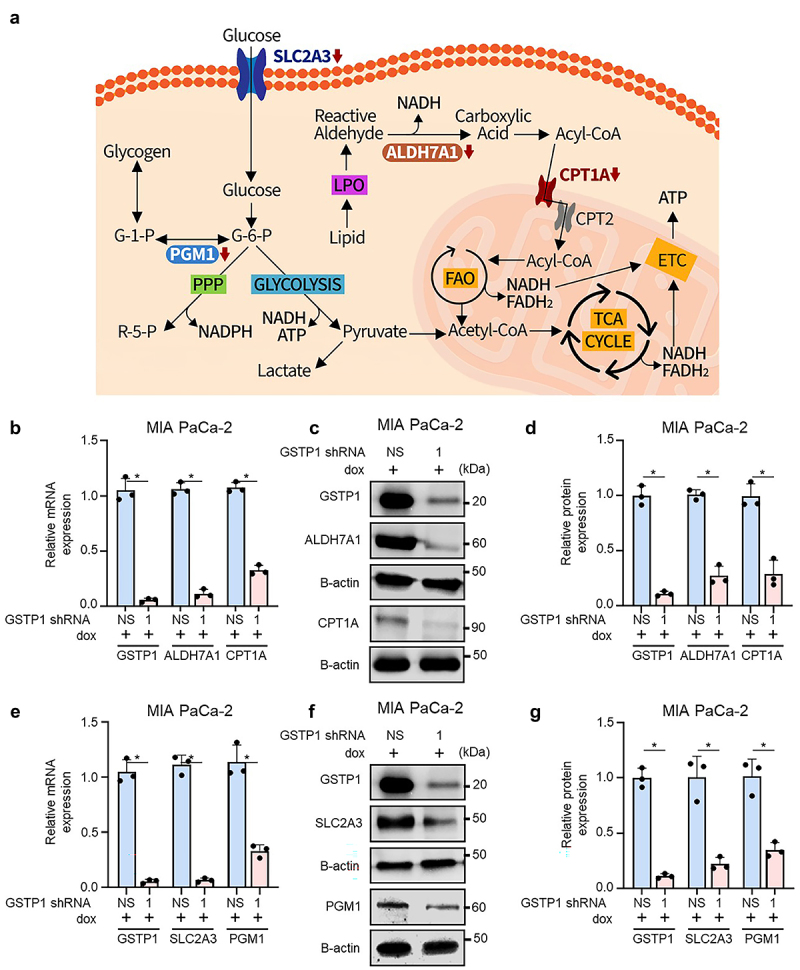
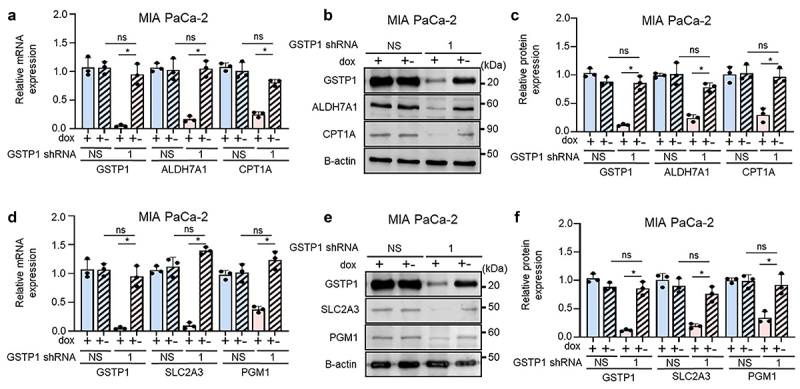
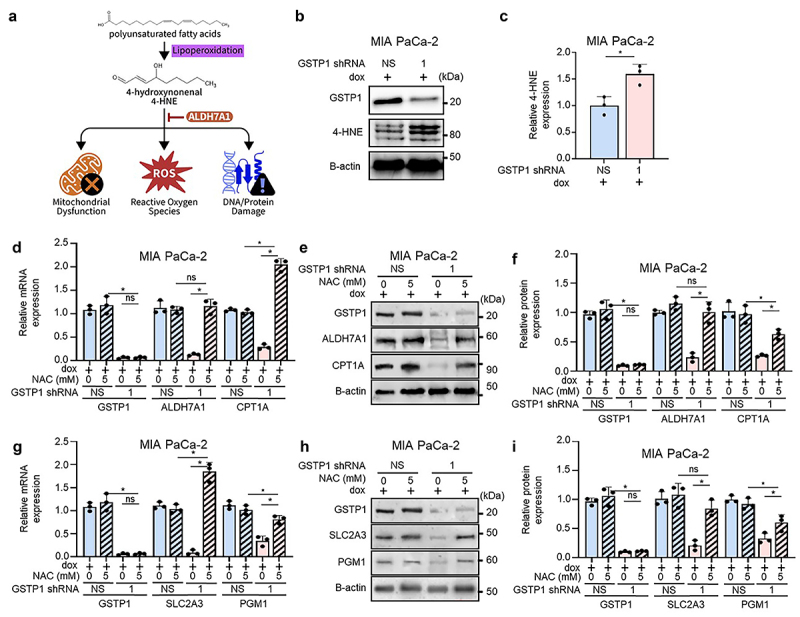
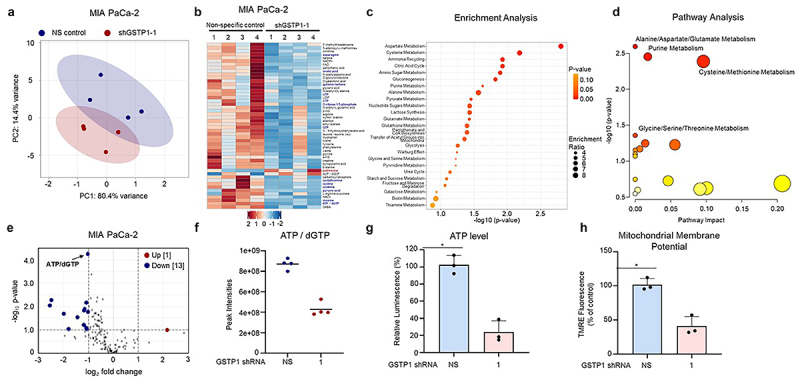
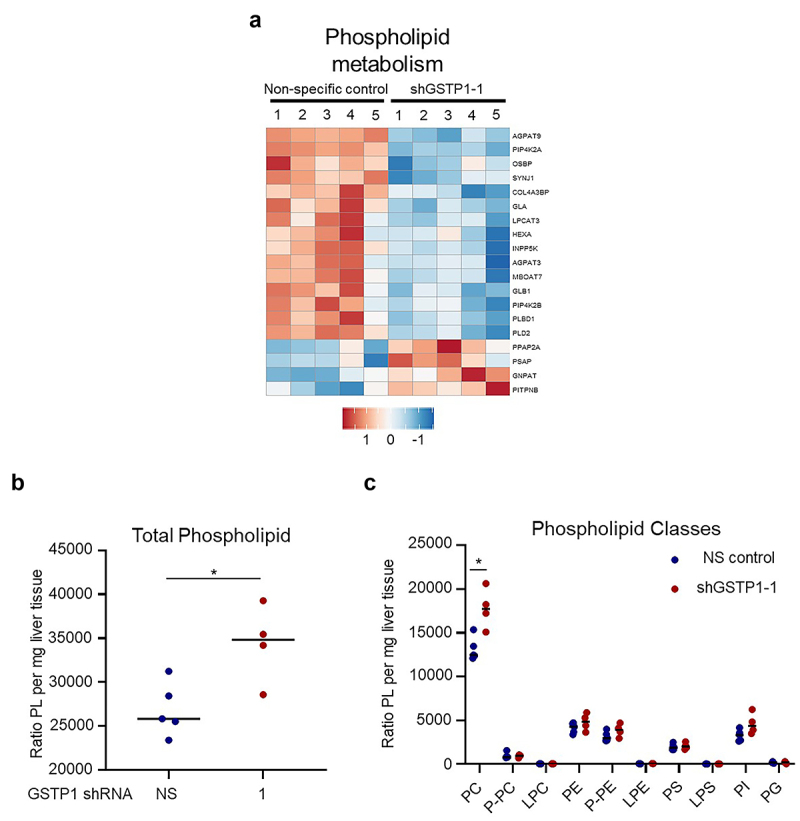
Pancreatic ductal adenocarcinoma (PDAC) is an aggressive cancer with limited treatment options, underscoring the need for novel therapeutic targets. Metabolic reprogramming is a hallmark of PDAC, enabling tumor cells to sustain rapid proliferation and survive under nutrient-deprived conditions. While glutathione S-transferase pi 1 (GSTP1) is a known regulator of redox homeostasis in PDAC, its role in metabolic adaptation remains unclear. Here, we show that GSTP1 knockdown disrupts PDAC metabolism, leading to downregulation of key metabolic enzymes (ALDH7A1, CPT1A, SLC2A3, PGM1), ATP depletion, mitochondrial dysfunction, and phospholipid remodeling. Phospholipid remodeling, including an increase in phosphatidylcholine (PC) levels, further suggests a compensatory response to metabolic stress. Importantly, GSTP1 knockdown led to elevated lipid peroxidation, increasing 4-hydroxynonenal (4-HNE) accumulation. Treatment with the antioxidant N-acetyl cysteine (NAC) partially restored metabolic gene expression, reinforcing GSTP1's role in the interplay between redox regulation and metabolism in PDAC. By disrupting multiple metabolic pathways, GSTP1 depletion creates potential therapeutic vulnerabilities that could be targeted through metabolic and oxidative stress-inducing therapies to enhance treatment efficacy.

Keywords: Pancreatic ductal adenocarcinoma; glutathione S-transferase pi 1 (GSTP1); metabolic reprogramming; metabolomics; therapeutic targeting.


Conflict of interest statement

No potential conflicts of interest were disclosed.

Figures

Figure 1.
Figure 1.
GSTP1 knockdown disrupts core metabolic pathways in PDAC cells. (a-b) comparative transcriptomic and proteomic analysis identified metabolism as the most dysregulated pathway following GSTP1 knockdown in MIA PaCa-2 cells (n = 4). (c) Pathway enrichment analysis reveals significant alterations in cellular metabolism, including glycolysis, oxidative phosphorylation, the pentose phosphate pathway, and the TCA cycle. (d) Lipid metabolism is significantly disrupted, with downregulation of genes associated with lipid and lipoprotein metabolism and (e) regulation of lipid metabolism, (f) carbohydrate metabolism is also affected with dysregulated expression of (f) key regulators of glucose metabolism identified through RNA-Seq. Blue indicates downregulated genes in GSTP1 knockdown (shGSTP1–1) MIA PaCa-2 cells compared to the nonspecific control, while red indicates upregulated genes.
Figure 2.
Figure 2.
GSTP1 knockdown reduces the expression of key metabolic regulators. (a) Schematic representation of ALDH7A1, CPT1A, SLC2A3, and PGM1, highlighting their roles in lipid and carbohydrate metabolism. (b) qRT-PCR expression analysis shows significant reductions in ALDH7A1 and CPT1A mRNA expression in MIA PaCa-2 cells following GSTP1 knockdown (shRNA-1) compared to the nonspecific control (shRNA-NS). (c-d) western blot validation confirms decreased ALDH7A1 and CPT1A protein levels. (e) SLC2A3 and PGM1 mRNA expression is significantly downregulated upon GSTP1 loss. (f-g) western blot analysis confirms the downregulation of SLC2A3 and PGM1 proteins. The figures shown are indicative of three separate experiments (n = 3). To assess the statistical significance of expression differences between groups, the Student’s t-test was employed. Statistically significant variations between GSTP1 knockdown and the control group are indicated by an asterisk (*), with a p-value less than 0.05.
Figure 3.
Figure 3.
GSTP1 restoration reverses metabolic dysregulation in PDAC cells. (a) qRT-PCR demonstrates the recovery of ALDH7A1 and CPT1A mRNA levels following GSTP1 re-expression (dox ±). (b-c) western blot analysis confirms partial restoration of ALDH7A1 and CPT1A protein levels after GSTP1 restoration. (d) SLC2A3 and PGM1 mRNA levels are significantly recovered following GSTP1 restoration. (e-f) western blot confirmation of SLC2A3 and PGM1 protein recovery to varying degrees. Expression levels were compared between 120 hour NS recovery (NS ±) and 120 hour shGSTP1–1 recovery (shGSTP1–1 ±) as well as between shGSTP1–1 + and shGSTP1–1 recovery (shGSTP1 ±). Representative results from three independent experiments in MIA PaCa-2 cells are shown (n = 3). Statistical analysis was determined using the student’s t-test, with an asterisk (*) indicating significant differences (p < .05) between GSTP1 knockdown and control conditions.
Figure 4.
Figure 4.
GSTP1 knockdown increases 4-HNE accumulation while antioxidant treatment partially restores metabolic gene expression. (a) Schematic representation of 4-HNE accumulation and its detrimental effects on mitochondrial function, ROS generation, and cellular damage. (b-c) western blot analysis shows a significant increase in 4-HNE expression following GSTP1 knockdown in MIA PaCa-2 cells, indicating elevated lipid peroxidation. (d) N-acetyl cysteine (NAC) treatment (48 hours, 5 mm) restores ALDH7A1 and CPT1A mRNA expression. (e-f) western blot validation of NAC-mediated partial recovery of ALDH7A1 and CPT1A protein levels. (g) SLC2A3 mRNA is restored with NAC treatment, though PGM1 recovery is less pronounced at both the mRNA and protein levels. (h-i) western blot analysis assessing NAC’s partial recovery effects on SLC2A3 and PGM1 protein levels. Expression levels were compared between NAC-treated NS control (NS 5 mm) and GSTP1–1 knockdown NAC-treated (shGSTP1–1 5 mm) as well as between untreated (0 mm) shGSTP1–1 and NAC-treated (5 mm) shGSTP1–1 conditions. Representative results from three independent experiments are shown (n = 3). Statistical analysis was determined using the student’s t-test, with an asterisk (*) indicating p < .05 between GSTP1 knockdown and control conditions.
Figure 5.
Figure 5.
GSTP1 knockdown reduces ATP levels and disrupts mitochondrial function. (a) Principal component analysis (PCA) of metabolic profiles reveals distinct metabolic shifts between GSTP1 knockdown and control MIA PaCa-2 cells. (b) Heatmap of the top 50 differentially expressed metabolites highlights widespread metabolic suppression following GSTP1 knockdown. Blue color represents downregulation, while red color represents upregulation between NS control and GSTP1 knockdown cells (shGSTP1–1) (c) metabolite set enrichment analysis using the small molecule pathway database (SMPDB) shows the top 25 enriched pathways. (d) KEGG-based metabolic pathway analysis incorporated both enrichment and topology (impact) scores; pathways with p < .05 are labeled. In both plots, circle size indicates pathway impact and color intensity reflects statistical significance. Analyses were performed in MetaboAnalyst 6.0. (e-f) ATP/dGTP levels are significantly reduced (2.0-fold) in GSTP1 knockdown cells as determined by LC-MS and (g) a 4.3-fold decrease in ATP confirmed by CellTiter-Glo luminescence assays. (h) TMRE staining reveals a significant reduction in mitochondrial membrane potential, confirming mitochondrial dysfunction. Data are presented as representative results from three independent experiments (n = 3). Statistical significance was assessed using the student’s t-test, with * denoting a significant difference (p < .05) between GSTP1 knockdown and control conditions.
Figure 6.
Figure 6.
GSTP1 knockdown alters phospholipid metabolism in PDAC cells. (a) Proteomic pathway analysis identifies differential expression of proteins involved in phospholipid metabolism following GSTP1 depletion. Blue indicates downregulation and red indicates upregulation. (b) Total phospholipid content significantly increases in GSTP1-knockdown cells, suggesting compensatory lipid remodeling. (c) Phosphatidylcholine (PC) levels are elevated in GSTP1 knockdown cells, potentially reflecting oxidative stress-driven lipid alterations. Data are presented as representative results from 5 independent samples of NS control and shGSTP1–1 MIA PaCa-2 cells (n = 5). Statistical significance was determined using the student’s t-test, with * indicating a significant difference (p < .05) between GSTP1 knockdown and control conditions. Abbreviations: phosphatidylcholine (PC), plasmenyl phosphatidylcholine (P-PC), lyso-phosphatidylcholine (LPC), phosphatidylethanolamine (PE), plasmenyl phosphatidylethanolamine (P-PE), lyso-phosphatidylethanolamine (LPE), phosphatidylserine (PS), lyso-phosphatidylserine (LPS), phosphatidylinositol (PI), and phosphatidylglycerol (PG).

Similar articles

References

    1. Hanahan D, Weinberg RA.. Hallmarks of cancer: the next generation. Cell. 2011;144(5):646–17. doi: 10.1016/j.cell.2011.02.013. - DOI - PubMed
    1. Qin C, Yang G, Yang J, Ren B, Wang H, Chen G, Zhao F, You L, Wang W, Zhao Y, et al. Metabolism of pancreatic cancer: paving the way to better anticancer strategies. Mol Cancer. 2020;19(1):50. doi: 10.1186/s12943-020-01169-7. - DOI - PMC - PubMed
    1. Aldyab M, El Jabbour T, Parilla M, Lee H. Benign vs malignant pancreatic lesions: molecular insights to an ongoing debate. World J Gastrointest Surg. 2021;13(5):406–418. doi: 10.4240/wjgs.v13.i5.406. - DOI - PMC - PubMed
    1. Padinharayil H, Rai V, George A. Mitochondrial metabolism in pancreatic ductal adenocarcinoma: from mechanism-based perspectives to therapy. Cancers. 2023;15(4):1070. doi: 10.3390/cancers15041070. - DOI - PMC - PubMed
    1. Carmona-Carmona CA, Dalla Pozza E, Ambrosini G, Errico A, Dando I. Divergent roles of mitochondria dynamics in pancreatic ductal adenocarcinoma. Cancers. 2022;14(9):2155. doi: 10.3390/cancers14092155. - DOI - PMC - PubMed

LinkOut - more resources