. 2025 May 14;5(4):100383.
doi: 10.1016/j.xjidi.2025.100383. eCollection 2025 Jul.

Development of Human Skin Equivalents with Inducible Ceramide Depletion for In Vitro Modeling of Lipid Impairment

Affiliations

Development of Human Skin Equivalents with Inducible Ceramide Depletion for In Vitro Modeling of Lipid Impairment

Durotimi O Dina et al. JID Innov. .

Abstract

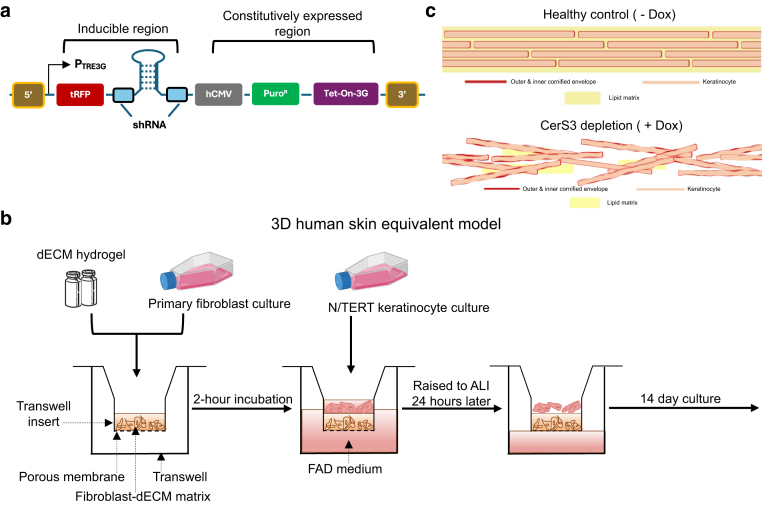
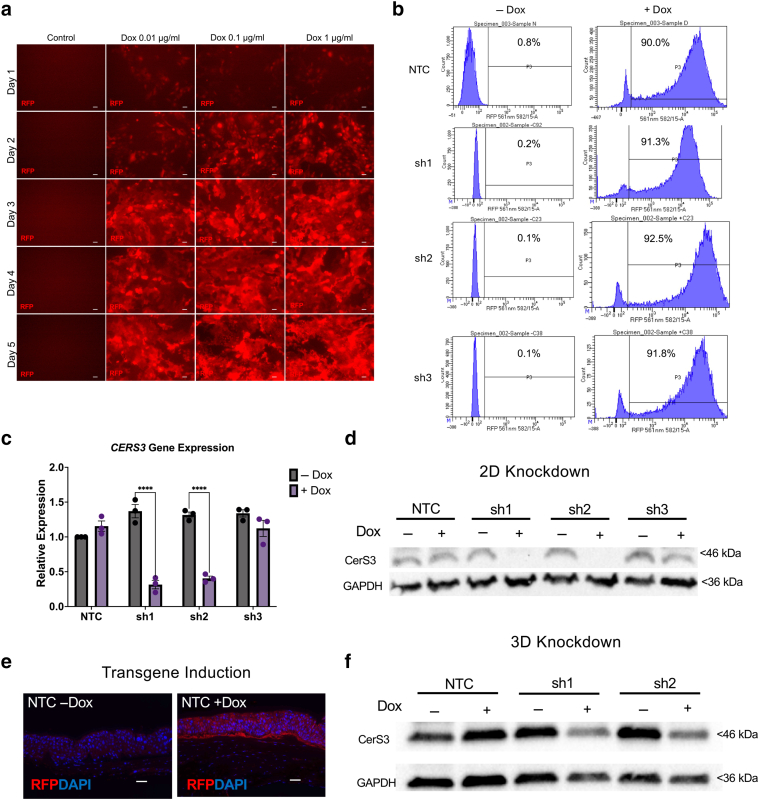
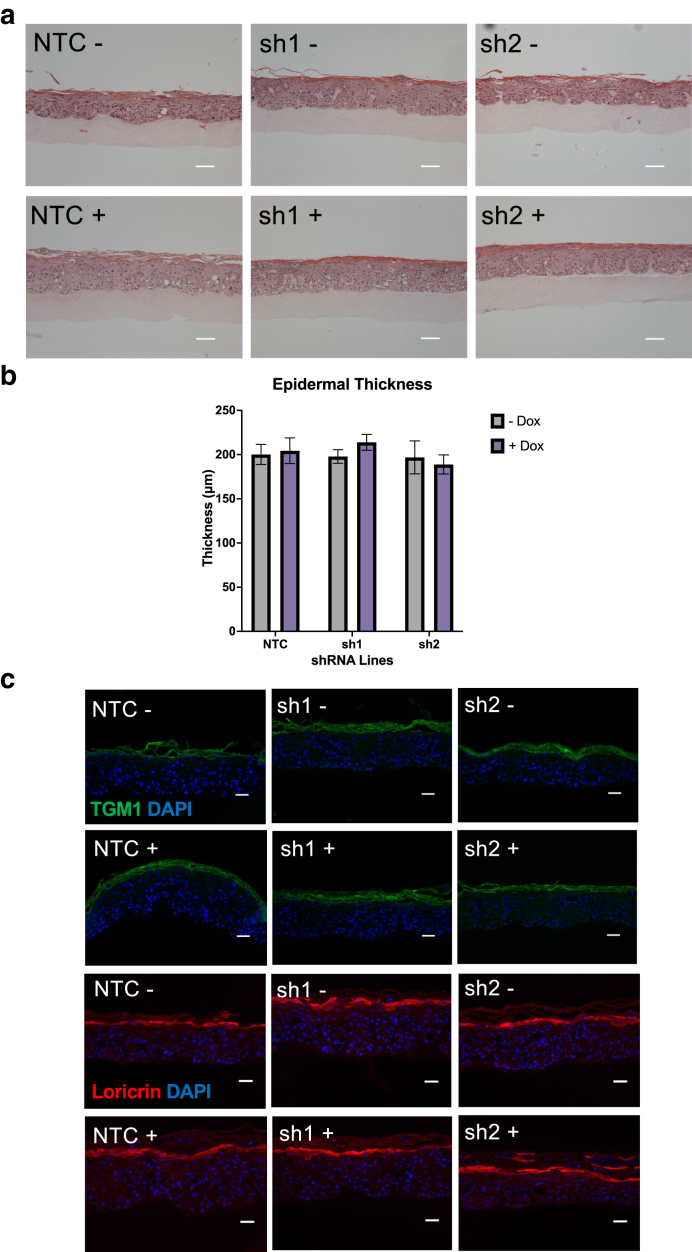
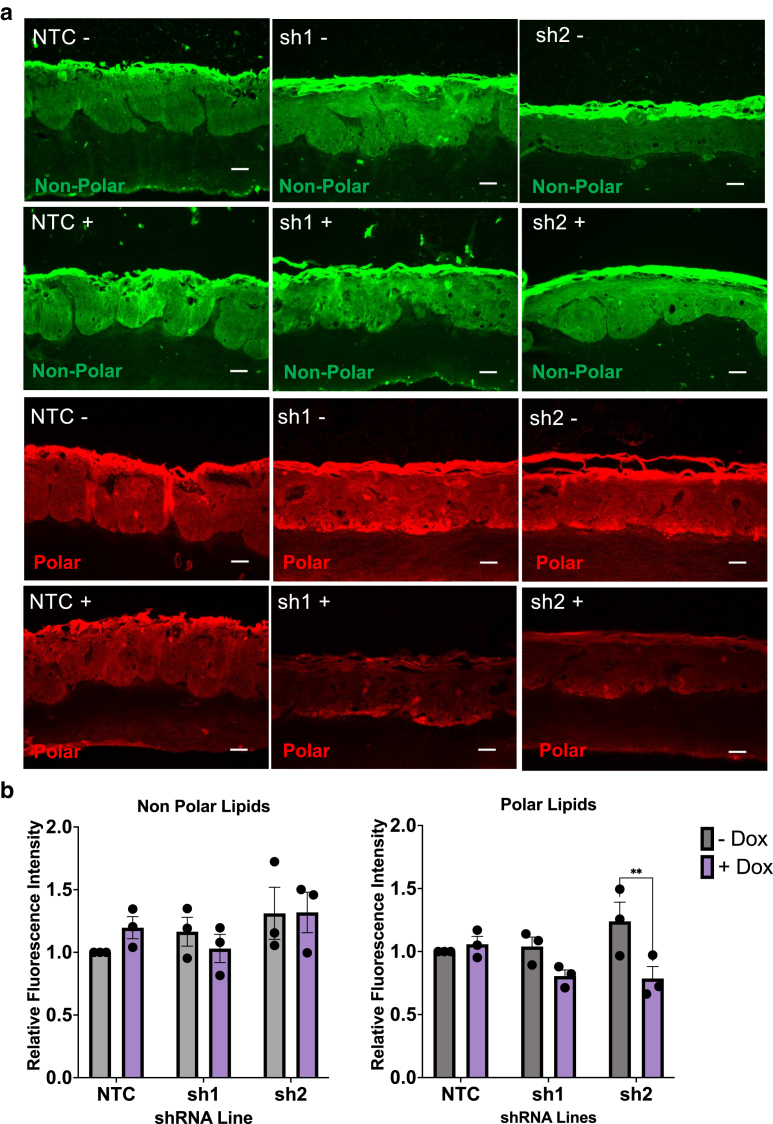
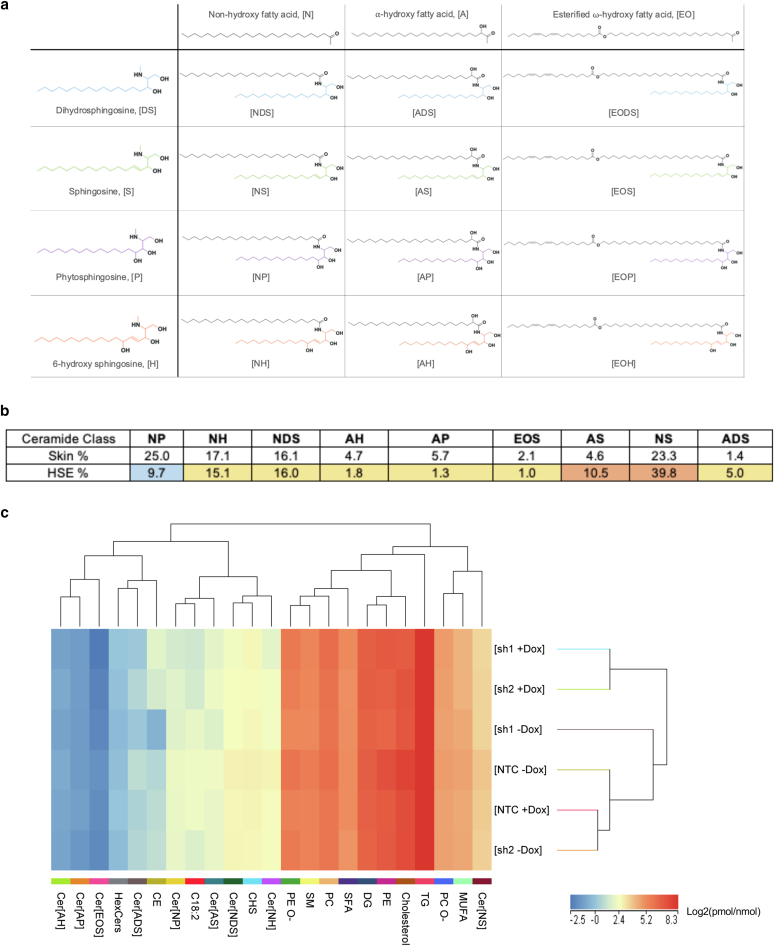
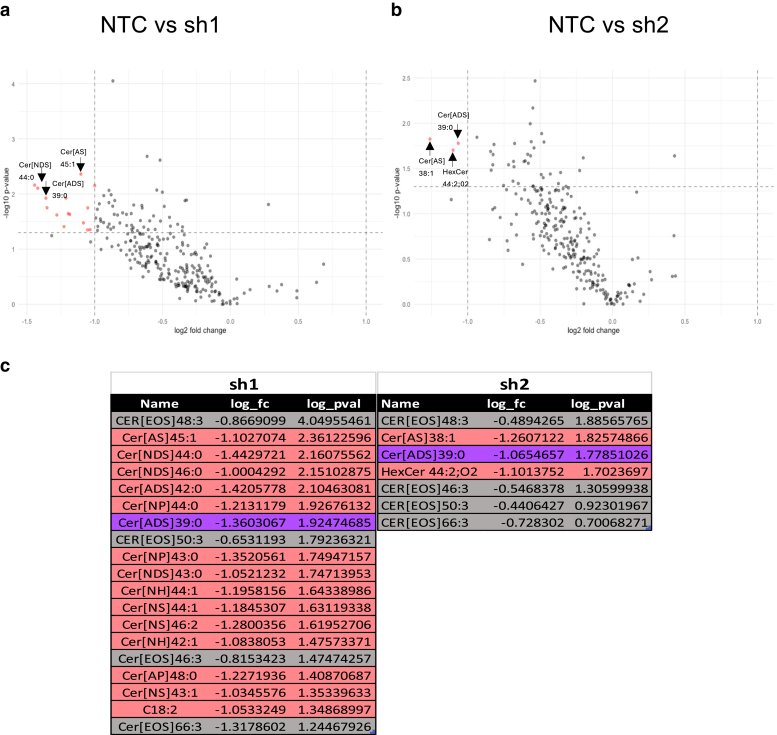
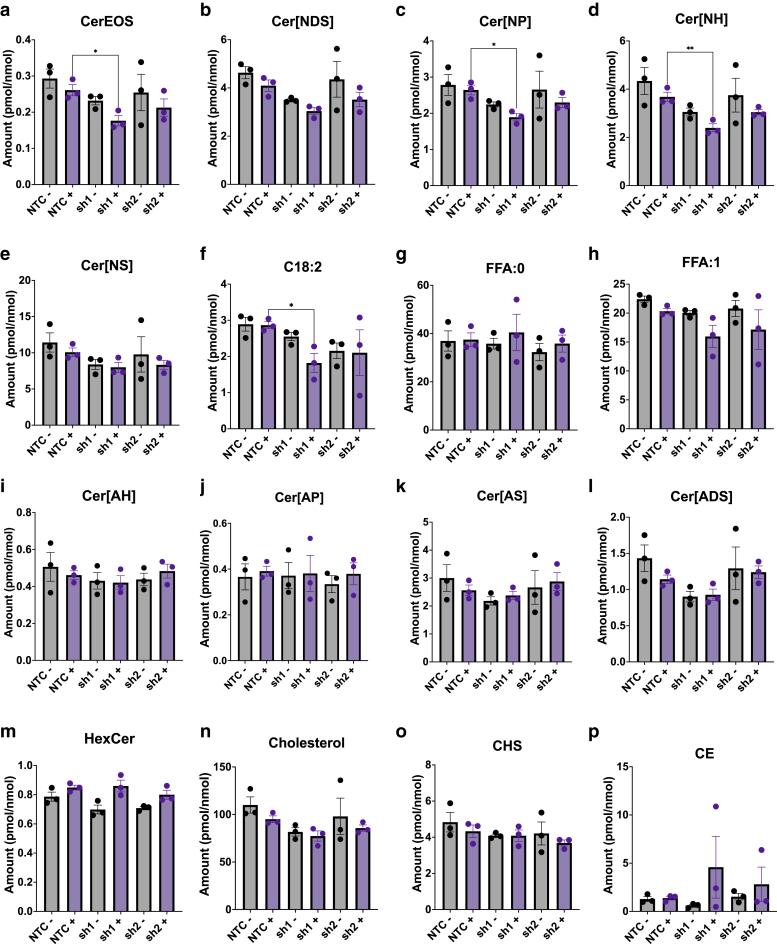
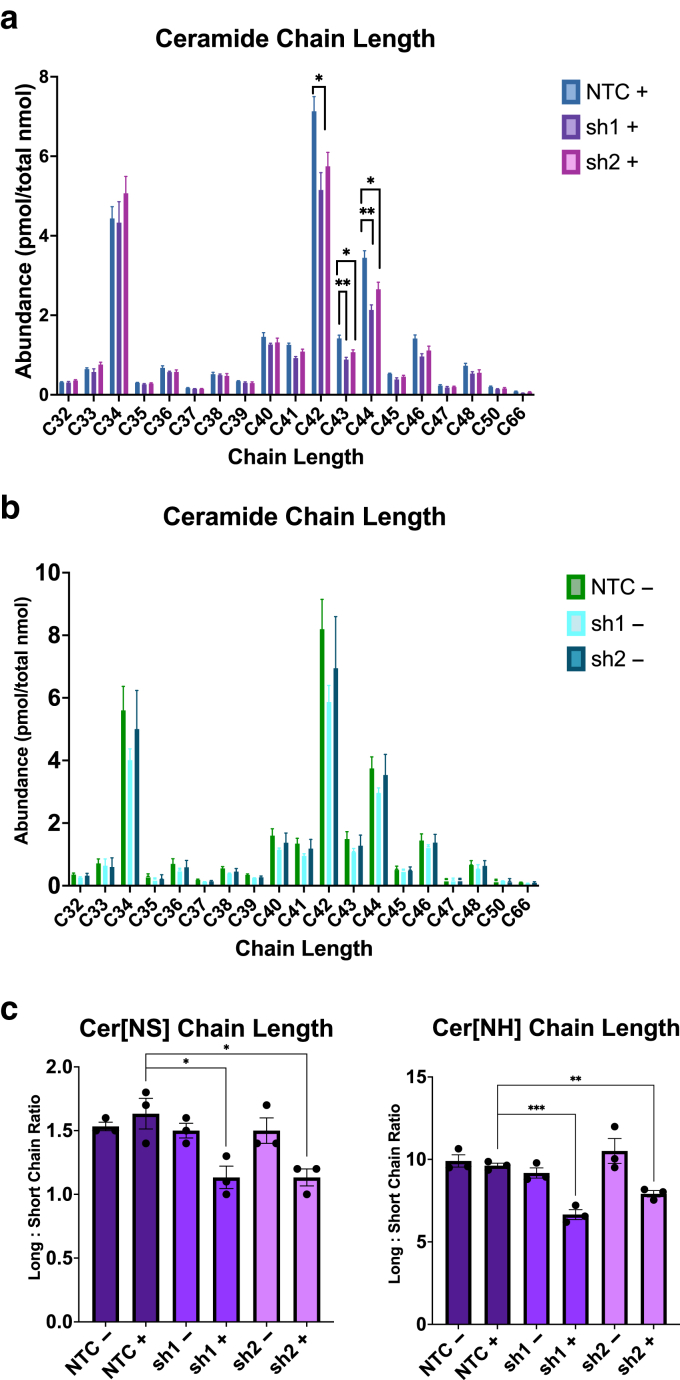
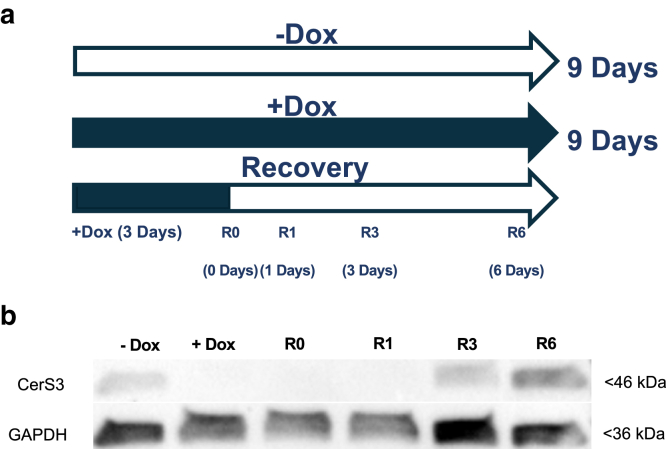
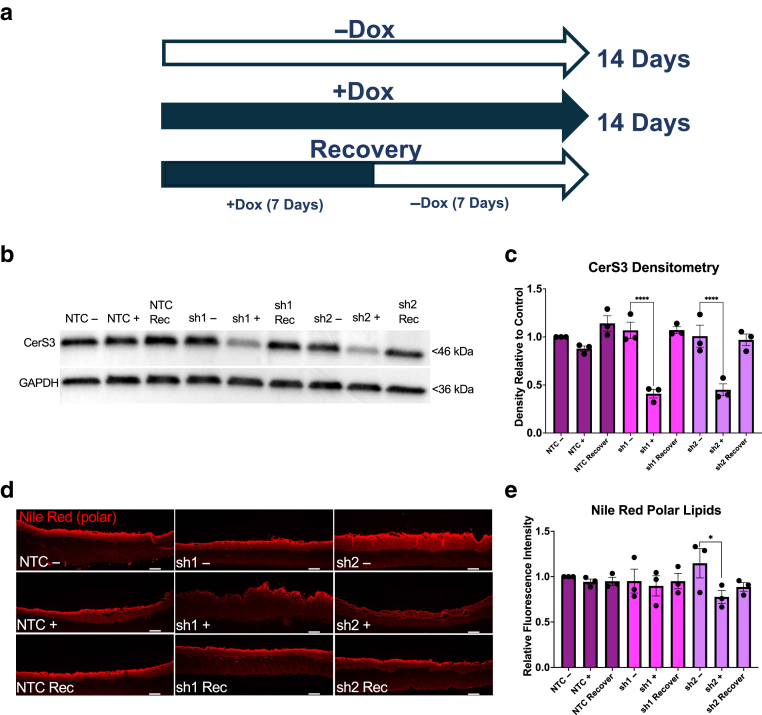
The lipid composition of the epidermis plays a critical role in the skin's barrier function, and defects in lipid synthesis or assembly can cause a spectrum of skin diseases, ranging from dry skin to severe ichthyoses. The aim of this study was to develop an in vitro model of human skin with tunable inhibition of lipid synthesis. Human N/TERT keratinocytes were engineered to express doxycycline-inducible short hairpin RNAs targeting ceramide synthase 3, which is essential for synthesis of ultralong-chain ceramides and skin barrier function. We show that 3-dimensional human skin equivalents with induced knockdown of ceramide synthase 3 display normal stratification and terminal differentiation but have reduced Nile red staining for polar lipids. Further analysis of the lipidome by mass spectrometry confirmed a significant reduction in specific classes of ceramides and ceramide chain length in the ceramide synthase 3-depleted human skin equivalents. We also show that ceramide synthase 3 knockdown is reversible upon removal of doxycycline and can be used to study recovery and repair of epidermal lipids. Together, these findings provide an overall strategy for genetically regulating the lipid composition within human skin models and establish a tunable in vitro model of ceramide deficiency.

Keywords: 3D model; Barrier function; CERS3; Ceramide; Lipidomics; Skin.


Figures

Figure 1
Figure 1
Development of HSEs with inducible CerS3 knockdown. (a) Schematic of the shRNA lentiviral construct (SMARTvector, Horizon Discovery). The constitutively expressed region under the control of the human cytomegalovirus promoter included elements for expression of the Tet-On-3D transactivator and puromycin resistance, whereas the inducible region contained the shRNA element and tRFP reporter under the control of the TRE3G promoter that is activated by Dox. (b) Schematic overview of the process for constructing 3D dECM HSEs at the ALI of Transwell inserts. (c) Schematic of expected disruption of epidermal lipids after addition of Dox (+Dox) and knockdown of CerS3. 3D, 3-dimensional; ALI, air–liquid interface; CerS3, ceramide synthase 3; dECM, decellularized extracellular matrix; Dox, doxycycline; HSE, human skin equivalent; shRNA, short hairpin RNA.
Figure 2
Figure 2
Characterization of CerS3 knockdown in 2D and 3D culture. (a) RFP fluorescence imaging in N/TERT keratinocytes transduced with NTC shRNA and treated with 0, 0.01, 0.1, or 1 μg/ml of Dox for a period of 6 days. Images are representative of n = 3 experiments. Bar = 50 μm. (b) Flow cytometry for RFP reporter expression across NTC and shRNA knockdown cell lines (sh1, sh2, and sh3) in 2D culture without or with 0.1 μg/ml Dox treatment for 7 days. Percentage of RFP-positive cells are noted for each condition. (c) Analysis of CERS3 knockdown in 2D culture by RT-qPCR. Data represent fold change in expression (2-ΔΔCt method) relative to that of GAPDH and untreated NTC cells for the shRNA-transduced N/TERT lines without or with Dox treatment (0.1 mg/ml) for 7 days. Data are presented as mean ± SEM. ∗∗∗∗P < .0001 with 2-way ANOVA and Tukey’s multiple comparison test. n = 3 experiments. (d) Representative western blot for CerS3 and GAPDH expression for all cell lines in 2D culture without or with Dox treatment for 7 days. (e) Immunofluorescence staining for the inducible tRFP reporter (red) in HSEs constructed with NTC keratinocytes without or with Dox treatment for 14 days. Bar = 50 μm. (f) Representative western blot for CerS3 and GAPDH in HSEs constructed with NTC, sh1, and sh2 cell lines and cultured without or with Dox for 14 days. 2D, 2-dimensional; 3D, 3-dimensional; CerS3, ceramide synthase 3; Dox, doxycycline; HSE, human skin equivalent; NTC, nontargeting control; shRNA, short hairpin RNA.
Figure 3
Figure 3
Analysis of stratification and terminal differentiation in 3D HSEs. (a) Representative images of H&E staining for HSEs constructed with NTC, sh1, or sh2 keratinocytes without or with Dox treatment (0.1 mg/ml) for 14 days. Bar = 100 μm. (b) Quantification of epidermal thicknesses using H&E images from HSEs constructed with NTC, sh1, and sh2 lines and without or with doxycycline treatment for 14 days. Data represent the mean ± SEM of 3 technical replicates, and n = 3 independent experiments. No significant differences were determined by 2-way ANOVA. Immunofluorescence staining for (c) TGM1 and (d) loricrin, counterstained with DAPI. Bar = 20 μm. 3D, 3-dimensional; Dox, doxycycline; HSE, human skin equivalent; NTC, nontargeting control.
Figure 4
Figure 4
Analysis of lipid content in 3D HSEs. (a) Representative images of nonpolar (green) and polar (red) lipid staining using Nile red, for HSEs constructed with NTC, sh1, or sh2 keratinocytes without or with Dox treatment (0.1 mg/ml) for 14 days. Bar = 50 μm. (b) Quantification of Nile red fluorescence intensity for nonpolar (left panel) and polar (right panel) signals for all cell lines without or with Dox treatment. Data represent the mean ± SEM normalized to the untreated NTC HSEs. ∗∗P < .01 with 2-way ANOVA and Tukey’s multiple comparison test. n = 3 experiments. 3D, 3-dimensional; Dox, doxycycline; HSE, human skin equivalent; NTC, nontargeting control.
Figure 5
Figure 5
Lipidomic composition and clustering in HSE models. (a) Summary of free ceramide structures and naming conventions, adapted from Van Smeden et al (2014). (b) Comparison of the percentage of different ceramide classes out of the total ceramide content between the epidermis of human skin and HSE models constructed with NTC keratinocytes. Yellow = within 5% of human skin, red = higher in the HSE, and blue = lower in the HSE. Data represent the mean of n = 3 HSEs from independent experiments. (c) Heat map and hierarchical clustering of lipid classes (263 identified lipid species) and experimental conditions, NTC, sh1, and sh2 (without and with doxycycline 0.1 mg/ml), against lipid class groupings of ceramides Cer[NS], Cer[NH, Cer[NDS], Cer[AS], Cer[NP], Cer[ADS], Cer[AP], Cer[AH], Cer[EOS], MUFAs, SFAs, PC, PE, DGs, TGs, cholesterol, SM, CHSs, linoleic acid (C18:2), CEs, and HexCers. n = 3 experiments. Data represent log2 transformed levels of each lipid class (pmol) relative to total lipid content (nmol). CE, cholesterol ester; CHS, cholesterol sulphate; DG, diglyceride; HexCer, hexosylceramide; HSE, human skin equivalent; MUFA, monounsaturated fatty acid; NTC, nontargeting control; PC, phosphatidyl choline; PE, phosphatidylethanolamine; SFA, saturated fatty acid; SM, sphingomyelin; TG, triglyceride.
Figure 6
Figure 6
Downregulation of individual lipid species in CerS3 knockdown model. (a, b) Volcano plot showing log2 fold change and −log10P-value (unpaired t-test) for all the annotated lipids detected in the HSE models comparing (a) NTC + Dox with sh1 + Dox and (b) NTC + Dox with sh2 + Dox. (c) Table summary of annotated lipid species, the total carbon chain length of the LCB and FA saturation state. Highlighted in red are those that met the significance criteria, and those that were found in both the sh1 and sh2 knockdown models are highlighted in purple. The acylceramides detected (highlighted in gray) are included even though they did not meet the significance criteria of this analysis. CerS3, ceramide synthase 3; Dox, doxycycline; FA, fatty acid; HSE, human skin equivalent; LCB, long-chain base; NTC, nontargeting control.
Figure 7
Figure 7
Effects on CerS3 depletion on lipid classes. Analysis of molar lipid content grouped by different classes, including (a) Cer[EOS], (b) Cer[NDS], (c) Cer[NP], (d) Cer[NH], (e) Cer[NS], (f) linoleic acid (C18:2), (g) saturated fatty acids (FFA:0), (h) monounsaturated fatty acids (FFA:1), (i) Cer[AH], (j) Cer[AP], (k) Cer[AS], (l)Cer[ADS], (m) HexCer, (n) cholesterol, (o) CHS, and (p) CE. Data are represented as mean ± SEM of pmol of lipid class per nmol of total lipid content. ∗P < .05 with 2-way ANOVA and Tukey’s multiple comparison test. n = 3 experiments. CE, cholesterol ester; CerS3, ceramide synthase 3; CHS, cholesterol sulphate; FFA, free fatty acid.
Figure 8
Figure 8
Effects of CerS3 depletion on ceramide chain length in HSE models. (a) Analysis of ceramide chain length in Dox-treated NTC, sh1, and sh2 HSEs and (b) untreated HSEs. Data represent the abundance of ceramides with 32–66 carbons and are represented as mean ± SEM. ∗∗P < .01 and ∗P < .05 with 1-way ANOVA with Tukey’s multiple comparison test. n = 3 experiments. (c) Molar ratio of long-chain ceramides (>40 carbons) to shorter-chain ceramides (<40 carbons) for the most significantly downregulated classes Cer[NS] and Cer[NH]. Data represent the mean ± SEM. ∗P < .05, ∗∗P < .01, and ∗∗∗P < .001 with 2-way ANOVA with Tukey’s multiple comparison test. n = 3 experiments. CerS3, ceramide synthase 3; Dox, doxycycline; HSE, human skin equivalent; NTC, nontargeting control.
Figure 9
Figure 9
Analysis of CerS3 recovery kinetics in 2D culture. (a) The 2D knockdown recovery experiment culture timeline. The experiment consisted of a −Dox and a +Dox condition for 9 days, plus 4 independent recovery conditions where cells were treated with Dox for 3 days followed by sample collection 0, 1, 3, and 6 days after removal of Dox (R0, R1, R3, and R6). (b) Representative western blot for CerS3 and GAPDH for the 2 controls and 4 recovery time points. 2D, 2-dimensional; CerS3, ceramide synthase 3; Dox, doxycycline.
Figure 10
Figure 10
Analysis of CerS3 and lipid restoration in a recovery model. (a) Schematic of 14-day experimental timeline for 3D recovery model, including untreated control (14 days −Dox), sustained knockdown (14 days +Dox), and recovery (7 days +Dox followed by 7 days −Dox). (b) Representative western blot of CerS3 and GAPDH expression in untreated controls, knockdown, and recovery (denoted as Rec) conditions for NTC, sh1, and sh2 HSEs. (c) Quantification of CerS3 protein levels relative to GAPDH and normalized to NTC untreated controls (−Dox). Data are presented as mean ± SEM. ∗∗∗∗P < .0001 with 2-way ANOVA and Tukey’s multiple comparison test. n = 3 experiments. (d) Representative fluorescence images of polar lipids detected with Nile red staining in untreated controls, knockdown, and recovery (denoted as Rec) conditions for NTC, sh1, and sh2 HSEs. Bar = 100 μm. (e) Quantification of Nile red fluorescence intensity normalized to NTC untreated controls. Data are represented as mean ± SEM. ∗P < .05 with 2-way ANOVA and Tukey’s multiple comparison test. n = 3 experiments. 3D, 3-dimensional; CerS3, ceramide synthase 3; Dox, doxycycline; HSE, human skin equivalent; NTC, nontargeting control.

Similar articles

References

    1. Akiyama M. Corneocyte lipid envelope (CLE), the key structure for skin barrier function and ichthyosis pathogenesis. J Dermatol Sci. 2017;88:3–9. - PubMed
    1. Baron U., Bujard H. Tet repressor-based system for regulated gene expression in eukaryotic cells: principles and advances. Methods Enzymol. 2000;327:401–421. - PubMed
    1. Behne M., Uchida Y., Seki T., de Montellano P.O., Elias P.M., Holleran W.M. Omega-hydroxyceramides are required for corneocyte lipid envelope (CLE) formation and normal epidermal permeability barrier function. J Invest Dermatol. 2000;114:185–192. - PubMed
    1. Bligh E.G., Dyer W.J. A rapid method of total lipid extraction and purification. Can J Biochem Physiol. 1959;37:911–917. - PubMed
    1. Bouwstra J., Pilgram G., Gooris G., Koerten H., Ponec M. New aspects of the skin barrier organization. Skin Pharmacol Appl Skin Physiol. 2001;14(Suppl 1):52–62. - PubMed

LinkOut - more resources