

Intravoxel Incoherent Motion Improves the Accuracy of Preoperative Prediction of Vessels Encapsulating Tumor Clusters in Hepatocellular Carcinoma
- PMID: 40524872
- PMCID: PMC12168965
- DOI: 10.2147/JHC.S519223
Intravoxel Incoherent Motion Improves the Accuracy of Preoperative Prediction of Vessels Encapsulating Tumor Clusters in Hepatocellular Carcinoma
Abstract
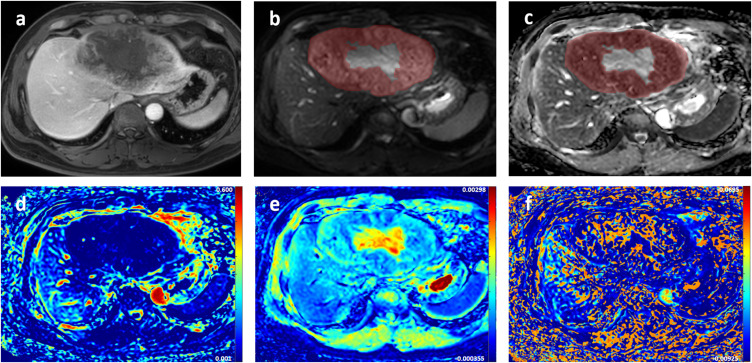
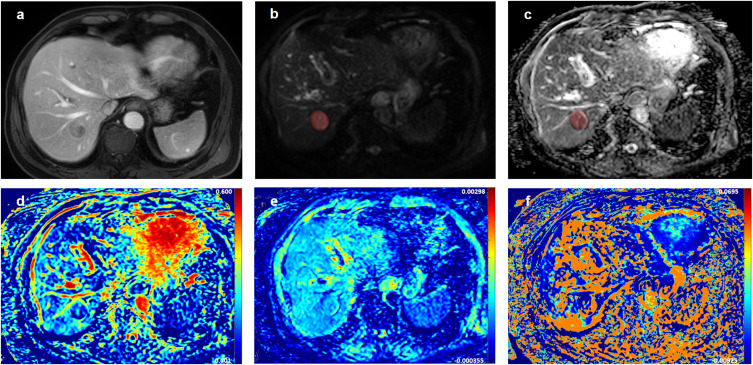
Purpose: Hepatocellular carcinoma (HCC) with vessels encapsulating tumor clusters (VETC) pattern presents a higher risk of recurrence and metastasis, and the unique vascular structure of the VETC pattern may affect the perfusion and diffusion, and the effect that can be captured by intravoxel incoherent motion (IVIM). Therefore, this study used preoperative IVIM to predict VETC pattern in HCC and performed preoperative noninvasive recurrence risk stratification.
Patients and methods: Patients with suspicious HCC were included prospectively. Two radiologists independently evaluated radiologic features and measured apparent diffusion coefficient (ADC), true diffusion coefficient (D), pseudo-diffusion coefficient (D*), and pseudo-diffusion fraction (f). Logistic regression analyses were used to identify the predictors associated with the VETC pattern. Receiver operating characteristic (ROC) curve analyses were conducted to assess the predictive performance. Recurrence-free survival was evaluated using the Kaplan-Meier analysis and the Log rank test.
Results: The consecutive cohort included 116 patients (mean age, 55 years ± 11, 94 men). Twenty-nine of the 116 HCC (25.0%) were VETC HCC. The f value (odds ratio [OR], 0.791; p < 0.001), serum α-fetoprotein level (>400 ng/mL) (OR, 2.962; p = 0.042), and intratumor necrosis (OR, 6.022; p = 0.015) were independent predictors of the VETC pattern. These characteristics were used to construct the combined model with area under the ROC curve of 0.854. Additionally, adding the f value to the conventional imaging-clinical model substantially improved its predictive performance (p < 0.001). Moreover, patients with the combined model classified as VETC HCC also had a higher risk of early recurrence than those with non-VETC HCC (p < 0.001).
Conclusion: IVIM enhances the accuracy of preoperative prediction of the VETC pattern and provides preoperative noninvasive risk stratification for HCC recurrence.
Keywords: diffusion-weighted imaging; hepatocellular carcinoma; intravoxel incoherent motion; recurrence-free survival; vessels encapsulating tumor clusters.
© 2025 Li et al.
Conflict of interest statement
The authors report no conflicts of interest in this work.
Figures


References
LinkOut - more resources
Full Text Sources
