. 2025 Sep;12(33):e01175.
doi: 10.1002/advs.202501175. Epub 2025 Jun 17.

Single-Cell RNA Sequencing Delineates Renal Anti-Fibrotic Mechanisms Mediated by TRPC6 Inhibition

Affiliations

Single-Cell RNA Sequencing Delineates Renal Anti-Fibrotic Mechanisms Mediated by TRPC6 Inhibition

Yao Xu et al. Adv Sci (Weinh). 2025 Sep.

Abstract

Chronic kidney disease (CKD) is characterized by persistent inflammation and tubulointerstitial fibrosis leading to end-stage renal disease. Transient receptor potential canonical 6 (TRPC6) channel inhibition mitigates tubular injury and renal fibrosis in murine models of unilateral ureteral obstruction (UUO) and 2-month chronic post-ischemia-reperfusion injury (2m post-I/R). Through integrated analysis of single-cell-RNA-sequencing (scRNA-Seq) data from UUO mice treated with the selective TRPC6 inhibitor SH045, here the renoprotective cell composition and cell type-specific transcriptional programs are defined. We explored translational aspects by conducting an in-depth scRNA-Seq analysis of kidney samples from patients with CKD. These results reveal global transcriptional shifts with a dramatic diversification of inflammatory cells, endothelial cells and fibroblasts. Notably, a distinct subpopulation of novel endothelial cells is delineated, which is termed ECRIN, that regulate inflammatory networks implicating VEGF and GAS signaling pathways. The data also indicates that inhibition of TRPC6 channels triggers a Prnp transcription factor regulatory network, which contributes to the alleviation of renal fibrosis. The key findings are supported at the protein level by immunofluorescence and western blot analysis. We observed similar patterns in the chronic 2m postI/R injury model. These findings provide novel insights into the potential therapeutic benefits of TRPC6 inhibition in CKD.

Keywords: chronic kidney disease; renal fibrosis; single‐cell rna sequencing; spatial transcriptomics.


Conflict of interest statement

The authors declare no conflict of interest.

Figures

Figure 1
Figure 1
Impact of SH045 on cell diversity in mouse unilateral ureteral obstruction (UUO) model characterized by single‐cell transcriptomic analysis (scRNA‐Seq). A) Experimental design of UUO and scRNA‐Seq workflow. Mice were subjected to UUO and then injected with SH045 (n = 3) or vehicle (n = 3) once every 24 h between day 0 and day 7. Ctrl group includes kidneys that were not subjected to the UUO (n = 3). B) Uniform manifold approximation and projection (UMAP) plot showing different cell types and clusters of endothelial cells and fibroblasts from UUO and Vehicle kidneys. C) Violin plots showing the expression levels of representative marker genes across major cell types. The x axis shows the log‐scale normalized read count. Violin plots showing representative marker genes across endothelial cells D) and fibroblast E). The y axis shows the log‐scale normalized read count.
Figure 2
Figure 2
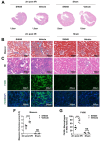
SH045 impact on kidney in 2‐month post ischemia‐reperfusion (2m post I/R) model. A) Representative images of kidney sections 2m post I/R (left panel) and Sham (right panel) groups (scale bar: 1.5 mm). Representative images of I/R and Sham kidneys stained with Masson’ trichrome B), hematoxylin‐eosin (HE) C) and F4/80+ cells D,E) (magnification: 400x, scale bar: 200 µm). Quantification of Masson's trichome score F) and renal F4/80+cell infiltration G). (2m post I/R n = 5, Sham n = 5). Data expressed as mean ± SEM. Two‐way ANOVA followed by Sidak's multiple comparisons post hoc test was used. **** p < 0.0001, NS, not statistically significant.
Figure 3
Figure 3
Characterization of renal endothelial cells and fibroblasts in kidneys isolated from SH045 and vehicle treated mice. A) A neighborhood graph of the results from Milo differential abundance testing. Nodes are neighborhoods, colored by their log fold change between SH045 and Vehicle group. Non‐differential abundance neighborhoods (FDR 10%) are colored white. Size of circles represents the number of cells in each neighborhood. The region encircled by the dashed line denotes neighborhood groups that correspond to the endothelial cell (upper panel) and the fibroblast (lower panel) subpopulations. UMAP and stacked bar plots showing different cell types and clusters of endothelial cells B) and fibroblasts C) from SH045 and Vehicle. D) Heatmap of top 5 marker genes in subtypes of endothelial cells. E) Ordering renal endothelial cells along Monocle3 pseudotime trajectory. F) UMAP of endothelial cells representing individual samples. G) Heatmap of top 5 marker genes in subtypes of renal fibroblasts. H) Ordering renal fibroblasts along Monocle3 pseudotime trajectory. I) UMAP of fibroblasts representing individual samples.
Figure 4
Figure 4
Resolving spatial distribution of novel endothelial cells and pathways activity in a mouse UUO model. A) Clustering assignment for SH045 (left panel) and Vehicle (right panel) group tissue sections. B) Dot plot showing the expression of marker genes representing typical kidney structures in clusters identified by PRECAST algorithm. The size of the dot indicates the percentage of positive spots, and the color indicates the average expression. Slc27a2 (solute carrier family 27 member 2) and Vcam1 (vascular cell adhesion molecule 1) represent renal medulla, Slc12a1 (solute carrier family 12 member 1) and Umod (uromodulin) represent renal cortex. pct.exp, percentage expression; std.exp, standardized expression. C) Representative immunofluorescence staining images of CD31 and Ki67 colocalization in SH045 (left panel) and Vehicle (right panel) kidneys (magnification: 400x, scale bar: 200 µm). D) Quantification of CD31+Ki67+ cells in kidney sections from SH045 and Vehicle treated mice. (SH045 n = 3, Vehicle n = 3). Data expressed as mean ± SEM. Mann‐Whitney U‐test was used. ** p < 0.01. E) Distribution of novel endothelial cells in samples from SH045 (upper panel) and Vehicle (lower panel) group. Activity of JAK‐STAT F) and VEGF G) pathways in SH045 (upper panel) and Vehicle (lower panel) group.
Figure 5
Figure 5
Acta2 and Scara5 expression in the fibroblasts using scRNA‐Seq, spatial transcriptomics, and immunofluorescence. Violin plots A,B) and UMAP plots C,D) showing expression of Acta2 and Scara5 in fibroblast subpopulation. Pseudotime trajectory analysis display expression changes of Acta2 E) and Scara5 F). G) Spatial expression of Acta2 and Scara5 in SH045. H) Representative immunofluorescence staining images of SCARA5 and α‐SMA colocalization in kidney sections from SH045 (left panel) and Vehicle (right panel) treated mice (magnification: 400x, scale bar: 200 µm). I) Quantification of SCARA5+ cells in kidney sections from SH045 and Vehicle treated mice. (SH045 n = 3, Vehicle n = 3). Data expressed as mean ± SEM. Mann‐Whitney U‐test was used. ** p < 0.01. J) UMAP plots showing relative level of wound healing score in each fibroblast subpopulation.
Figure 6
Figure 6
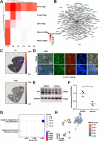
Transcriptional regulatory network in F2 fibroblasts. A) Heatmap of top transcription factors activities in each fibroblast subpopulation. B) Gene network showing target genes of Prnp. The dot size represents relative weight values in the regulatory network. C) Spatial distribution of F2 fibroblasts (left panel) and spatial activity of Prnp transcription factor (right panel) in SH045 group, white arrows represent areas where spots of high Prnp activity overlap with the distribution of F2 fibroblasts. D) Representative immunofluorescence staining images of PrP and Collagen III colocalization of kidneys from SH045 (upper panel) and Vehicle (lower panel) treated mice (magnification: 400x, scale bar: 200 µm). E) Representative Western blot of and relative densitometric graphs of GAPDH, PrP in SH045 and Vehicle treated mice. F) Quantification of PrP expression normalized to GAPDH levels. (SH045 n = 3, Vehicle n = 3). Mann‐Whitney U‐test was used. ** p < 0.01. G) Enriched Gene ontology (GO) terms of Prnp target genes. UMAP plots H) showing relative level of negative regulation of cell proliferation (NRCP) score in each fibroblast subpopulation. Pura: purine‐rich element binding protein alpha, Prnp/PrP: prion protein (Kanno blood group), Ebf1: early B‐cell factor 1, Mecom: MDS1 and EVI1 complex locus, Mef2c: myocyte‐specific enhancer factor 2C, Col3: Collagen III, GAPDH: glyceraldehyde‐3‐phosphate dehydrogenase 1.
Figure 7
Figure 7
Alterations in network structure and signaling strength of putative cell‐cell communications in kidneys isolated from SH045 and Vehicle treated mice. A) Total number of possible interactions. B) Differential number of possible interactions between the four major kidney cell types. Red and blue lines indicate higher or lower number of predicted interactions in SH045 and vehicle group, respectively. C) Differential number of possible interactions between any two cell populations. Red (positive values) and blue (negative values) in the color bar indicate higher number of predicted interactions in SH045 versus Vehicle group, respectively. D) Differential interaction analysis identifying prominently altered signaling sources and targets. E) Significant signaling pathways were ranked based on their differences in relative information flow (upper panel) and absolute information flow (lower panel). Differences were calculated by summarizing all communication probabilities in each inferred network. Those colored red and green are more enriched in SH045 and Vehicle groups, respectively. LA, Large Artery; CA, Capillary Artery; DT, Distal tubule cells; IC, Intercalated cells; LH, Loop of Henle cells; PC, Principal cells; PT, Proximal tubule cells; UK, Unknown; IM, Inflammatory cells, F0‐F5 subpopulations of renal fibroblasts.
Figure 8
Figure 8
Signaling pathways and key genes enriched by SH045 treatment. A) Circle diagram of signals sent from and received by F4 fibroblasts in noncanonical (nc) WNT signaling pathway network. Differential number of possible interactions between the four major kidney cell types. B) Expression of key gene Wnt5a of ncWNT signaling network in F4 renal fibroblasts. C) Spatial expression level of Wnt5a in F4 fibroblasts from SH045 (left panel) and Vehicle (right panel) group. D) Circle diagram of signals sent from and received by Novel renal endothelial cells in GAS signaling pathway network. E) Expression of key gene gamma‐carboxyglutamic acid (Gla)‐containing protein gene (Gas6) of GAS signaling network in Novel renal endothelial cells. F) Circle diagram of signals sent from and received by Novel endothelial cells in Vascular endothelial growth factor (VEGF) signaling pathway network. G) Expression differences of key genes (Flt1 and Kdr) of VEGF signaling network in Novel renal endothelial cells. The thickness of the lines indicates the relative number of cell interactions. Red lines indicate higher number of predicted interactions in SH045 group. Spatial expression level of Flt1 H) and Kdr I) in Novel endothelial cells from SH045 (left panel) and Vehicle (right panel) group. LA, Large Artery; CA, Capillary Artery; DT, Distal tubule cells; IC, Intercalated cells; LH, Loop of Henle cells; PC, Principal cells; PT, Proximal tubule cells; UK, Unknown; IM, Inflammatory cells, F0‐F5 subpopulations of renal fibroblasts. * p < 0.05, ** p < 0.01.
Figure 9
Figure 9
Schematic illustration of the mechanism by which TRPC6 blockade improves renal fibrosis.

References

    1. Kalantar‐Zadeh K., Jafar T. H., Nitsch D., Neuen B. L., Perkovic V., Lancet 2021, 398, 786. - PubMed
    1. LeBleu V. S., Taduri G., O'Connell J., Teng Y., Cooke V. G., Woda C., Sugimoto H., Kalluri R., Nat. Med. 2013, 19, 1047. - PMC - PubMed
    1. Duffield J. S., J. Clin. Invest. 2014, 124, 2299. - PMC - PubMed
    1. Humphreys B. D., Lin S.‐L., Kobayashi A., Hudson T. E., Nowlin B. T., Bonventre J. V., Valerius M. T., McMahon A. P., Duffield J. S., Am J Pathol 2010, 176, 85. - PMC - PubMed
    1. Lin S. L., Kisseleva T., Brenner D. A., Duffield J. S., Am J Pathol 2008, 173, 1617. - PMC - PubMed

MeSH terms

LinkOut - more resources