. 2025 Jun 17:14:RP105422.
doi: 10.7554/eLife.105422.

A contextual fear conditioning paradigm in head-fixed mice exploring virtual reality

Affiliations

A contextual fear conditioning paradigm in head-fixed mice exploring virtual reality

Seetha Krishnan et al. Elife. .

Abstract

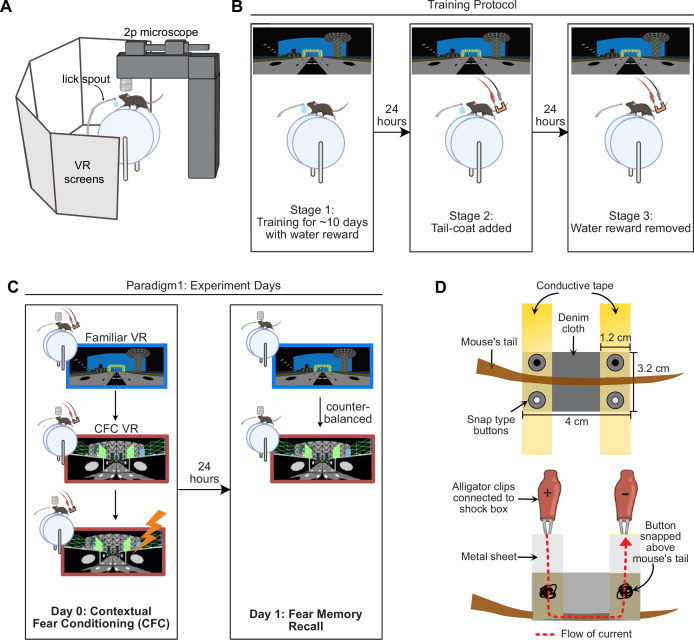
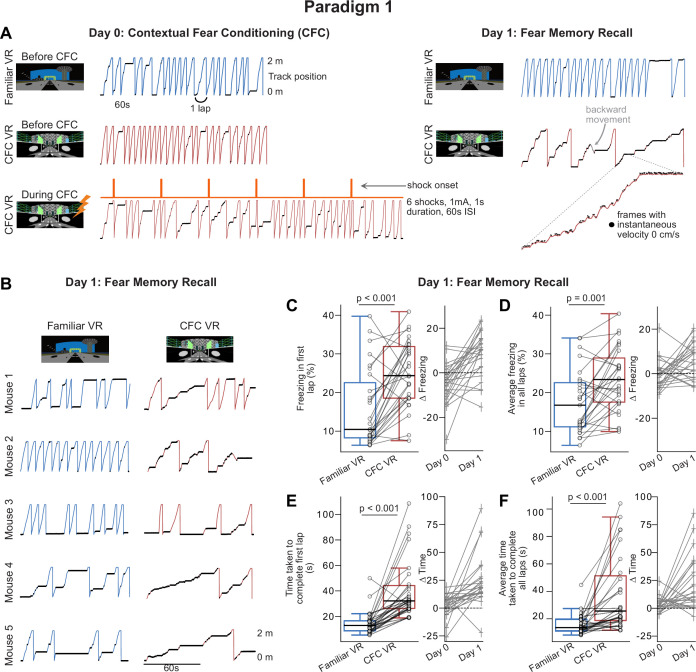
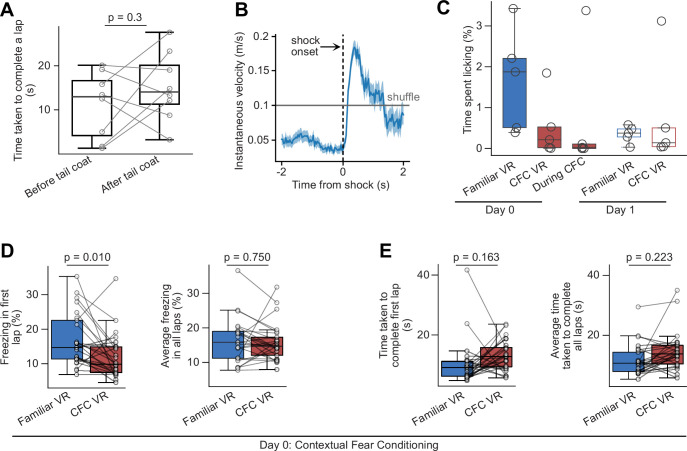
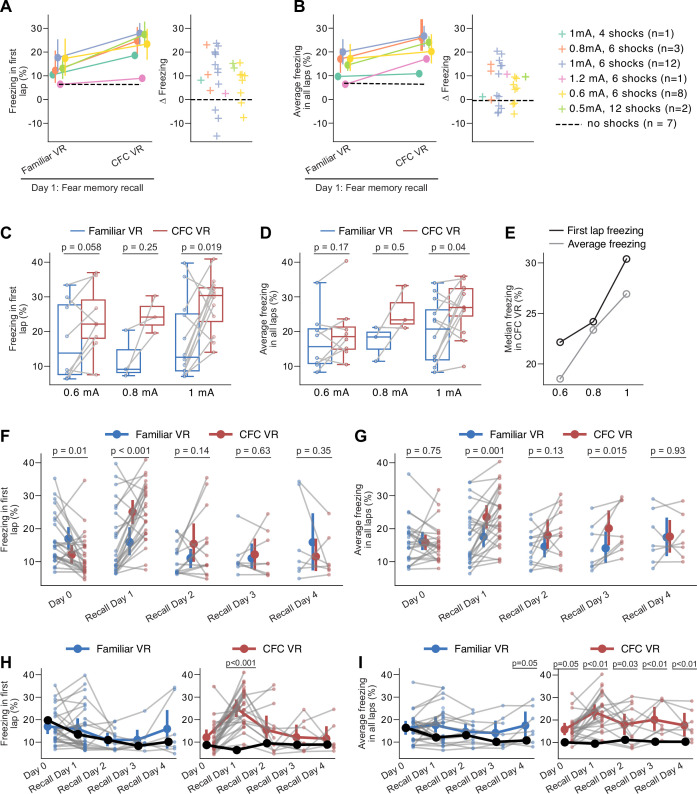
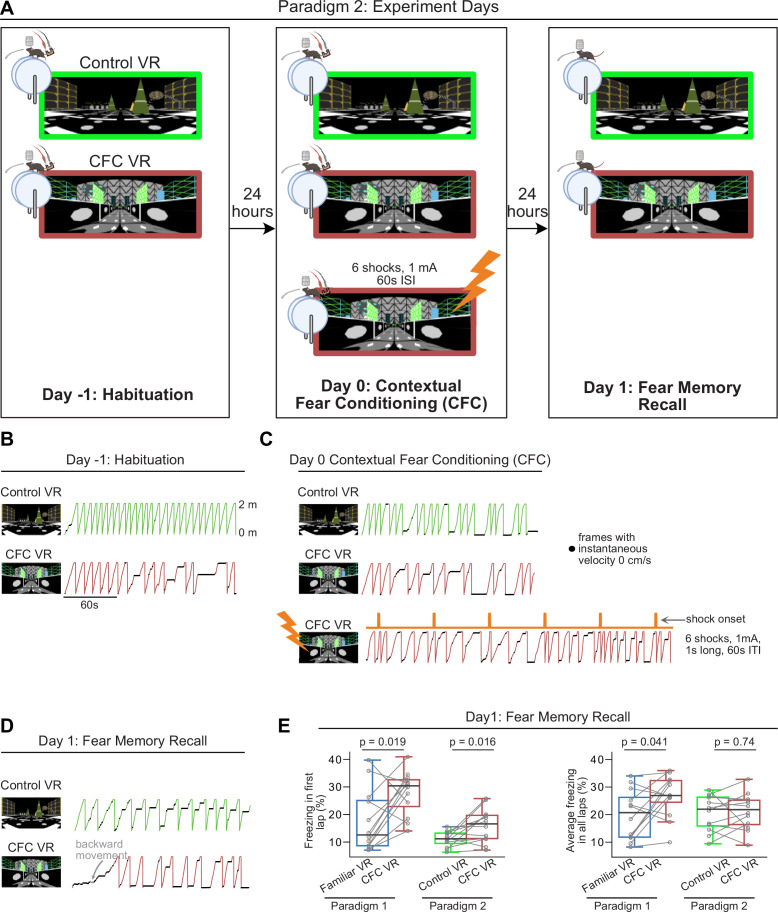
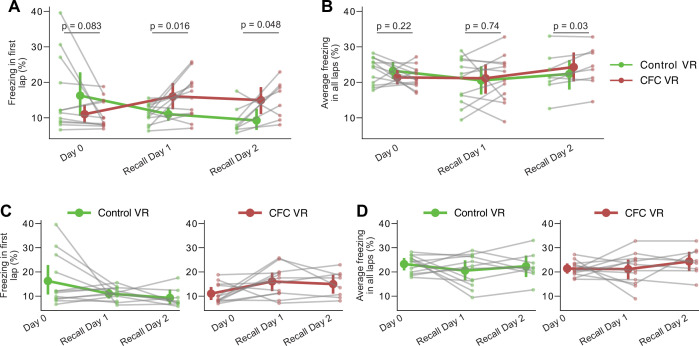
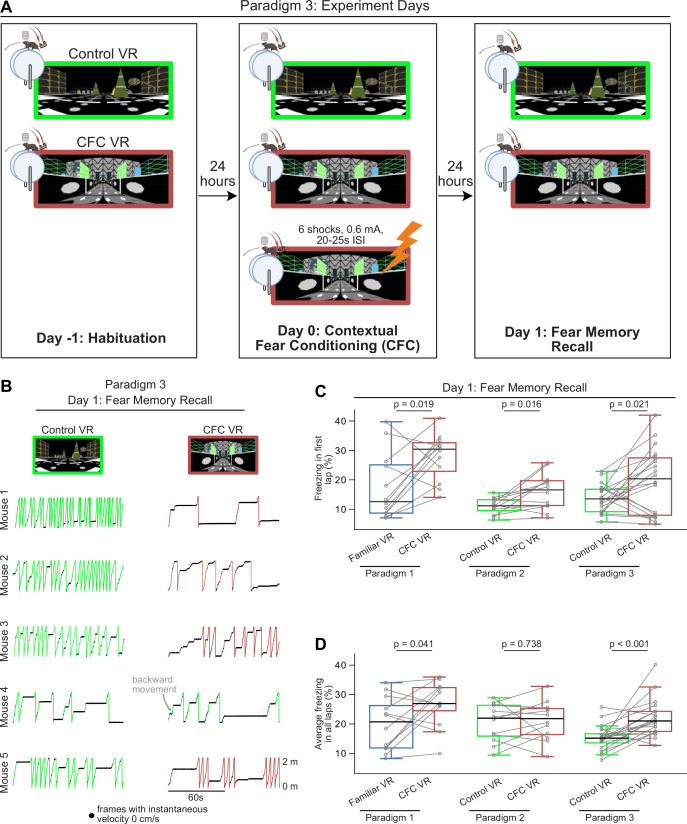
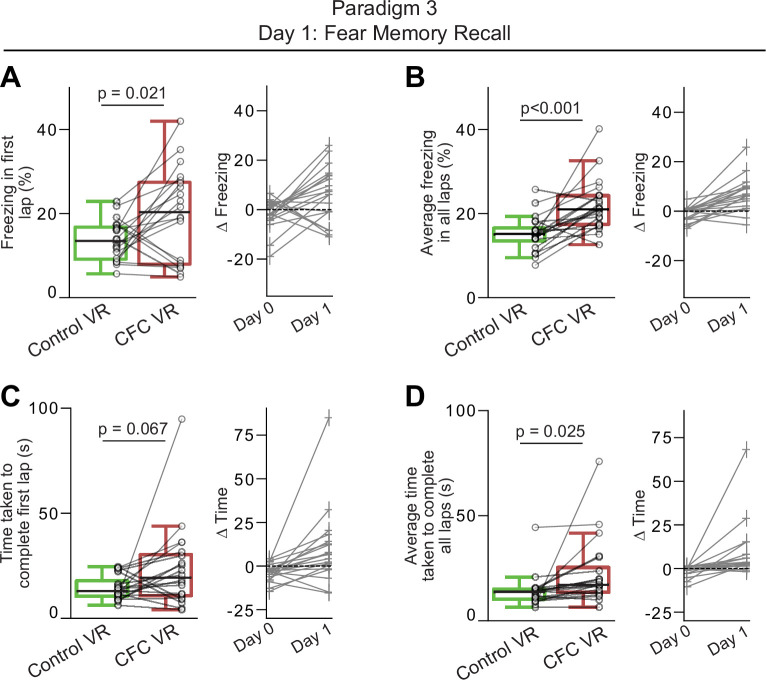
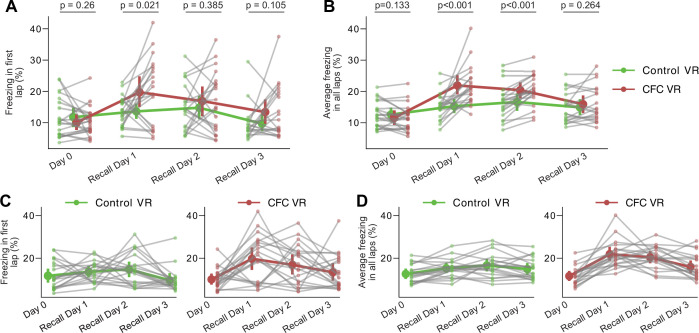
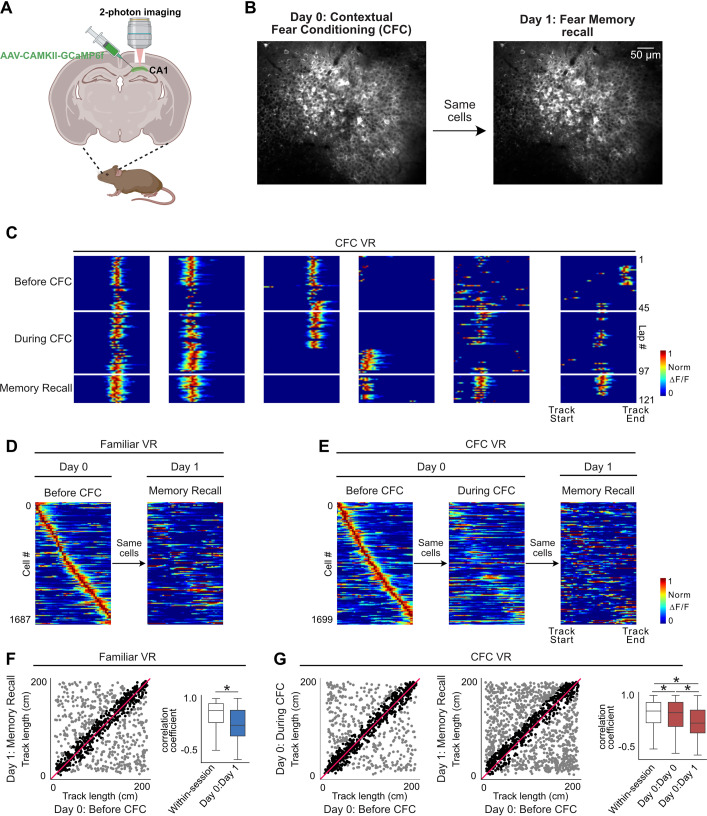
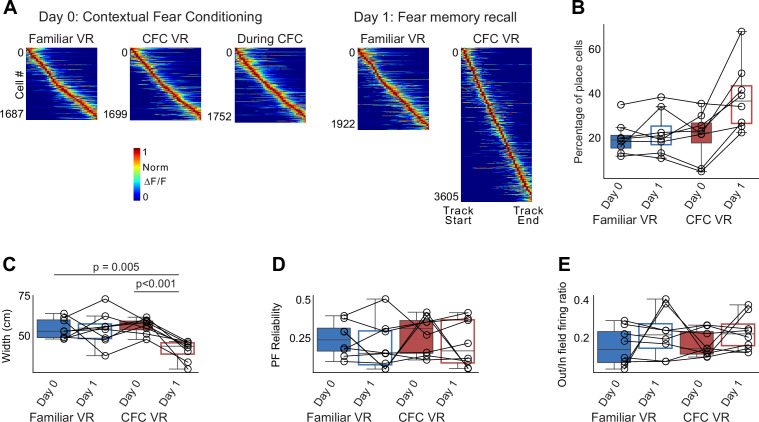
Contextual fear conditioning (CFC) is a classical laboratory task that tests associative memory formation and recall. Techniques such as multi-photon microscopy and holographic stimulation offer tremendous opportunities to understand the neural underpinnings of these memories. However, these techniques generally require animals to be head-fixed. Few paradigms examine contextual fear in head-fixed mice, and none use freezing-the most common measure of fear in freely moving animals-as the behavioral readout. To address this gap, we developed a CFC paradigm for head-fixed mice using virtual reality (VR). We designed an apparatus to deliver tail shocks while mice navigated a VR environment. We tested three versions of this paradigm and, in all of them, observed increased freezing, particularly on the first trial, in the shock-paired VR compared to a neutral one. These results demonstrate that head-fixed mice can be fear-conditioned in VR and exhibit context-specific freezing behavior. Additionally, using two-photon calcium imaging, we tracked large populations of hippocampal CA1 neurons before, during, and following CFC. As in freely moving mice, CA1 place cells remapped and developed narrower fields following fear conditioning. Thus, our approach enables new opportunities to study the neural mechanisms underlying the formation, recall, and extinction of contextual fear memories.

Keywords: fear conditioning; mouse; neuroscience; place cells; two-photon imaging; virtual reality.


Conflict of interest statement

SK, CD, HR, DM, CC, MS No competing interests declared

Figures

Figure 1.
Figure 1.. A contextual fear conditioning paradigm for head-fixed mice navigating virtual reality environments.
(A) Experimental setup created withBioRender.com. Mice were head-restrained with their feet resting on a cylindrical treadmill. Five large monitors surrounded the mice that displayed virtual reality (VR) environments. Movement on the treadmill advanced the VR display, allowing for context exploration. (B) Mice were water-restricted and trained to run laps in the VR for water rewards. VR environments were 2m-long linear tracks. Mice were trained to achieve >3 laps per minute, which took ~10–14 d (Stage 1). Once well-trained, a ‘tail-coat’ was added to their tails (Stage 2), followed by the removal of the water reward the next day (Stage 3). (C) For Paradigm 1, mice underwent the fear conditioning protocol the following day after the water reward was removed. On the first experiment day (Day 0), mice spent 10 min in the training VR (Familiar VR) and then another 10 min in a new VR (contextual fear conditioning, CFC VR). After the initial exploration, mice received mild electric shocks on the tail (4–12 shocks, 0.5–1.2mA in amplitude, 1 s long). The next day (Day 1), mice were tested for memory recall by placing them in the Familiar VR and the CFC VR for 5 min each in a counterbalanced manner. (D) Schematic of the tail-coat used for delivering mild electric shocks to the mouse’s tail. (Top) View from the top (Bottom) side view. Dimensions are provided for a typical 12-wk-old male mouse weighing ~30 g before water restriction (see Methods for more details).
Figure 2.
Figure 2.. Paradigm 1: Head-fixed mice show increased freezing behavior following contextual fear conditioning in the contextual fear conditioning (CFC) virtual reality (VR).
(A) A single example mouse’s lap running behavior on experiment days, Day 0 and Day 1. Behavior is shown for approximately 3 min in all sessions except during CFC, which is shown for the 6 min that the session lasted. Frames where freezing was detected (instantaneous velocity 0 cm/s) are marked with black dots. A zoomed-in portion on the right in CFC VR highlights these freezing epochs as periods of minimal movement on the treadmill (i.e. instantaneous velocity 0 cm/s), which are less visible in the full-scale view. The traces on the right show that this mouse increased freezing, decreased velocity, and moved backward (shown in gray) in the CFC VR (red traces) but not in the Familiar VR (blue traces) on Recall Day. This mouse received six shocks at 1mA intensity at 60 s inter-stimulus interval (ISI). (B) First 2 min of recall behavior in more mice (n=5) in Familiar VR versus CFC VR. (C–D) Left Average freezing percentage on recall day in the very first lap (C) and all laps (D) during the 5 min that mice explored the Familiar (blue) and CFC (red) VR. Freezing (%) was calculated as the number of frames where freezing was detected in a lap divided by the total number of frames in each lap. (Right) Delta calculated as the difference in the amount of freezing in the CFC VR compared to the Familiar VR before CFC (Day 0) and after CFC (Day 1). The dashed line represents 0. (E–F) Same as C-D but for the time taken to complete the first lap (E) and all laps (F). Mice displayed an increase in freezing and in time taken to complete a lap in the first lap and, on average, in the CFC VR. In C-F, circles and pluses represent individual mice (n=27, 25 male, and two female mice). In C-F, data was pooled from mice receiving different numbers of shocks (4, 6, 12) at varying intensities (0.5 mA, 0.6mA, 0.8 mA, 1 mA, and 1.2 mA), which is separately displayed in Figure 2—figure supplement 1. Lines join data from the same mouse. p-values were calculated using a paired t-test.
Figure 2—figure supplement 1.
Figure 2—figure supplement 1.. Running and licking behaviors in Paradigm 1.
(A) Box plot of average time taken to complete a lap before and after the addition of a tail-coat recorded in a randomly chosen subset of mice (circles, n=8). (B) Instantaneous velocity increased immediately after shock onset. This increased running speed also served as a reliable measure to confirm that mice received the tail shock. The gray line indicates the average velocity calculated by shuffling the instantaneous velocity 100 times. (C) Licking behavior doesn't stop immediately in the familiar virtual reality (VR) without water, as mice previously received water rewards in the familiar VR. However, it was low in the other sessions and across environments. There was no significant difference between the Familiar and contextual fear conditioning (CFC) VR on Day 1. Licking behavior was collected only in a subset of mice (circle, n=5). (D–E) The amount of freezing (D) and time taken to complete a lap (E) were not significantly different between the Familiar and CFC VR before fear conditioning (n=25). While not significantly different, there was a trend towards longer time taken in the first lap of the CFC VR (E), which we have observed before when mice enter novel environments from familiar ones (Dong et al., 2021). The significantly lesser freezing during this first lap (D) suggests that animals were exploring slowly rather than remaining immobile. The boxplots in A, (C–E) range from the first quartile (25th percentile) to the third quartile (75th percentile), and the box shows the interquartile range (IQR). The line across the box represents the median (50th percentile). The whiskers extend to 1.5×IQR on either side of the box, and anything above this range is defined as an outlier. P-values were calculated using a paired t-test.
Figure 2—figure supplement 2.
Figure 2—figure supplement 2.. Change in freezing with shock amplitude, number of shocks, and across recall days in Paradigm 1.
(A–B) The left panel shows freezing in the first lap (A) and across all laps (B). The right panel illustrates delta freezing, calculated as the difference in freezing between the contextual fear conditioning (CFC) virtual reality (VR) and the Familiar VR. The colors represent the shock parameters used. Number of animals used is indicated in the figure legend. The dashed line represents the average freezing percentage in a control paradigm, where mice experienced the same conditions without shocks (n=7). In most cases, we observed an increase in freezing in the CFC VR compared to the Familiar VR (delta >0). (C–D) Freezing in the first lap (C) and across all laps (D) by shock amplitude. In all cases, mice received six shocks that were 1 min apart. Greater fear discrimination could be seen at higher shock amplitudes. (E) Median freezing in the CFC VR by shock amplitude for first lab freezing (black) and average freezing across laps (gray). (F–G) A subset of animals underwent multiple days of recall tests (n=25 Day 0, n=27 Recall Day 1, n=13 Recall Day 2, n=8 Recall Day 3, n=7 Recall Day 4). VR environments were presented in a counterbalanced manner for 5 min each day. The increase in freezing in the CFC VR was highest on the first day, both in the first lap (F) and across all laps (G). p-values were calculated using a paired t-test. (H–I) Within-VR comparison of the same dataset. First lap freezing (H) and average freezing across all laps (I), separated by Familiar VR (left panels) and CFC VR (right panels), demonstrate fear extinction across days. The black line represents average freezing in control mice that received no shocks. p-values indicate significant differences between experimental and no-shock control groups (t-test). Fear extinction is quantified by the linear mixed effect (LME) model in Tables 1 and 2, which shows the statistical comparison of freezing in recall days versus Day 0 (baseline) within each VR.
Figure 3.
Figure 3.. Using a novel virtual reality (VR) as the neutral environment instead of a familiar VR in a second paradigm results in modest increases in freezing.
(A) The training paradigm for Paradigm 2 is similar to Paradigm 1. On experiment day, mice were introduced to two novel VRs, one of which would be associated with the shock (contextual fear conditioning, CFC VR) and the other wouldn’t (Control VR). In this paradigm, there was an added habituation day, where mice were exposed to the two VRs for 10 min. The next day, mice ran in the two VRs again before receiving mild electric shocks in the CFC VR. The recall test occurred the next day. In this cohort, all mice received six shocks at 1 mA intensity. (B–D) These panels show the lap running behavior of a single mouse on experiment days –1, 0, and 1. Behavior is displayed for about 3 min in all sessions except during CFC. Frames with freezing detected by a threshold (instantaneous velocity 0 cm/s) are marked by black dots. In (D), this mouse shows an increase in freezing, a decrease in velocity, and some backward movement when in the CFC VR (red traces). (E) Comparison between freezing in the first lap (left) and all laps (right) in Paradigm 1 (blue and red) versus Paradigm 2 (green and red). In Paradigm 1, only animals that received six shocks at 1 mA intensity are included. n=12 mice were used in both paradigms (10 male and two female mice). The scale bar for panels B-D is indicated in B. p-values were calculated using a paired t-test.
Figure 3—figure supplement 1.
Figure 3—figure supplement 1.. Licking and running behavior before fear conditioning, in Paradigm 2.
(A) Licking behavior remains low in all sessions, unlike Paradigm 1. It does not significantly differ between the Control vs contextual fear conditioning (CFC) virtual reality (VR) before and after CFC. (B–C) The amount of freezing and average running speed was not significantly different between the Control and CFC VR before fear conditioning, both on Day –1 (B) and Day 0 (C). p-values were calculated using a paired t-test.
Figure 4.
Figure 4.. In Paradigm 2, the most significant freezing and reduced speed occurred in the first lap of the contextual fear conditioning (CFC) virtual reality (VR) compared to the Control VR.
(A) First 2 min of recall behavior in five mice in Control VR (green) versus CFC VR (red). (B–C) The left panels show the amount of freezing on the recall day in (B) the very first lap and (C) all laps during the 5 min when the mice explored the Control (green) and CFC (red) VR. Freezing (%) is calculated as the number of frames where freezing was detected in a lap divided by the total number of frames in each lap. On the right, the delta is calculated as the difference in the amount of freezing in the CFC VR compared to the Control VR before (Day 0) and after CFC (Day 1). The dashed line represents 0. (D–E) Same as B-C but for the time taken to complete the first lap (D) and all laps (E). In B-E, circles and pluses represent individual mice (n=12). Lines join data from the same mouse. p-values were calculated using a paired t-test.
Figure 4—figure supplement 1.
Figure 4—figure supplement 1.. Lap-wise freezing behavior in the three paradigms.
(A–F) Average freezing across mice (A–C) and the number of freezing epochs (D-F, see Methods) in each lap across the two virtual realities (VRs) on the first day of recall in (A, D) Paradigm 1, (B, E) Paradigm 2 and (C, F) Paradigm 3. Lines indicate mean, and shading indicates 95% confidence intervals. P-values between (A, D) Familiar VR and contextual fear conditioning (CFC) VR and (B–C, E–F) Control VR and CFC VR were calculated using a paired t-test. * indicates p-values <0.01.
Figure 4—figure supplement 2.
Figure 4—figure supplement 2.. Mice largely extinguished their fear within the first day of recall in Paradigm 2.
(A–B) First lap freezing (A) and average freezing across all laps (B) across 2 d of recall in Paradigm 2. p-values were calculated using a paired t-test. Circles indicate data from individual mice (n=12 for Recall Day 1 and n=8 for Recall Day 2). p-values were calculated using a paired t-test. (C–D) Within-virtual reality (VR) comparison of the same dataset. First lap freezing (C) and average freezing across all laps (D), separated by Familiar VR (left panels) and contextual fear conditioning (CFC) VR (right panels), demonstrate fear extinction across days. Fear extinction is quantified by the linear mixed effect (LME) model in Tables 3 and 4, which shows the statistical comparison of freezing in recall days versus Day 0 (baseline) within each VR.
Figure 5.
Figure 5.. A third paradigm that uses a novel virtual reality (VR) as the neutral environment but keeps the tail-coat on during memory recall led to increased freezing in the contextual fear conditioning (CFC) Environment.
(A) The training and experiment paradigm was similar to Paradigm 2 except that the shocks were administered closer together (20–25 s ISI), and the tail-coat was kept on during recall days. (B) First 2 min of recall behavior in Paradigm 3 in five mice in Control VR (green) versus CFC VR (red). (C–D) Comparison between freezing in the first lap (C) and all laps (D) in Paradigm 1 (blue and red) versus Paradigms 2 and 3 (green and red). n=12 mice were used in Paradigms 1 and 2 (10 male and two female mice), and n=20 male mice in Paradigm 3. p-values were calculated using a paired t-test. In Paradigm 3, by keeping the tail-coat on during the recall days, we observed an increase in freezing in the CFC VR in the first lap and across all laps compared to Paradigm 2.
Figure 6.
Figure 6.. Mice exhibited increased freezing and overall reduced speed in the contextual fear conditioning (CFC) virtual reality (VR) in Paradigm 3.
(A–B) The left panels show the amount of freezing on the recall day in (A) the very first lap and (B) all laps during the 5 min when the mice explored the Control (green) and CFC (red) VR. Freezing (%) is calculated as the number of frames where freezing was detected in a lap divided by the total number of frames in each lap. On the right, the delta is calculated as the difference in the amount of freezing in the CFC VR compared to the Control VR before (Day 0) and after CFC (Day 1). The dashed line represents 0. (C–D) Same as A-B but for time taken to complete the first lap (C) and all laps (D). Circles and pluses represent individual mice (n=20). Lines join data from the same mouse. p-values were calculated using a paired t-test.
Figure 6—figure supplement 1.
Figure 6—figure supplement 1.. Mice displayed better fear discrimination and a delay in extinction in Paradigm 3 compared to Paradigms 1 and 2.
(A–B) Freezing in the first lap (A) and average freezing across all laps (B) in the Control virtual reality (VR) vs contextual fear conditioning (CFC) VR on three consecutive recall days in Paradigm 3 (n=20). The tail-coat was kept on all recall days. p-values were calculated using a paired t-test. (C–D) Within-VR comparison of the same dataset. First lap freezing (C) and average freezing across all laps (D), separated by Familiar VR (left panels) and CFC VR (right panels), demonstrate fear extinction across days. Fear extinction is quantified by the linear mixed effect (LME) model in Tables 5 and 6, which shows the statistical comparison of freezing in recall days versus Day 0 (baseline) within each VR.
Figure 7.
Figure 7.. Fear conditioning results in place cell remapping in both Familiar and contextual fear conditioning (CFC) virtual reality (VR).
(A) A schematic of the procedure for two-photon imaging of large populations of the same CA1 neurons over multiple days, created withBioRender.com (B) An example field of view across the two experiment days. The same field of view was aligned and imaged across days. (C) Examples of a few place cells in the CFC VR across sessions on Day 0 (before CFC, during CFC) and Day 1 (Memory Recall). White lines separate laps in each session. Some place cells maintain stable fields across days, while others remap. (D) Place fields defined on Day 0 in Familiar VR before CFC are plotted across Day 1 during fear memory recall (n=8 mice). (E) Place fields defined on Day 0 in CFC VR before CFC are plotted across the fear conditioning session and on Day 1 during fear memory recall. (F) On the left is a scatter plot of the center of mass of place fields defined in Familiar VR before CFC on Day 0 (x-axis) compared to their center of mass on Day 1 during fear memory recall (y-axis). On the right is a boxplot of correlation coefficients between mean place fields defined in Familiar VR before CFC on Day 0 and memory recall on Day 1 (Day 0: Day 1). The within-session correlation coefficients serve as control and were calculated between mean place fields in the first half and second half of the Familiar VR before the CFC session. (G) A scatter plot of the center of mass of place fields defined in CFC VR before CFC on Day 0 (x-axis) compared to their center of mass on (right) Day 0 during CFC and (middle) Day 1 during memory recall. On the left is a distribution of correlation coefficients between mean place fields defined in Familiar VR before CFC on Day 0 and during CFC (Day 0: Day 0) and memory recall on Day 1 (Day 0: Day 1). The within-session correlation was calculated between mean place fields in the first half and second half of the CFC VR before the fear conditioning session. Asterisk (*) indicates significant p-values (KS test, p<0.01). Our findings show that place fields present in the before CFC sessions in both Familiar and CFC VR showed significant remapping following fear conditioning.
Figure 8.
Figure 8.. The widths of place fields in CA1 narrow during memory recall.
(A) Place fields were defined and sorted by track length in each session, pooled from all mice (n = 8 mice). Each cell’s activity was normalized to its peak, and cells were sorted by their center of mass along the track. (B) The percentage of place cells is calculated as the number of place cells divided by the total number of recorded cells. More place cells were identified by our algorithm in the CFC VR on Day 1. (C–E) Parameters of place fields: (C) Width, (D) Place Field (PF) Reliability, and (E) out/in field firing ratio in both VRs on Day 0 and Day 1. The width of the place fields in the CFC VR significantly decreased on Day 1. No other parameters significantly varied across days. p-values were calculated using a paired t-test.

Update of

Similar articles

References

    1. Anagnostaras SG, Gale GD, Fanselow MS. Hippocampus and contextual fear conditioning: recent controversies and advances. Hippocampus. 2001;11:8–17. doi: 10.1002/1098-1063(2001)11:1<8::AID-HIPO1015>3.0.CO;2-7. - DOI - PubMed
    1. Aronov D, Tank DW. Engagement of neural circuits underlying 2D spatial navigation in a rodent virtual reality system. Neuron. 2014;84:442–456. doi: 10.1016/j.neuron.2014.08.042. - DOI - PMC - PubMed
    1. Baldi E, Lorenzini CA, Bucherelli C. Footshock intensity and generalization in contextual and auditory-cued fear conditioning in the rat. Neurobiology of Learning and Memory. 2004;81:162–166. doi: 10.1016/j.nlm.2004.02.004. - DOI - PubMed
    1. Bando Y, Wenzel M, Yuste R. Simultaneous two-photon imaging of action potentials and subthreshold inputs in vivo. Nature Communications. 2021;12:7229. doi: 10.1038/s41467-021-27444-9. - DOI - PMC - PubMed
    1. Barth AM, Jelitai M, Vasarhelyi-Nagy MF, Varga V. Aversive stimulus-tuned responses in the CA1 of the dorsal hippocampus. Nature Communications. 2023;14:6841. doi: 10.1038/s41467-023-42611-w. - DOI - PMC - PubMed