. 2025 Sep;12(33):e15181.
doi: 10.1002/advs.202415181. Epub 2025 Jun 17.

The Non-Coding Regulatory Variant rs2863002 at chr11p11.2 Increases Neuroblastoma Risk by Affecting HSD17B12 Expression and Lipid Metabolism

Affiliations

The Non-Coding Regulatory Variant rs2863002 at chr11p11.2 Increases Neuroblastoma Risk by Affecting HSD17B12 Expression and Lipid Metabolism

Teresa Maiorino et al. Adv Sci (Weinh). 2025 Sep.

Abstract

A Genome-wide association study (GWAS) on a European-American cohort identified chr11p11.2 as a neuroblastoma predisposition locus. Combining in-house and public genomic data from neuroblastoma cell lines, this work implicates rs2863002 as the candidate causal variant at the 11p11.2 locus, confirming its cis-regulatory activity through a luciferase reporter assay. The genetic association of rs2863002 with neuroblastoma risk is validated in an Italian case-control cohort. Using ChIP-qPCR, Hi-C, and CRISPR genome editing, this work deciphers the regulatory mechanisms at the risk locus, demonstrating that the rs2863002-C risk allele regulates HSD17B12 expression and reduces GATA3 binding affinity. In vitro functional assays and targeted lipidomic analyses reveal the involvement of the rs2863002-C risk allele in tumorigenicity and modulation of lipid metabolism in neuroblastoma cells through HSD17B12 regulation. This study provides new insights into the genetic basis of neuroblastoma and underscores the importance of post-GWAS functional characterization of risk loci in uncovering relevant biological findings for understanding complex diseases.

Keywords: HSD17B12; GWAS; SNP; functional genomics; genetic predisposition; lipid metabolism; neuroblastoma.


Conflict of interest statement

The authors declare no conflict of interest.

Figures

Figure 1
Figure 1
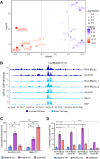
rs2863002 is the functional regulatory SNP of the 11p11.2 neuroblastoma predisposition locus. A) Regional association plot of genotyped SNPs at the 11p11.2 neuroblastoma susceptibility locus implicating HSD17B12. Y‐axis represents the significance of association (‐log10 transformed p values), while the X‐axis shows the genomic location on chromosome 11 (Mb). SNPs are color‐coded based on pair‐wise linkage disequilibrium (r2) with the most statistically significant SNP rs10742682 (top violet triangle) (p‐value = 1.31 × 10⁻⁷, OR: 1.24, 95% CI: 1.15–1.34). Plot generated using LocusZoom. B) The image shows a narrowed‐down region spanning 10 kb up‐ and down‐stream of rs2863002 (chr11:43 714 768, hg19/GRCh37). The peak‐based tracks represent, from top to bottom, the in‐house generated (green) and public (yellow) ATAC‐seq profiles of human neuroblastoma cell lines, the DNase‐I hypersensitivity levels (light blue), and the H3K27ac ChIP‐seq (pink) density profiles obtained from the NCBI GEO public database. Data ranges are shown on the left of each track, while neuroblastoma cell lines are reported on the right.
Figure 2
Figure 2
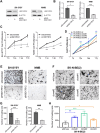
The rs2863002 SNP alters the binding site for the transcription factor GATA3. A) The graph shows the combined results of the TF motifs enrichment analysis (‐Log10P, y‐axis) and the FABIAN scores related to the alteration of the TF binding motifs due to rs2863002 (FABIAN, x‐axis). Each dot represents a TF binding motif with color and size related to the score obtained with the FABIAN prediction tool, while the dotted lines represent the threshold values chosen to classify TF motif disruption (red) or gain (blue). B) ChIP‐seq tracks for GATA3 TF obtained from neuroblastoma cell lines. The image shows rs2863002 at chr11:43 714 768 (hg19/GRCh37) in correspondence with in‐house generated (dark blue) and publicly available (light blue) GATA3 ChIP‐seq data from neuroblastoma cell lines deposited in the GEO database. Data ranges are shown on the left, while neuroblastoma cell lines are reported on the right. C) Chromatin fold enrichment obtained in GATA3 ChIP qPCR experiments carried out in SH‐SY5Y and NMB cells. We report the chromatin fold enrichment obtained for a negative (chr5:24682868–24682979) and a positive (chr2:15982438–15982518) control region for GATA3 binding, respectively in blue and violet, and for the genomic region of rs2863002 in pink. Enrichment measurements are folded on Rabbit IgG and represent the mean ±SD from three independent experiments. D) Chromatin fold enrichment obtained in GATA3 ChIP qPCR experiments carried out in SK‐N‐BE(2) wild‐type cells and relative CRISPR/cas9 edited clones (clone#1, #2, and #3). We report the chromatin fold enrichment obtained for a negative and a positive DNA control region for GATA3 binding, and for the genomic region of rs2863002, as in (B). ns not significant; * p‐value < 0.05; ** p‐value < 0.01; *** p‐value < 0.001. p‐values were calculated by t‐test.
Figure 3
Figure 3
The rs2863002 SNP acts as an enhancer in neuroblastoma cells, positively influencing HSD17B12 expression. A) Luciferase reporter gene assays were carried out in the SH‐SY5Y, SH‐EP, and HEK293 cell lines. Luciferase activity of the constructs harboring the C and T alleles of rs2863002 was compared to a PGL3 empty control vector. The results are expressed as relative luminescence units (RLU) and the ratio between firefly/renilla luciferases provided the normalized luciferase activity for each vector. Data represent the mean ± SD of three independent experiments and p‐values were obtained by t‐test. B,C) Violin plots showing the median expression of HSD17B12 according to rs2863002 genotypes in adrenal gland tissue (GTEx portal) (B), and in the TARGET database of neuroblastoma patients (C). D) Hi‐C results obtained in SK‐N‐BE(2)C neuroblastoma cell line, showing the genomic region including rs2863002 on genome assembly hg19/GRCh37. The interaction matrix is centered on rs2863002 at chr11:43 714 768 and extended of 0.4 Mb up‐ and down‐stream. Genomic coverage is 500Kb and the matrix resolution is 10Kb. Red triangles represent the Topologically Associated Domains (TADs). The genomic tracks displayed from top to bottom are: the arcs track showing the interactions between rs2863002 and the up‐stream annotated bins; the normalized number of interactions; the minus Log10 of the FDR adjusted p‐values; the NCBI RefSeq genes. A brown‐bordered rectangle highlights the HSD17B12 locus. E) Representative western blot image of HSD17B12 expression in SK‐N‐BE(2) wild‐type and CRISPR/Cas9‐edited clones. β‐Actin protein level was used as the loading control. F,G) Quantitative measurements of HSD17B12 protein (F) and mRNA (G) expression in SK‐N‐BE(2) wild‐type and CRISPR/Cas9‐edited clones. H) Correlation analysis of HSD17B12 and GATA3 expression from R2 Genomics (GSE62564). R, correlation coefficient; P, p‐value. I) Western blot images of GATA3 and HSD17B12 protein levels after 72 h of GATA3 siRNA transfection in SH‐SY5Y, NMB, and SK‐N‐BE(2)C. ns non‐significant; * p‐value < 0.05; ** p‐value < 0.01; *** p‐value < 0.001. p‐values were calculated by t‐test.
Figure 4
Figure 4
HSD17B12 is an oncogenic driver enhancing cell growth and invasion in neuroblastoma. A,B) HSD17B12 efficient silencing was measured by western blot (A) and qRT‐PCR (B) in SH‐SY5Y and NMB neuroblastoma cell lines 72 h post siRNA transfection. Data represent the mean ±SD from three independent experiments. C,D) Assessment of cell proliferation in SH‐SY5Y and NMB cell lines after silencing of HSD17B12 (C) and in SK‐N‐BE(2) wild‐type cells and relative CRISPR/Cas9‐edited clones (clone#1, #2, and #3) (D). Cell viability measurements were performed using MTT assays at 0, 24, 48, and 72 h post siRNA transfection (C) or after seeding (D). Data shown are the mean ±SD from two independent MTT experiments, with six technical replicates for each experimental point. E,F) Representative images of trans‐well invasion assays performed in SH‐SY5Y and NMB cell lines after silencing of HSD17B12 (E) and in SK‐N‐BE(2) wild‐type cells and relative CRISPR/Cas9‐edited clones (clone#1, #2, and #3) (F). G,H) Number of invasive cells as measured in SH‐SY5Y and NMB silenced cell lines (G) and in SK‐N‐BE(2) wild‐type cells and relative CRISPR/Cas9‐edited clones (clone#1, #2, and #3) (H). Data represent the mean ±SD from two independent experiments. * p‐value < 0.05; ** p‐value < 0.01; *** p‐value < 0.001. p‐values obtained by t‐test.
Figure 5
Figure 5
HSD17B12 silencing affects lipid metabolism in neuroblastoma, resulting in a widespread downregulation of lipid molecules. A,B) Volcano plots of differential concentrations of 543 lipids in SH‐SY5Y (A) and SK‐N‐BE(2)C (B) cell lines after silencing of HSD17B12 compared to their respective control. Statistically significant changed lipids were selected using p‐value < 0.05 (horizontal dotted line) and log2 fold change (FC) larger than ± 0.58 (vertical dotted lines). C,D) Bar plots showing the most significantly up‐ (green) and down‐regulated (red) lipids in SH‐SY5Y (C) and SK‐N‐BE(2)C (D) silenced cell lines. The differentially abundant lipids (p < 0.05) are plotted according to their fold change of concentration. E,F) Lipid content comparison in SH‐SY5Y (E) and SK‐N‐BE(2)C (F) neuroblastoma cells after silencing of HSD17B12 compared to control conditions (siScrambled). Graphs represent the mean ± SD lipid amount, which indicates the sum of the metabolites' intensities within a class after normalization. ns non‐significant; * p‐value < 0.05; ** p‐value < 0.01; *** p‐value < 0.001. Two‐tailed unpaired t‐tests were performed in each lipid class to establish a statistical difference. AC: acylcarnitines; DAG: diacylglycerols; TG: triacylglycerols; CE: cholesterol esters; LysoPC: Lyso‐phosphatidylcholine; PCaa: acyl‐acyl phosphatidylcholine; PCae: alkyl‐acyl phosphatidylcholine; HexCer: glycosylceramides.
Figure 6
Figure 6
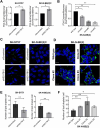
Down‐regulation of HSD17B12 alters lipid molecules affecting the fluidity of membranes and lipid droplet properties. A,B) Membrane fluidity was assessed by measuring the ratio of pyrene‐decanoic acid (PDA) excimer to monomer fluorescence in SH‐SY5Y and SK‐N‐BE(2)C cells after silencing of HSD17B12 (A) and in SK‐N‐BE(2) wild‐type cells and relative CRISPR/Cas9‐edited clones (clone#1, #2, and #3) (B). Fluorescence was evaluated at 400 nm for monomers and 470 nm for excimers. Data represent the mean ± SD of the measurements compared with control conditions (siScrambled) in (A) and SK‐N‐BE(2) wild type in (B) each from two independent experiments performed in duplicate. C,D) Representative confocal images of neutral lipid staining by LipidTOX Green (green) in SH‐SY5Y and SK‐N‐BE(2)C cells after silencing of HSD17B12 (C) and in SK‐N‐BE(2) wild‐type cells and edited clones (D). Nuclei were counterstained with DRAQ5 (blue). Scale bar 20 µM. E,F) Quantification of lipid droplet number obtained through cell‐by‐cell measurements in SH‐SY5Y and SK‐N‐BE(2)C cells after silencing of HSD17B12 (E) and in SK‐N‐BE(2) wild‐type cells and relative CRISPR/Cas9‐edited clones (F). Data represent the mean number ± SD of lipid droplets per cell; measurements have been performed on a mean number of 100 cells per experimental condition. * p‐value < 0.05; ** p‐value < 0.01. p‐values were calculated by t‐test.

References

    1. Matthay K. K., Maris J. M., Schleiermacher G., Nakagawara A., Mackall C. L., Diller L., Weiss W. A., Nat. Rev. Dis. Primers 2016, 2, 16078. - PubMed
    1. Sweet‐Cordero E. A., Biegel J. A., Science 2019, 363, 1170. - PMC - PubMed
    1. Capasso M., Montella A., Tirelli M., Maiorino T., Cantalupo S., Iolascon A., Front. Oncol. 2020, 10, 590033. - PMC - PubMed
    1. Bonfiglio F., Lasorsa V. A., Cantalupo S., D'Alterio G., Aievola V., Boccia A., Ardito M., Furini S., Renieri A., Morini M., Stainczyk S., Westermann F., Paolella G., Eva A., Iolascon A., Capasso M., EBioMedicine. 2023, 87, 104395. - PMC - PubMed
    1. Kim J., Vaksman Z., Egolf L. E., Kaufman R., Evans J. P., Conkrite K. L., Danesh A., Lopez G., Randall M. P., Dent M. H., Farra L. M., Menghani N. L., Dymek M., Desai H., Hausler R., Hicks B., Auvil J. G., Gerhard D. S., Hakonarson H., Maxwell K. N., Cole K. A., Pugh T. J., Bosse K. R., Khan J., Wei J. S., Maris J. M., Stewart D. R., Diskin S. J., J. Natl. Cancer Inst. 2024, 116, 149. - PMC - PubMed

MeSH terms

Substances

LinkOut - more resources