. 2025 Jun;16(3):e13868.
doi: 10.1002/jcsm.13868.

Development and Validation of Quantile Regression Forests for Prediction of Reference Quantiles in Handgrip and Chair-Stand Test

Affiliations

Development and Validation of Quantile Regression Forests for Prediction of Reference Quantiles in Handgrip and Chair-Stand Test

Giulia Giordano et al. J Cachexia Sarcopenia Muscle. 2025 Jun.

Abstract

Background: Muscle strength is one of the key components in the diagnosis of sarcopenia. The aim of this study was to train a machine learning model to predict reference values and percentiles for handgrip strength and chair-stand test (CST), in a large cohort of community dwellers recruited in the Longevity check-up (Lookup) 8+ project.

Methods: The longevity checkup project is an ongoing initiative conducted in unconventional settings in Italy from 1 June 2015. Eligible participants were 18+ years and provided written informed consent. After a 70/20/10 split in training, validation and test set, a quantile regression forest (QRF) was trained. Performance metrics were R-squared (R2), mean squared error (MSE), root mean squared error (RMSE) and mean Winkler interval score (MWIS) with 90% prediction coverage (PC). Metrics 95% confidence intervals (CI) were calculated using a bootstrap approach. Variable contribution was analysed using SHapley Additive exPlanations (SHAP) values. Probable sarcopenia (PS) was defined according to the European Working Group on Sarcopenia in Older People 2 (EWGSOP2) criteria.

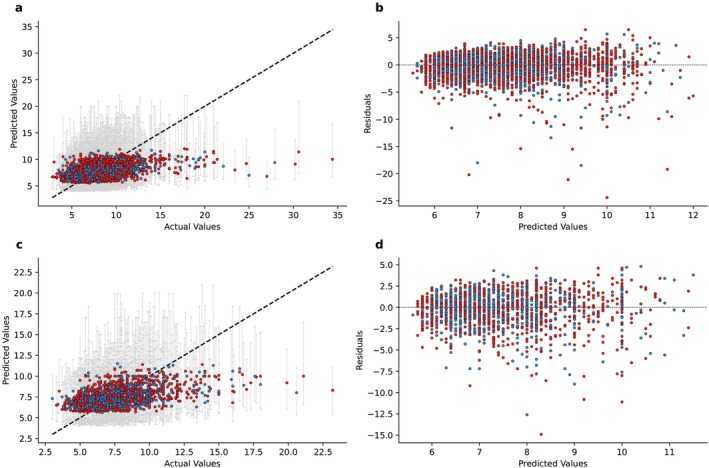
Results: Between 1 June 2015 and 23 November 2024, a total of 21 171 individuals were enrolled, of which 19 995 were included in our analyses. In the overall population, 11 019 (55.1%) were females. Median age was 56 years (IQR 47.0-67.0). Five variables were included: age, sex, height, weight and BMI. After the train/validation/test split, 13 996 subjects were included in the train set, 4199 in validation set and 1800 in the test set. For handgrip strength, the R2 was 0.65 (95% CI 0.63-0.67) in the validation set and 0.64 (95% CI 0.62-0.67) in the test set. PCs were 91.5% and 91.2%, respectively. For CST test, the R2 was 0.23 (95% CI 0.20-0.25) in the validation set and 0.24 (95% CI 0.20-0.28) in the test set. The PCs were 89.5% and 89.3%. Gender was the most influential variable for handgrip and age for CST. In the validation set, 23% of subjects in the first quartile for handgrip and 13% of subjects in the fourth quartile for CST test met criteria of PS.

Conclusions: We developed and validated a QRF model to predict subject-specific quantiles for handgrip and CST. These models hold promise for integration into clinical practice, facilitating cost-effective and time-efficient early identification of individuals at elevated risk of sarcopenia. The predictive outputs of these models may serve as surrogate biomarkers of the aging process, capturing functional decline.

Keywords: EWGSOP2; chair‐stand test; handgrip strength; machine learning; sarcopenia.


Conflict of interest statement

The authors declare no conflicts of interest.

Figures

FIGURE 1
FIGURE 1
Train set exploratory analysis. (a–d) After preprocessing, UMAP (number of neighbours = 15) was applied to the train set, and points were coloured according to the different variables. For age, darker colours (blues) correspond to older age. For handgrip and chair stand test, darker colours (purple) correspond to higher values. (e) Correlation heatmap displaying Spearman correlation coefficients. Red shades indicate positive correlations, whereas blue shades represent negative correlations.
FIGURE 2
FIGURE 2
Model evaluation: handgrip. (a) Comparison between predicted values (y axis) and actual values (x axis) in the validation set. Error bars indicate the 5th and 95th percentile. (b) Comparison between residuals (y axis) and predicted values (x axis) in the validation set. (c) Comparison between predicted values (y axis) and actual values (x axis) in the test set. Error bars indicate the 5th and 95th percentile. (d) Comparison between residuals (y axis) and predicted values (x axis) in the test set.
FIGURE 3
FIGURE 3
Variable contribution and interactions for handgrip on the validation set. (a) SHAP summary plot representing SHAP values (x axis) for each feature. Positive or negative SHAP values reflect whether the feature increases or decreases the model output, respectively. Each dot represents a subject, and the colour indicates the feature value. Male subjects are encoded as 1 and reported in blue. (b) Mean absolute SHAP values for each feature. (c, d) SHAP dependence plots exploring the relationship and interactions between features and their SHAP values, according to gender.
FIGURE 4
FIGURE 4
Model evaluation: chair stand test. (a) Comparison between predicted values (y axis) and actual values (x axis) in the validation set. Error bars indicate the 5th and 95th percentile. (b) Comparison between residuals (y axis) and predicted values (x axis) in the validation set. (c) Comparison between predicted values (y axis) and actual values (x axis) in the test set. Error bars indicate the 5th and 95th percentile. (d) Comparison between residuals (y axis) and predicted values (x axis) in the test set.
FIGURE 5
FIGURE 5
Variable contribution and interactions for chair stand test on the validation set. (a) SHAP summary plot representing SHAP values (x axis) for each feature. Positive or negative SHAP values reflect whether the feature increases or decreases the model output, respectively. Each dot represents a subject, and the colour indicates the feature value. Male subjects are encoded as 1 and reported in blue. (b) Mean absolute SHAP values for each feature. (c, d) SHAP dependence plots exploring the relationship and interactions between features and their SHAP values, according to gender.
FIGURE 6
FIGURE 6
Quantile analysis and model predictions. (a, b) Percentage of patients with probable sarcopenia (according to EWGSOP criteria) according to predicted handgrip quartiles (a) and deciles (b) in the validation set. Error bars represent 95% confidence intervals. (c, d) Percentage of patients with probable sarcopenia (according to EWGSOP criteria) according to predicted chair stand test quartiles (c) and deciles (d) in the validation set. Error bars represent 95% confidence intervals. (e, f) Example of predictions for a single patient. Black dots represent the actual values. (e) The bars represent the 10th, 25th, 50th, 75th and 90th quartile for handgrip (upper) and chair stand test (lower). (f) The lines represent the 10th, 25th, 50th, 75th and 90th quartile keeping the patient characteristics fixed across different decades.

References

    1. Anker S. D., Morley J. E., and von Haehling S., “Welcome to the ICD‐10 Code for Sarcopenia,” Journal of Cachexia, Sarcopenia and Muscle 7 (2016): 512–514. - PMC - PubMed
    1. Cruz‐Jentoft A. J., Baeyens J. P., Bauer J. M., et al., “Sarcopenia: European Consensus on Definition and Diagnosis,” Age and Ageing 39 (2010): 412–423. - PMC - PubMed
    1. Cruz‐Jentoft A. J., Bahat G., Bauer J., et al., “Sarcopenia: Revised European Consensus on Definition and Diagnosis,” Age and Ageing 48 (2019): 16–31. - PMC - PubMed
    1. Studenski S. A., Peters K. W., Alley D. E., et al., “The FNIH Sarcopenia Project: Rationale, Study Description, Conference Recommendations, and Final Estimates,” Journals of Gerontology. Series A, Biological Sciences and Medical Sciences 69, no. 5 (2014): 547–558, 10.1093/gerona/glu010. - DOI - PMC - PubMed
    1. Landi F., Calvani R., Martone A. M., et al., “Normative Values of Muscle Strength Across Ages in a ‘Real World’ Population: Results From the Longevity Check‐Up 7+ Project,” Journal of Cachexia, Sarcopenia and Muscle 11 (2020): 1562–1569. - PMC - PubMed