Decoding Hydrogel Porosity: Advancing the Structural Analysis of Hydrogels for Biomedical Applications
- PMID: 40525723
- PMCID: PMC12391661
- DOI: 10.1002/adhm.202500658
Decoding Hydrogel Porosity: Advancing the Structural Analysis of Hydrogels for Biomedical Applications
Abstract
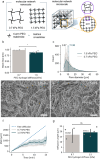
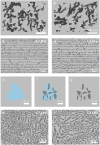
Hydrogels are essential biomaterials for biomedical applications, valued for their tunable properties and biocompatibility. A key feature influencing their function is porosity, which governs transport properties. Cryogenic scanning electron microscopy (cryo-SEM) is widely used to directly characterize porosity, but may introduce structural artifacts. Accurately characterizing the porosity of a hydrogel in its native state remains a challenge. Here, we characterized the hydrogel porosity in its native state using particle tracking assay and compared the results with cryo-SEM in polyethylene glycol (PEG) hydrogels. Both methods revealed the presence of micropores in PEG, likely arising from defects during polymerization. The equilibrium swelling assay showed nanoscale mesh sizes between polymer chains, distinct from the micron-scale pores. To overcome conventional limitations, we developed a novel three-dimensional (3D) pore reconstruction approach by leveraging the convex hull algorithm. The method enabled measurement of pore volume, surface area, sphericity, and size distribution. We found that cryo-SEM underestimates pore diameters due to the two-dimensional (2D) depiction, but after the 2D-to-3D conversion, remarkably similar pore dimensions are obtained. By advancing porosity analysis, this work provides insights for tailoring hydrogels to optimize interactions with cells, biomolecules, and therapeutic agents, opening avenues in drug delivery, tissue engineering, and other biomedical applications.
Keywords: convex hull algorithm; diffusion; hydrogel structure; packing algorithm; particle tracking; porosity characterization.
© 2025 The Author(s). Advanced Healthcare Materials published by Wiley‐VCH GmbH.
Conflict of interest statement
The authors declare no conflict of interest.
Figures


Similar articles
-
Prescription of Controlled Substances: Benefits and Risks.2025 Jul 6. In: StatPearls [Internet]. Treasure Island (FL): StatPearls Publishing; 2025 Jan–. 2025 Jul 6. In: StatPearls [Internet]. Treasure Island (FL): StatPearls Publishing; 2025 Jan–. PMID: 30726003 Free Books & Documents.
-
Unveiling the structure of protein-based hydrogels by overcoming cryo-SEM sample preparation challenges.Faraday Discuss. 2025 Aug 28;260(0):55-81. doi: 10.1039/d4fd00204k. Faraday Discuss. 2025. PMID: 40400330
-
In vitro characterization of 3D printed polycaprolactone/graphene oxide scaffolds impregnated with alginate and gelatin hydrogels for bone tissue engineering.J Biomater Appl. 2025 Sep;40(3):374-388. doi: 10.1177/08853282251336552. Epub 2025 Apr 25. J Biomater Appl. 2025. PMID: 40278887
-
Thermoresponsive polymers for cell support: poloxamers as a case study of promise and challenge.J Mater Chem B. 2025 Aug 6;13(31):9351-9376. doi: 10.1039/d5tb00588d. J Mater Chem B. 2025. PMID: 40662391 Review.
-
3D printing of hydrogel nanocomposites: A symbiotic union for advanced biomedical applications.Adv Colloid Interface Sci. 2025 Oct;344:103602. doi: 10.1016/j.cis.2025.103602. Epub 2025 Jul 15. Adv Colloid Interface Sci. 2025. PMID: 40684582 Review.
References
-
- Li X., Gong J. P., Nat. Rev. Mater. 2024, 9, 380.
-
- Jung M., Skhinas J. N., Du E. Y., Tolentino M. A. K., Utama R. H., Engel M., Volkerling A., Sexton A., O'Mahony A. P., Ribeiro J. C. C., Gooding J. J., Kavallaris M., Biomater. Sci. 2022, 10, 5876. - PubMed
-
- Engler A. J., Sen S., Sweeney H. L., Discher D. E., Cell 2006, 126, 677. - PubMed
MeSH terms
Substances
Grants and funding
LinkOut - more resources
Full Text Sources

