. 2025 Jul 9;16(7):e0050925.
doi: 10.1128/mbio.00509-25. Epub 2025 Jun 17.

Will gut, oral, and vaginal microbiota influence the outcome of FET or be influenced by FET? A pilot study

Affiliations

Will gut, oral, and vaginal microbiota influence the outcome of FET or be influenced by FET? A pilot study

Zhao Zhang et al. mBio. .

Erratum in

Abstract

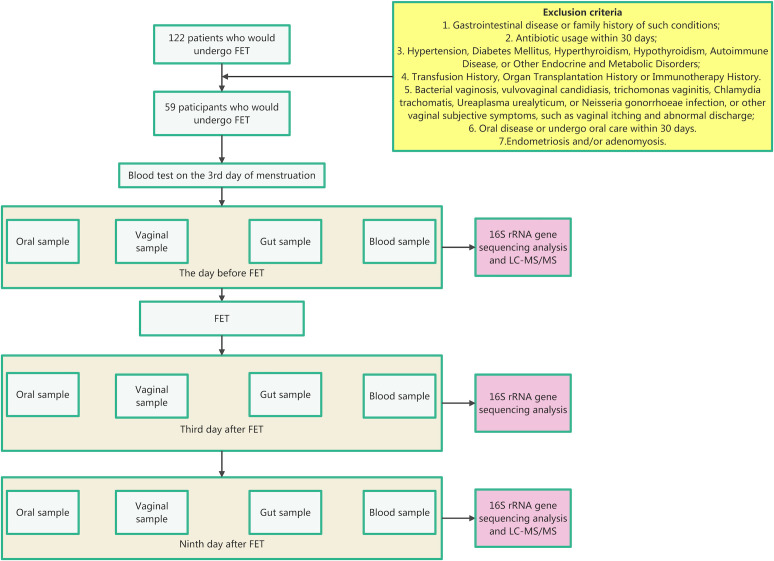
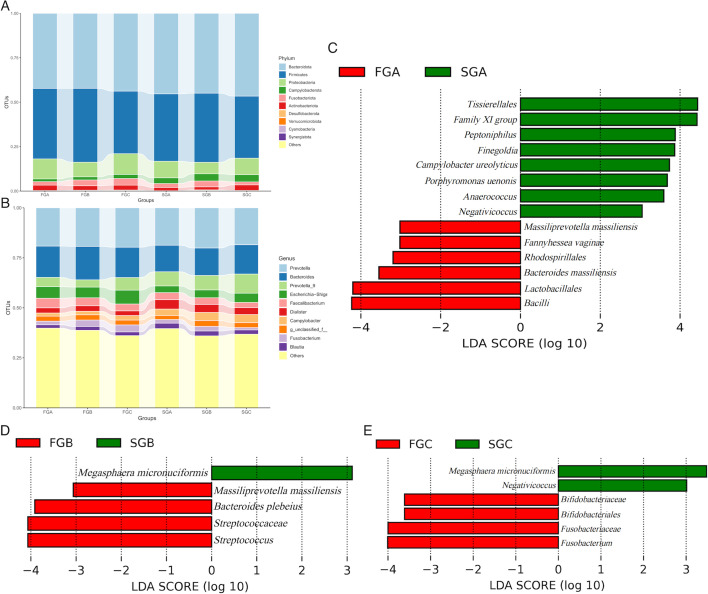
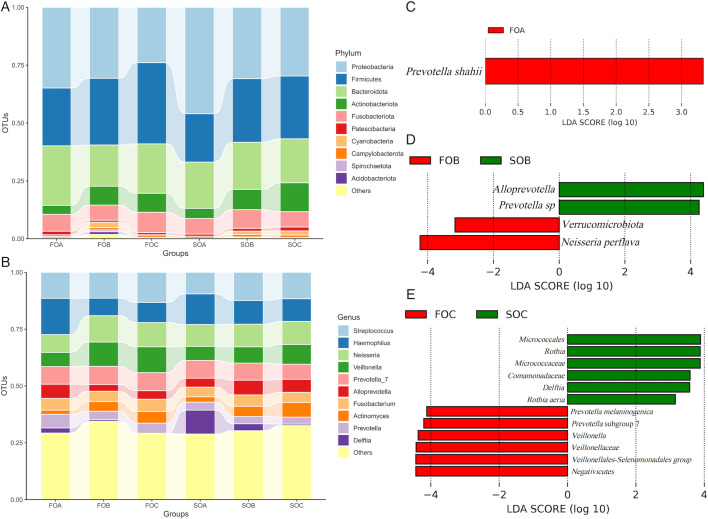
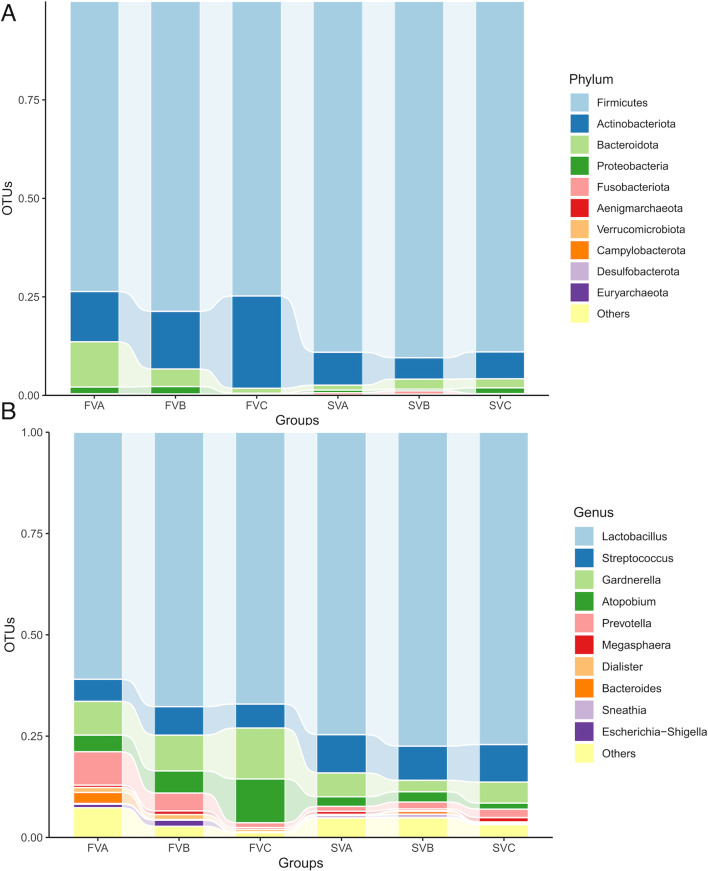
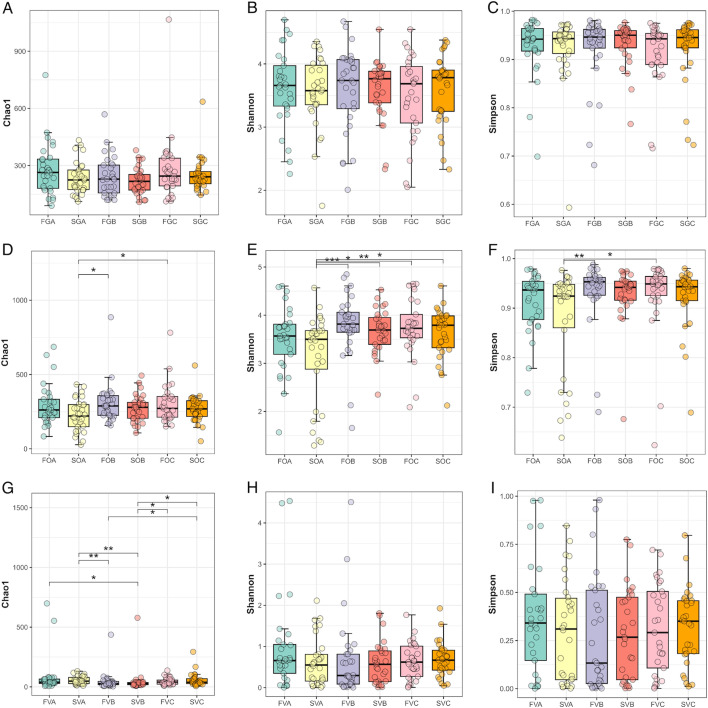
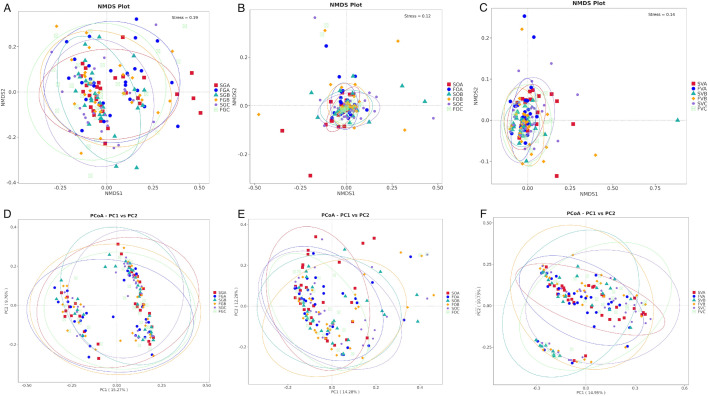
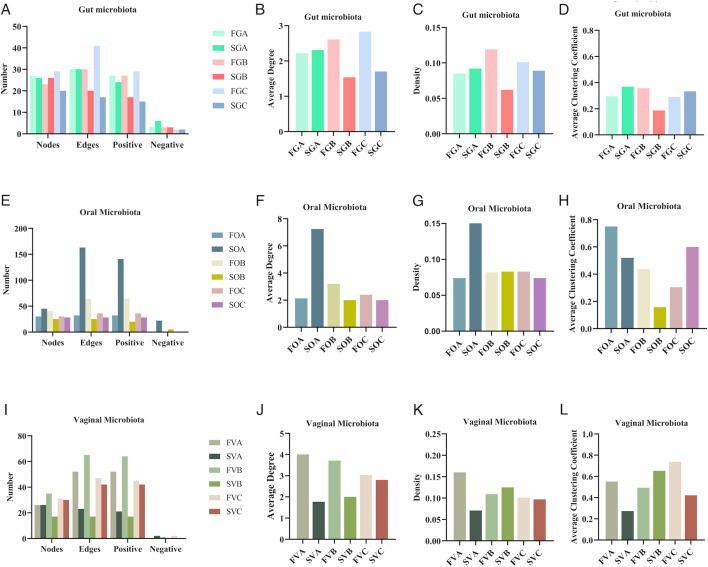
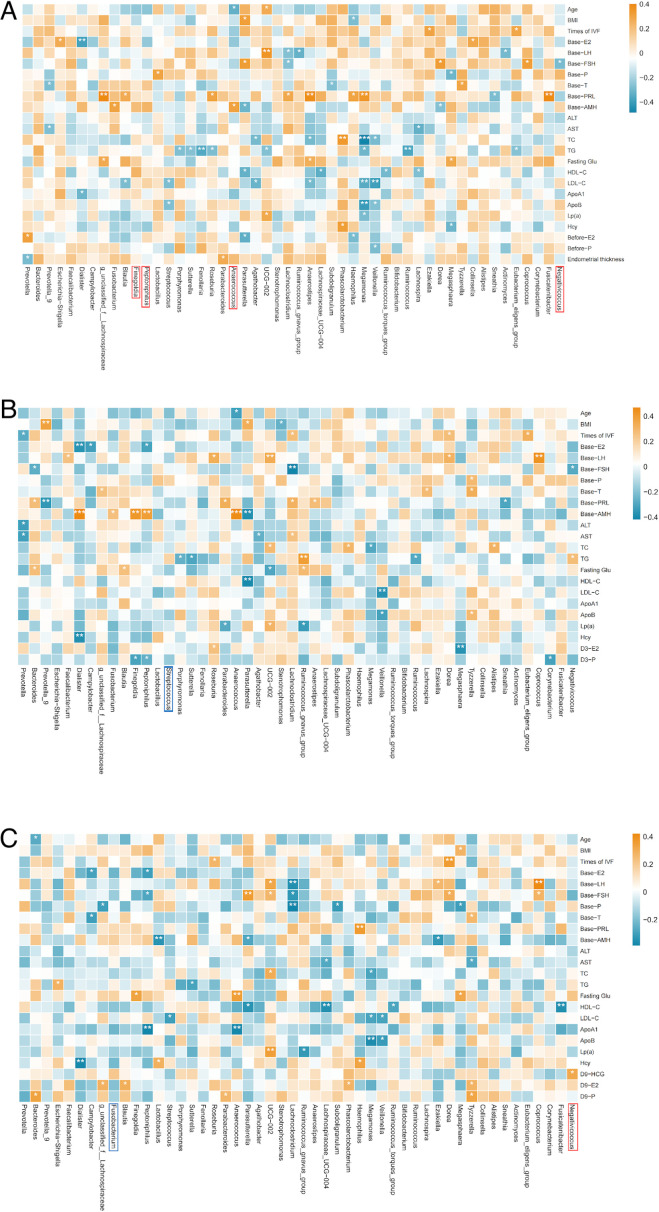
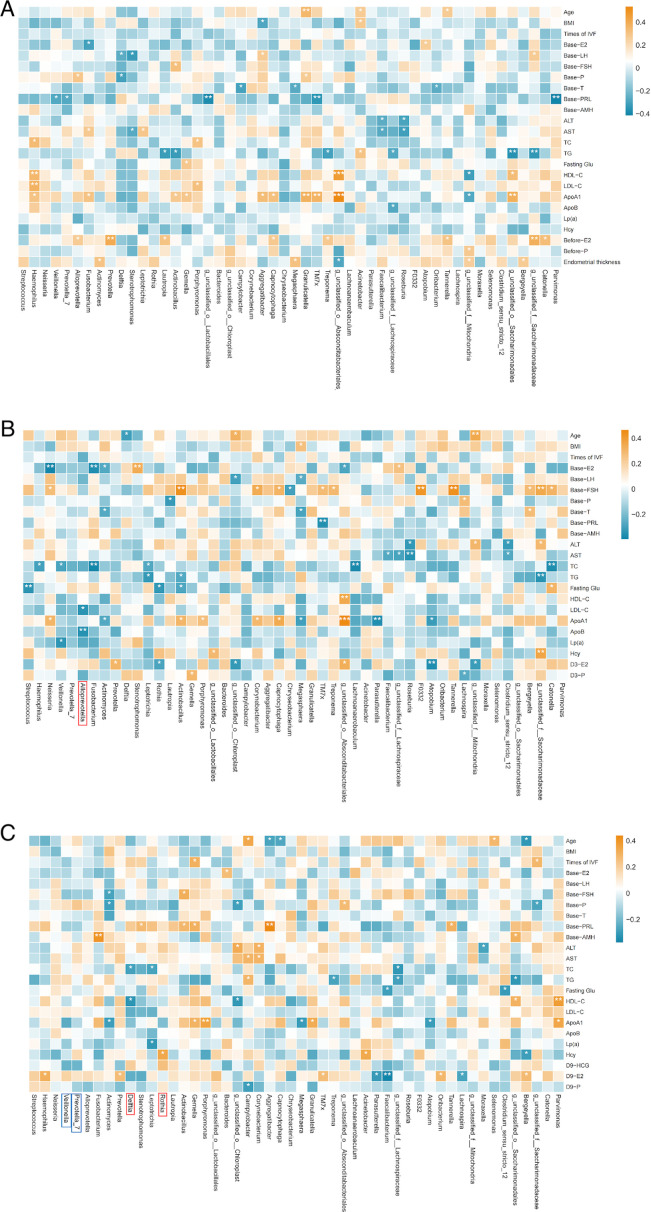
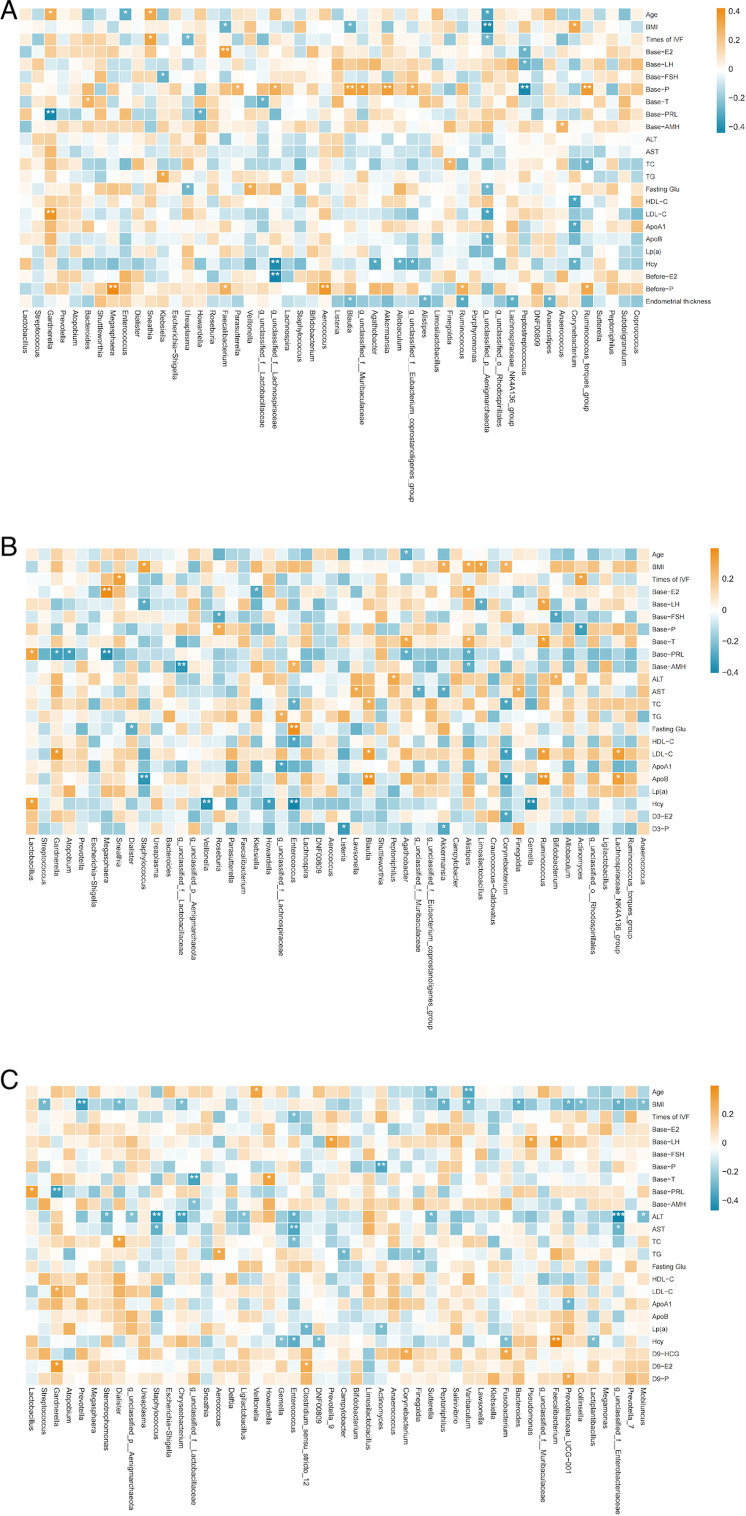
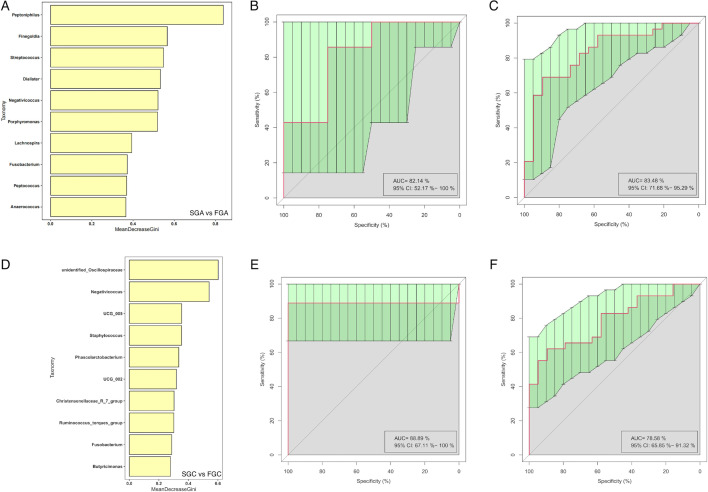
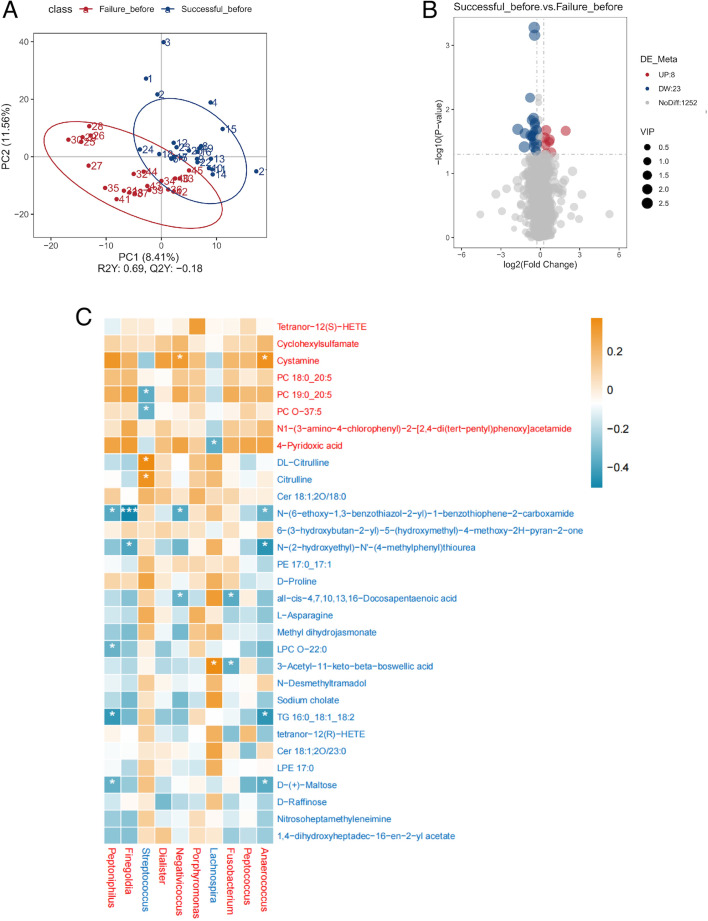
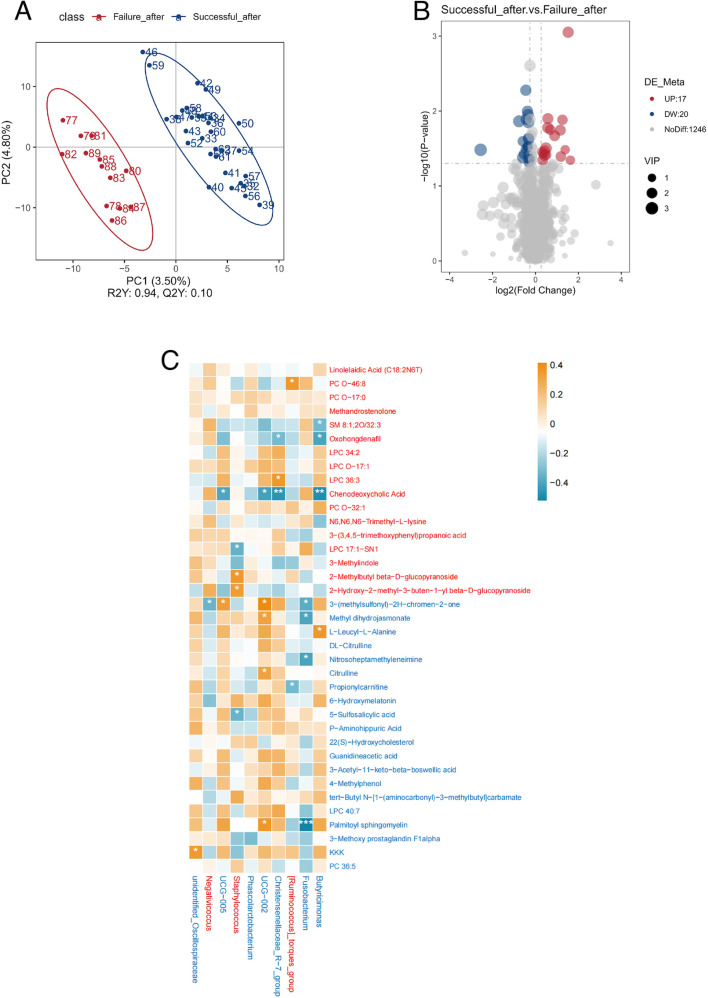
This study aims to examine the specific relationships between gut, oral, and vaginal microbiota and the frozen embryo transfer (FET) process. Patients undergoing fertility treatment who met the inclusion criteria were included in this study. After sampling at three time points, participants were then divided into two groups: the failure group and the success group, based on whether a viable intrauterine pregnancy was confirmed. In this pilot study, we systematically examined changes in the gut, oral, and vaginal microbiota at various stages of the FET process using 16S rDNA high-throughput sequencing and investigated their respective associations with FET outcomes. Metabolomics and random forest were used for evaluating the relationship between gut microbiota and metabolites during FET. Our findings indicate that while the gut microbiota underwent the least change throughout FET, it exhibited the greatest differences between success and failure groups. The oral and vaginal microbiota exhibited significant fluctuations. However, the differences in oral microbiota between the success and failure groups changed with the FET process, while the vaginal microbiota did not show any differences. Notably, two key gut genera, Anaerococcus and Negativicoccus, were identified as genera significantly associated with FET outcomes. Additionally, specific gut microbiota and metabolite profiles displayed significant correlations with FET success, particularly highlighting the potential relevance of cystamine before FET. These findings suggest that targeting microbiota-associated metabolic pathways may serve as a potential strategy to enhance FET success rates and provide new biomarkers for clinical prediction and intervention.IMPORTANCEThis study explores the potential role of microbiota in influencing FET outcomes. Through an analysis of gut, oral, and vaginal microbiota, we observed notable differences between success and failure groups, particularly in gut microbiota. Genera such as Anaerococcus and Negativicoccus, along with associated metabolic profiles, may offer insights into underlying mechanisms. These findings contribute to a growing understanding of the interplay between microbiota and reproductive outcomes and suggest that targeting microbiota-associated metabolic pathways could be a promising direction for enhancing FET success rates. This research highlights potential biomarkers and therapeutic avenues for further exploration in fertility treatments.

Keywords: frozen embryo transfer; gut microbiota; metabolism; oral microbiota; vaginal microbiota.


Conflict of interest statement

The authors declare no conflict of interest.

Figures

Fig 1
Fig 1
Flowchart of our study. LC-MS/MS, liquid chromatography–tandem mass spectrometry.
Fig 2
Fig 2
(A) Bar chart of gut microbiota in each group during the FET process at the phylum level. (B) Bar chart of gut microbiota in each group during the FET process at the genus level. (C–E) Bar plots showing the different taxa with a linear discriminant analysis (LDA) score of >3 and P < 0.05. The distance between each point represents the degree of difference in the microbiome of each sample. The length of the bars represents the magnitude of the impact of differential species.
Fig 3
Fig 3
(A) Bar chart of oral microbiota in each group during the FET process at the phylum level. (B) Bar chart of oral microbiota in each group during the FET process at the genus level. (C–E) Bar plot showing the different taxa with an LDA score of >3 and P < 0.05. The distance between each point represents the degree of difference in the microbiome of each sample. The length of the bars represents the magnitude of the impact of differential species.
Fig 4
Fig 4
(A) Bar chart of vaginal microbiota in each group during the FET process at the phylum level. (B) Bar chart of vaginal microbiota in each group during the FET process at the genus level. OTU, operational taxonomic unit.
Fig 5
Fig 5
Alpha diversity of each microbiota during the FET process is shown as a boxplot (mean ± SD). (A) Chao1 index of gut microbiota in each group. (B) Shannon index of gut microbiota in each group. (C) Simpson index of gut microbiota in each group. (D) Chao1 index of oral microbiota in each group. (E) Shannon index of oral microbiota in each group. (F) Simpson index of oral microbiota in each group. (G) Chao1 index of vaginal microbiota in each group. (H) Shannon index of vaginal microbiota in each group. (I) Simpson index of vaginal microbiota in each group.
Fig 6
Fig 6
Beta diversity (as assessed by the unweighted UniFrac NMDS and PCoA) of samples in each group. The distance between each point represents the degree of difference in the microbiome of each sample. (A) NMDS of gut microbiota. Stress value (0–1) is a measure of the error between the original distance and the low-dimensional spatial distance obtained by NMDS. The lower stress value (usually <0.05) indicates a very good fit. (B) NMDS of oral microbiota. (C) NMDS of vaginal microbiota. (D) PCoA of gut microbiota. (E) PCoA of oral microbiota. (F) PCoA of vaginal microbiota.
Fig 7
Fig 7
Topological properties of microbial networks. (A) Nodes, edges, and positive and negative correlations of gut microbiota networks. (B) Average degree of gut microbiota networks. (C) Density of gut microbiota networks. (D) Average clustering coefficient of gut microbiota networks. (E) Nodes, edges, and positive and negative correlations of oral microbiota networks. (F) Average degree of oral microbiota networks. (G) Density of oral microbiota networks. (H) Average clustering coefficient of oral microbiota networks. (I) Nodes, edges, and positive and negative correlations of vaginal microbiota networks. (J) Average degree of vaginal microbiota networks. (K) Density of vaginal microbiota networks. (L) Average clustering coefficient of vaginal microbiota networks.
Fig 8
Fig 8
Spearman correlation heatmap of gut microbiota and clinical outcomes in different groups. (A) Correlation between gut microbiota before FET and clinical results. (B) Correlation between gut microbiota on the third day post-FET and clinical results. (C) Correlation between gut microbiota on the ninth day post-FET and clinical results. Red squares represent positive correlation; blue squares represent negative correlation. Red frames represent more abundance evaluated by LEfSe in the successful group. Blue frames represent more abundance evaluated by LEfSe in the failure group. *P < 0.05, **P < 0.01, ***P < 0.001. ALT, alanine aminotransferase; AST, aspartate aminotransferase; TC, total cholesterol; TG, triglyceride.
Fig 9
Fig 9
Spearman correlation heatmap of oral microbiota and clinical outcomes in different groups. (A) Correlation between oral microbiota before FET and clinical results. (B) Correlation between oral microbiota on the third day post-FET and clinical results. (C) Correlation between oral microbiota on the ninth day post-FET and clinical results. Red squares represent positive correlation; blue squares represent negative correlation. Red frames represent more abundant evaluated by LEfSe in the successful group. Blue frames represent more abundance evaluated by LEfSe in the failure group. *P < 0.05, **P < 0.01, ***P < 0.001.
Fig 10
Fig 10
Spearman correlation heatmap of vaginal microbiota and clinical outcomes in different groups. (A) Correlation between vaginal microbiota before FET and clinical results. (B) Correlation between vaginal microbiota on the third day post-FET and clinical results. (C) Correlation between vaginal microbiota on the ninth day post-FET and clinical results. Red squares represent positive correlation; blue squares represent negative correlation. Red frames represent more abundance evaluated by LEfSe in the successful group. Blue frames represent more abundance evaluated by LEfSe in the failure group. *P < 0.05, **P < 0.01, ***P < 0.001.
Fig 11
Fig 11
Random forest results for gut microbiota before FET and on the ninth day post-FET. (A) Top 10 gut bacterial genus before FET selected by MeanDecreaseGini. The length of the bar represents the importance that distinguishes the failure group and the successful group. (B) AUC of test set for gut microbiota before FET. (C) AUC of train set for gut microbiota before FET. (D) Top 10 gut bacterial genus on the ninth day post-FET selected by MeanDecreaseGini. (E) AUC of test set for gut microbiota on the ninth day post-FET. (F) AUC of train set for gut microbiota on the ninth day post-FET.
Fig 12
Fig 12
(A) PLS-DA for metabolites before FET in the successful group and the failure group. The distance between each point represents the degree of difference in the metabolites of each sample. (B) Volcano plots were used to filter metabolites of interest based on log2(fold change) and −log10(P value) of metabolites. Up (UP) represents having a higher concentration in the successful group. Down (DW) represents having a higher concentration in the failure group. (C) Spearman correlation heatmap of different metabolites and bacterial genus selected by random forest in the failure group and the successful group before FET. Red squares represent positive correlation; blue squares represent negative correlation. Red metabolite or bacterial genus represents more abundance in the successful group. Blue metabolite or bacterial genus represents more abundance evaluated in the failure group. *P < 0.05; **P < 0.01; ***P < 0.001.
Fig 13
Fig 13
(A) PLS-DA for metabolites on the ninth day post-FET in the successful group and the failure group. The distance between each point represents the degree of difference in the metabolites of each sample. (B) Volcano plots were used to filter metabolites of interest based on log2(fold change) and −log10(P value) of metabolites. Up (UP) represents having a higher concentration in the successful group. Down (DW) represents having a higher concentration in the failure group. (C) Spearman correlation heatmap of different metabolites and bacterial genus selected by random forest in the failure group and the successful group in the ninth day post-FET. Red squares represent positive correlation; blue squares represent negative correlation. Red metabolite or bacterial genus represents more abundance in the successful group. Blue metabolite or bacterial genus represents more abundance evaluated in the failure group. *P < 0.05; **P < 0.01; ***P < 0.001.

Similar articles

References

    1. Hu P, Pan J, Liu X, Huang H. 2024. Reproductive health-oriented development in assisted reproductive technologies. Sichuan Da Xue Xue Bao Yi Xue Ban 55:501–506. doi: 10.12182/20240560401 - DOI - PMC - PubMed
    1. Kindinger LM, Bennett PR, Lee YS, Marchesi JR, Smith A, Cacciatore S, Holmes E, Nicholson JK, Teoh TG, MacIntyre DA. 2017. The interaction between vaginal microbiota, cervical length, and vaginal progesterone treatment for preterm birth risk. Microbiome 5:6. doi: 10.1186/s40168-016-0223-9 - DOI - PMC - PubMed
    1. Zhao C, Wei Z, Yang J, Zhang J, Yu C, Yang A, Zhang M, Zhang L, Wang Y, Mu X, Heng X, Yang H, Gai Z, Wang X, Zhang L. 2020. Characterization of the vaginal microbiome in women with infertility and its potential correlation with hormone stimulation during in vitro fertilization surgery. mSystems 5:e00450-20. doi: 10.1128/mSystems.00450-20 - DOI - PMC - PubMed
    1. Carosso A, Revelli A, Gennarelli G, Canosa S, Cosma S, Borella F, Tancredi A, Paschero C, Boatti L, Zanotto E, Sidoti F, Bottino P, Costa C, Cavallo R, Benedetto C. 2020. Controlled ovarian stimulation and progesterone supplementation affect vaginal and endometrial microbiota in IVF cycles: a pilot study. J Assist Reprod Genet 37:2315–2326. doi: 10.1007/s10815-020-01878-4 - DOI - PMC - PubMed
    1. Koedooder R, Singer M, Schoenmakers S, Savelkoul PHM, Morré SA, de Jonge JD, Poort L, Cuypers WJSS, Beckers NGM, Broekmans FJM, Cohlen BJ, den Hartog JE, Fleischer K, Lambalk CB, Smeenk JMJS, Budding AE, Laven JSE. 2019. The vaginal microbiome as a predictor for outcome of in vitro fertilization with or without intracytoplasmic sperm injection: a prospective study. Hum Reprod 34:1042–1054. doi: 10.1093/humrep/dez065 - DOI - PubMed

Substances

LinkOut - more resources