. 2025 Jun 2;66(6):55.
doi: 10.1167/iovs.66.6.55.

Identifying Retinal Features Using a Self-Configuring CNN for Clinical Intervention

Affiliations

Identifying Retinal Features Using a Self-Configuring CNN for Clinical Intervention

Daniel S Kermany et al. Invest Ophthalmol Vis Sci. .

Abstract

Purpose: Retinal diseases are leading causes of blindness worldwide, necessitating accurate diagnosis and timely treatment. Optical coherence tomography (OCT) has become a universal imaging modality of the retina in the past 2 decades, aiding in the diagnosis of various retinal conditions. However, the scarcity of comprehensive, annotated OCT datasets, that are labor-intensive to assemble, has hindered the advancement of artificial intelligence (AI)-based diagnostic tools.

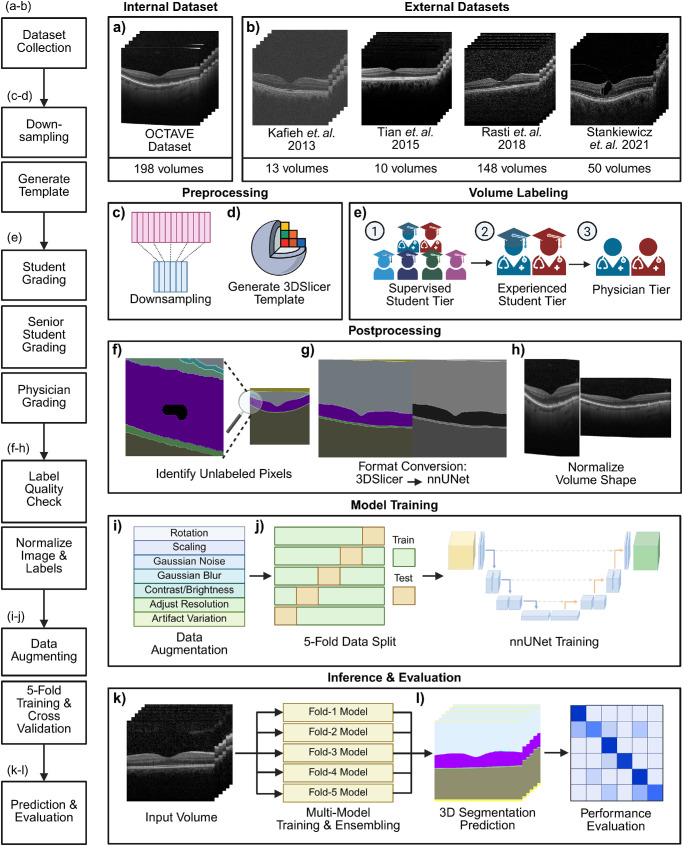
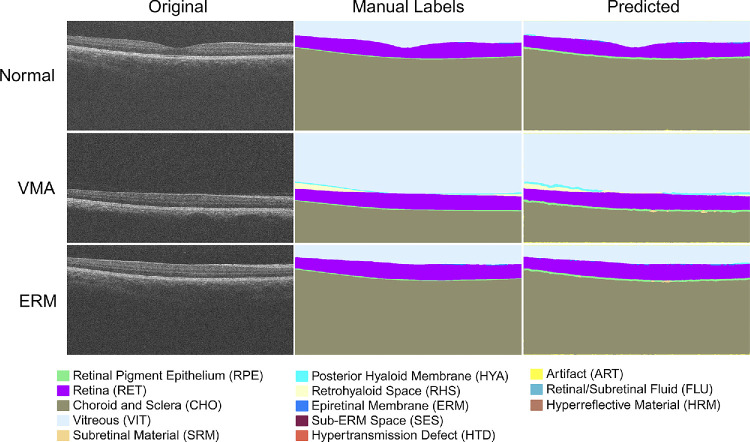
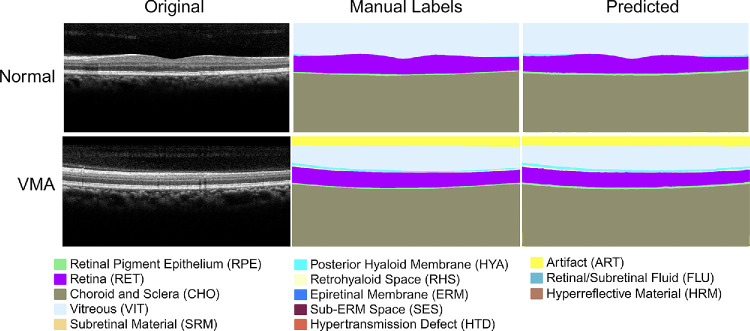
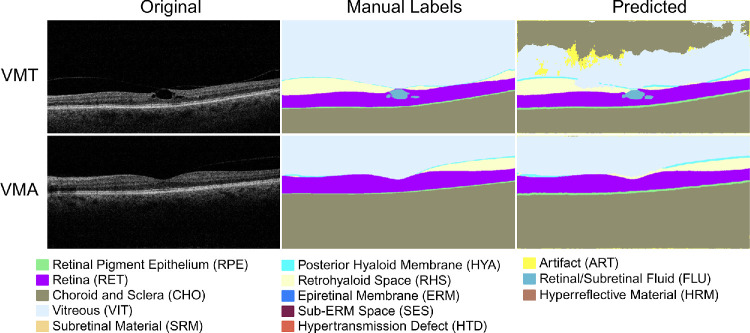
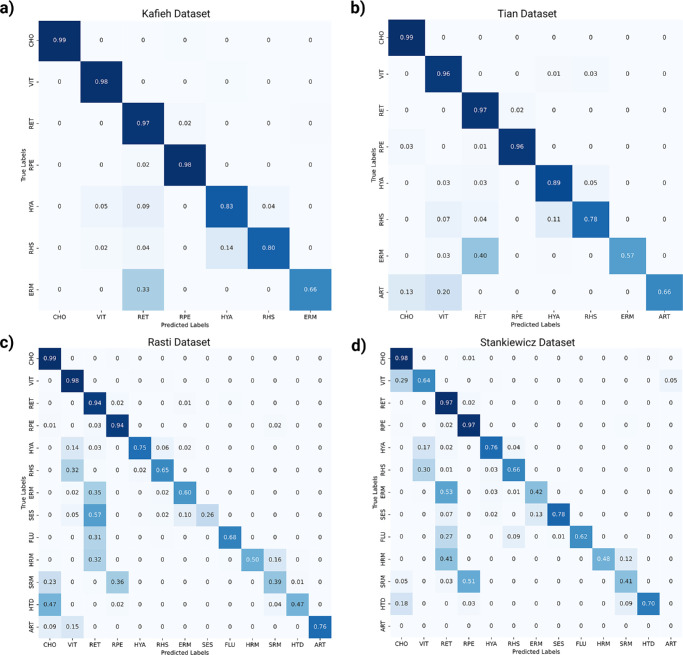
Methods: To address the lack of annotated OCT segmentation datasets, we introduce OCTAVE, an extensive 3D OCT dataset with high-quality, pixel-level annotations for anatomic and pathological structures. Additionally, we provide similar annotations for four independent public 3D OCT datasets, enabling their use as external validation sets. To demonstrate the potential of this resource, we train a deep learning segmentation model using the self-configuring no-new-U-Net (nnU-Net) framework and evaluate its performance across all four external validation sets.

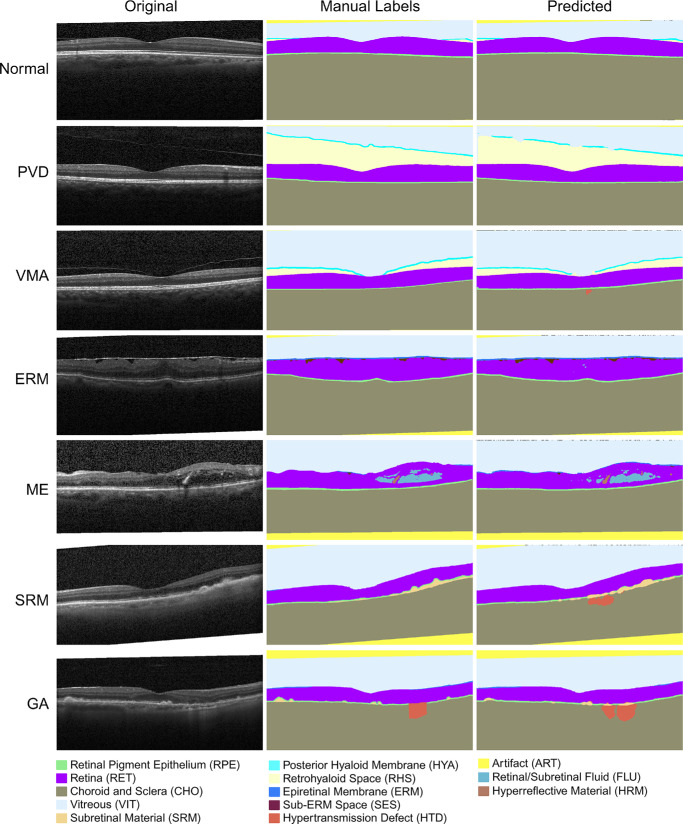
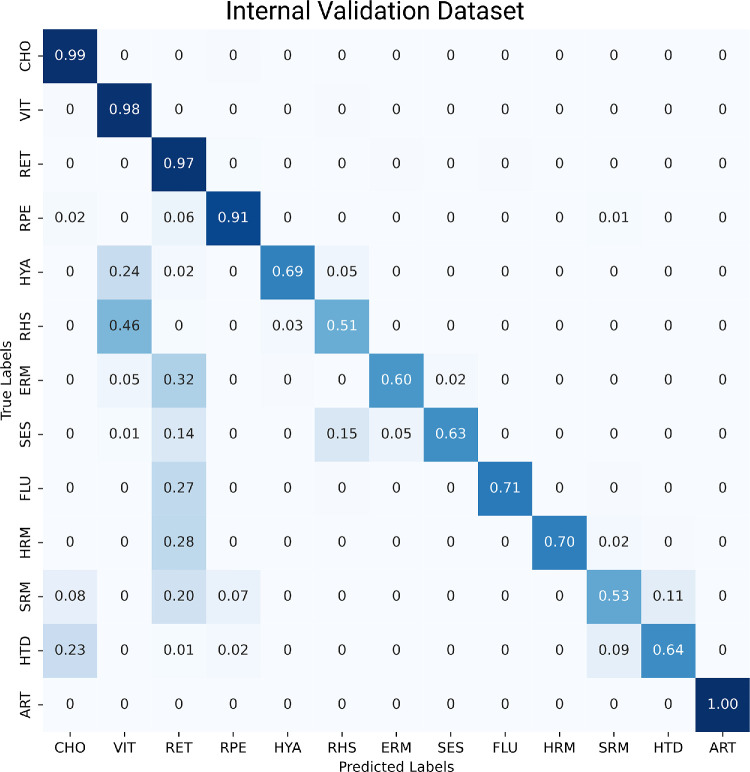
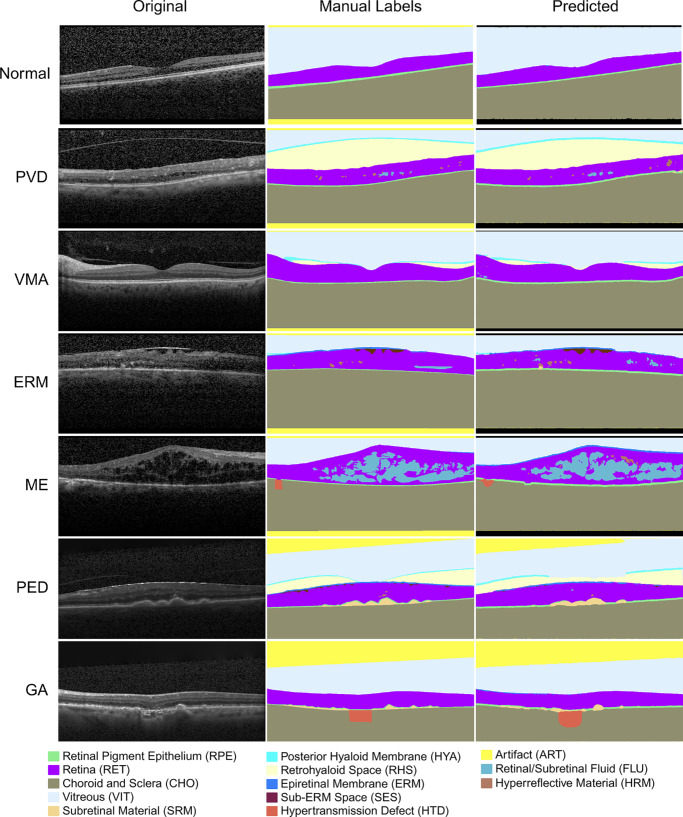
Results: The OCTAVE dataset collected consists of 198 OCT volumes (3762 B-scans) used for training and 221 OCT volumes (4109 B-scans) for external validation. The trained deep learning model demonstrates clinically significant performance across all retinal structures and pathological features.

Conclusions: We demonstrate robust segmentation performance and generalizability across independently collected datasets. OCTAVE bridges the gap in publicly available datasets, supporting the development of AI tools for precise disease detection, monitoring, and treatment guidance. This resource has the potential to improve clinical outcomes and advance AI-driven retinal disease management.


Conflict of interest statement

Disclosure: D.S. Kermany, None; W. Poon, None; A. Bawiskar, None; N. Nehra, None; O. Davarci, None; G. Das, None; M. Vasquez, None; S. Schaal, None; R. Raghunathan, None; S.T.C. Wong, None

Figures

Figure 1.
Figure 1.
Pipeline of OCT volume processing, labeling, model training, and evaluation. (a) OCTAVE dataset of 198 OCT volumes used for model training and internal cross-validation. (b) External validation sets used for model performance testing and not included in the training process. These validation sets consist of 13 volumes from Kafieh et al. 2013, 10 volumes from Tian et al. 2015, 148 volumes from Rasti et al. 2018, and 50 volumes from Stankiewicz et al. 2021. (c) All volumes were downsampled to 19 b-scans to keep model inputs consistent and reduce labor required for manual labeling. (d) Empty 3D Slicer template files containing all necessary metadata required for labeling were generated using a script to reduce start-up time and user error during the manual labeling process. (e) Manual labeling was conducted under a three-tier grading procedure in which (1) trained and supervised students label straightforward features and normal anatomy, (2) experienced senior students confirm accuracy of these labels and label pathological features, and (3) senior students consult with ophthalmologists to reconcile any ambiguous features and verify accurate labeling. (f) Developed tool to identify any unlabeled pixels within volume that had undergone the three-tiered process. (g) Automated method to convert from the 3D Slicer NRRD format segmentation labels to the TIFF format required by the nnU-Net library. (h) The external validation datasets were reshaped to match the height and width of the OCTAVE training set. (i) Data augmentation methods randomly applied to each volume during training. (j) Model training was conducted over 5 distinct 80:20 training/validation splits of the OCTAVE dataset using the nnU-Net self-configuring deep learning architecture. (k) During inference and evaluation, an input volume is fed through the five distinct trained models. (l) The model outputs are ensembled to generate a final segmentation, which is used to calculate performance metrics. OCT, optical coherence tomography.
Figure 2.
Figure 2.
The various OCT presentations represented within the OCTAVE dataset, including normal, PVD, VMA, ERM, ME, SRM, and GA. The left column depicts an OCT b-scan, the middle column depicts the corresponding ground-truth label, and the right column depicts the prediction using the trained model ensemble. ERM, epiretinal membrane; GA, geographic atrophy; ME, macular edema; OCT, optical coherence tomography; PVD, posterior vitreous detachment; SRM, subretinal material; VMA, vitreomacular adhesion.
Figure 3.
Figure 3.
Normalized confusion tables depict pixel-level accuracy in predicting segmentation labels within internal cross-validation. In cross-validation, each case contributed to validation once and training in the remaining four folds, allowing for comprehensive evaluation across all volumes. Each square within this table represents the proportion of the cases in each row (true labels) that have been predicted as the label corresponding with that column (predictions). For each row, the diagonal values represent the sensitivity for each label and the sum of all values per row, excluding the diagonal element, represents the false negative rate for that label. Labels that did not have any instances within a specific dataset were excluded from that dataset's confusion matrix. This normalized confusion matrix depicts the internal OCTAVE cross-validation set. ART, artifact; CHO, choroid and sclera; ERM, epiretinal membrane; FLU, intra-/sub-retinal fluid; HRM, hyper-reflective material; HTD, hypertransmission defect; HYA, hyaloid membrane; SES, sub-epiretinal membrane space; SRM, subretinal material; RET, retina; RHS, retrohyaloid space; RPE, retinal pigment epithelium; VIT, vitreous.
Figure 4.
Figure 4.
OCT represented within the Rasti dataset, including normal, PVD, VMA, ERM, ME, PED, and GA. The left column depicts an OCT b-scan, the middle column depicts the corresponding ground-truth label, and the right column depicts the prediction using the trained model ensemble. ERM, epiretinal membrane; GA, geographic atrophy; OCT, optical coherence tomography; ME, macular edema; PED, pigment epithelial detachment; PVD, posterior vitreous detachment; VMA, vitreomacular adhesion.
Figure 5.
Figure 5.
OCT represented within the Kafieh dataset, including normal, VMA, and ERM. The left column depicts an OCT b-scan, the middle column depicts the corresponding ground-truth label, and the right column depicts the prediction using the trained model ensemble. ERM, epiretinal membrane; OCT, optical coherence tomography; VMA, vitreomacular adhesion.
Figure 6.
Figure 6.
OCT represented within the Tian dataset, including normal and VMA. The left column depicts an OCT b-scan, the middle column depicts the corresponding ground-truth label, and the right column depicts the prediction using the trained model ensemble. OCT, optical coherence tomography; VMA, vitreomacular adhesion.
Figure 7.
Figure 7.
OCT represented within the Stankiewicz dataset, including normal, VMA, and VMT. The left column depicts an OCT b-scan, the middle column depicts the corresponding ground-truth label, and the right column depicts the prediction using the trained model ensemble. OCT, optical coherence tomography; VMA, vitreomacular adhesion; VMT, vitreomacular traction.
Figure 8.
Figure 8.
Normalized confusion tables depict pixel-level accuracy of the trained model ensemble in predicting segmentation labels within the external validation datasets. Each square within this table represents the proportion of the cases in each row (true labels) that have been predicted as the label corresponding with that column (predictions). For each row, the diagonal values represent the sensitivity for each label and the sum of all values per row, excluding the diagonal element, represents the false negative rate for that label. Labels that did not have any instances within a specific dataset were excluded from that dataset's confusion matrix. The datasets featured include (a) the Kafieh dataset, (b) the Tian dataset, (c) the Rasti dataset, and (d) the Stankiewicz dataset. ART, artifact; CHO, choroid and sclera; ERM, epiretinal membrane; FLU, intra-/sub-retinal fluid; HTD, hypertransmission defect; HRM, hyper-reflective material; HYA, hyaloid membrane; SES, sub-epiretinal membrane space; SRM, subretinal material; RET, retina; RHS, retrohyaloid space; RPE, retinal pigment epithelium VIT, vitreous.

Similar articles

References

    1. Duh EJ, Sun JK, Stitt AW. Diabetic retinopathy: current understanding, mechanisms, and treatment strategies. JCI Insight. 2017; 2(14): e93751. - PMC - PubMed
    1. Fung AT, Galvin J, Tran T. Epiretinal membrane: a review. Clin Exp Ophthalmol. 2021; 49(3): 289–308. - PubMed
    1. Phillips JD, Hwang ES, Morgan DJ, Creveling CJ, Coats B. Structure and mechanics of the vitreoretinal interface. J Mech Behav Biomed Mater. 2022; 134: 105399. - PMC - PubMed
    1. Wong WL, Su X, Li X, et al.. Global prevalence of age-related macular degeneration and disease burden projection for 2020 and 2040: a systematic review and meta-analysis. Lancet Glob Health. 2014; 2(2): e106–e116. - PubMed
    1. Liu L, Swanson M. Improving patient outcomes: role of the primary care optometrist in the early diagnosis and management of age-related macular degeneration. Clin Optom. 2013; 5: 1–12.