

Novel tools for comparing the architecture of psychopathology between neurogenetic disorders: An application to X- versus Y-chromosome aneuploidy effects in males
- PMID: 40525963
- PMCID: PMC12180508
- DOI: 10.1017/S0033291725000765
Novel tools for comparing the architecture of psychopathology between neurogenetic disorders: An application to X- versus Y-chromosome aneuploidy effects in males
Abstract
Background: Psychiatric symptoms are typically highly inter-correlated at the group level. Collectively, these correlations define the architecture of psychopathology - informing taxonomic and mechanistic models in psychiatry. However, to date, it remains unclear if this architecture differs between etiologically distinct subgroups, despite the core relevance of this understanding for personalized medicine. Here, we introduce a new analytic pipeline to probe group differences in the psychopathology architecture - demonstrated through the comparison of two distinct neurogenetic disorders.
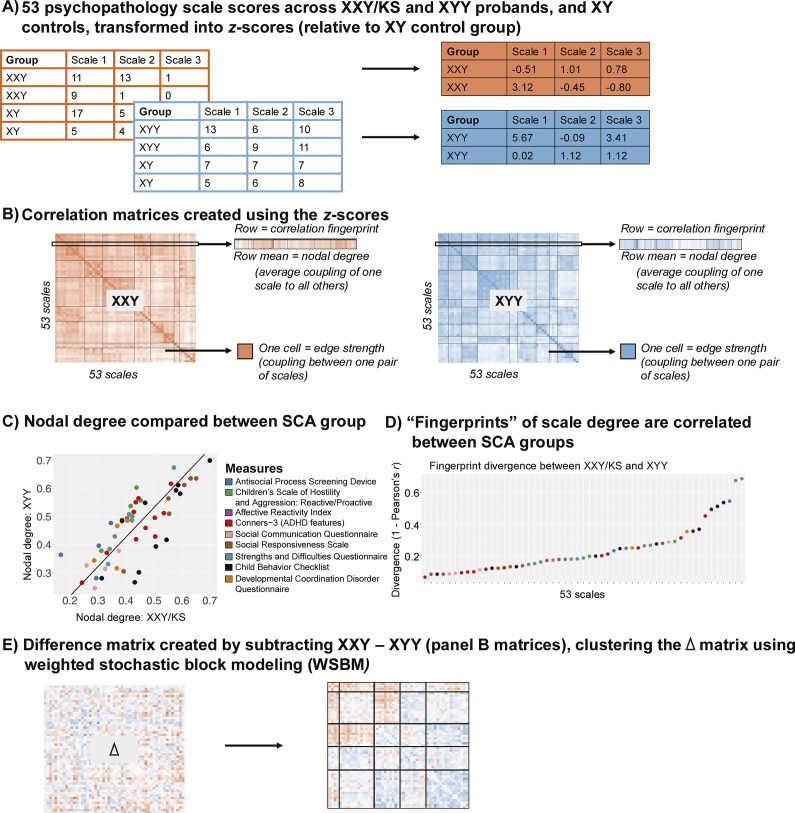
Methods: We use a large questionnaire battery in 300 individuals aged 5-25 years (n = 102 XXY/KS, n = 64 XYY, n = 134 age-matched XY) to characterize the structure of correlations among 53 diverse measures of psychopathology in XXY/KS and XYY syndrome - enabling us to compare the effects of X- versus Y-chromosome dosage on the architecture of psychopathology at multiple, distinctly informative levels.
Results: Behavior correlation matrices describe the architecture of psychopathology in each syndrome. A comparison of matrix rows reveals that social problems and externalizing symptoms are most differentially coupled to other aspects of psychopathology in XXY/KS versus XYY. Clustering the difference between matrices captures coordinated group differences in pairwise coupling between measures of psychopathology: XXY/KS shows greater coherence among externalizing, internalizing, and autism-related features, while XYY syndrome shows greater coherence in dissociality and early neurodevelopmental impairment.
Conclusions: These methods offer new insights into X- and Y-chromosome dosage effects on behavior, and our shared code can now be applied to other clinical groups of interest - helping to hone mechanistic models and inform the tailoring of care.
Keywords: Jacobs syndrome; Klinefelter syndrome; XXY/KS; XYY; behavioral phenotyping; gene dosage disorders; sex chromosome aneuploidy; symptom network analysis.
Conflict of interest statement
The authors have no conflicts of interest to declare.
Figures


Update of
-
Novel tools for comparing the architecture of psychopathology between neurogenetic disorders: An application to X- vs. Y-chromosome aneuploidy effects in males.medRxiv [Preprint]. 2025 Jan 13:2025.01.10.25320352. doi: 10.1101/2025.01.10.25320352. medRxiv. 2025. Update in: Psychol Med. 2025 Jun 17;55:e166. doi: 10.1017/S0033291725000765. PMID: 40568669 Free PMC article. Updated. Preprint.
Similar articles
-
Novel tools for comparing the architecture of psychopathology between neurogenetic disorders: An application to X- vs. Y-chromosome aneuploidy effects in males.medRxiv [Preprint]. 2025 Jan 13:2025.01.10.25320352. doi: 10.1101/2025.01.10.25320352. medRxiv. 2025. Update in: Psychol Med. 2025 Jun 17;55:e166. doi: 10.1017/S0033291725000765. PMID: 40568669 Free PMC article. Updated. Preprint.
-
An iPSC-based model of 47,XYY Jacobs syndrome reveals a DNA methylation-independent transcriptional dysregulation shared with male X aneuploid cells.Genome Res. 2025 Jul 1;35(7):1503-1517. doi: 10.1101/gr.279716.124. Genome Res. 2025. PMID: 40494628 Free PMC article.
-
X- vs. Y-chromosome influences on human behavior: a deep phenotypic comparison of psychopathology in XXY and XYY syndromes.J Neurodev Disord. 2024 Oct 3;16(1):56. doi: 10.1186/s11689-024-09574-5. J Neurodev Disord. 2024. PMID: 39363182 Free PMC article.
-
Genomics-based non-invasive prenatal testing for detection of fetal chromosomal aneuploidy in pregnant women.Cochrane Database Syst Rev. 2017 Nov 10;11(11):CD011767. doi: 10.1002/14651858.CD011767.pub2. Cochrane Database Syst Rev. 2017. PMID: 29125628 Free PMC article.
-
Early neurodevelopmental and medical profile in children with sex chromosome trisomies: Background for the prospective eXtraordinarY babies study to identify early risk factors and targets for intervention.Am J Med Genet C Semin Med Genet. 2020 Jun;184(2):428-443. doi: 10.1002/ajmg.c.31807. Epub 2020 Jun 7. Am J Med Genet C Semin Med Genet. 2020. PMID: 32506668 Free PMC article. Review.
References
-
- Achenbach, T. M., & Edelbrock, C. S. (1983). Manual for the child behavior checklist and revised child behavior profile. University of Vermont.
-
- Adcock, R. J. (1878). A problem in least squares. The Analyst, 5(2), 53–54. 10.2307/2635758 - DOI
-
- Barter R., & Yu, B. (2023). Superheat: A graphical tool for exploring complex datasets using heatmaps. R package version 1.0.0. https://rlbarter.github.io/superheat/index.html.
-
- Berger, V. W., & Zhou, Y. (2014) Kolmogorov–smirnov test: Overview. In Wiley StatsRef: Statistics Reference Online. 10.1002/9781118445112.stat06558. - DOI
Publication types
MeSH terms
LinkOut - more resources
Full Text Sources
Medical
