. 2025 Jun 17;16(1):1136.
doi: 10.1007/s12672-025-02931-3.

Multidimensional bioinformatics analysis of chondrosarcoma subtypes and TGF-β signaling networks using big data approaches

Affiliations

Multidimensional bioinformatics analysis of chondrosarcoma subtypes and TGF-β signaling networks using big data approaches

Shengke Li et al. Discov Oncol. .

Abstract

Background: Chondrosarcoma, a rare and heterogeneous malignant bone tumor, presents significant clinical challenges due to its complex molecular underpinnings and limited treatment options. In this study, we employ single-cell RNA sequencing (scRNA-seq) and bioinformatics analyses to delineate cell subtypes, decipher signaling networks, and identify gene expression patterns, thereby providing novel insights into potential therapeutic targets and their implications in cancer biology.

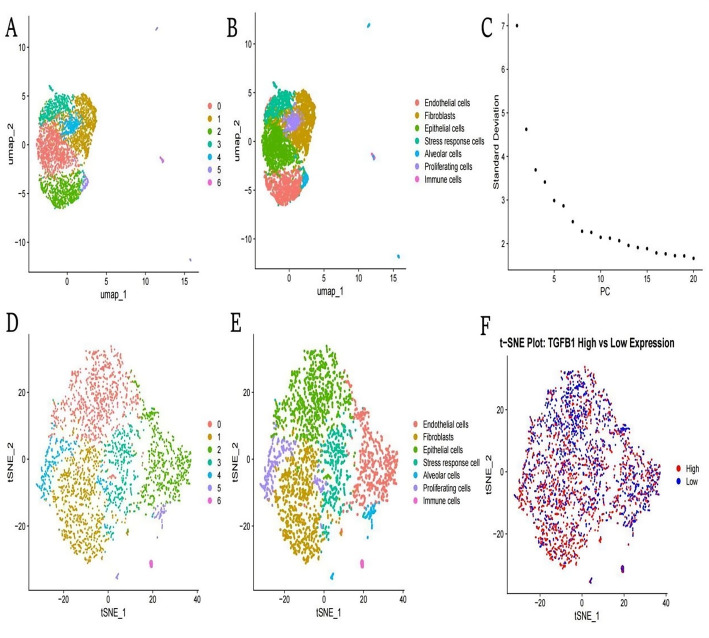
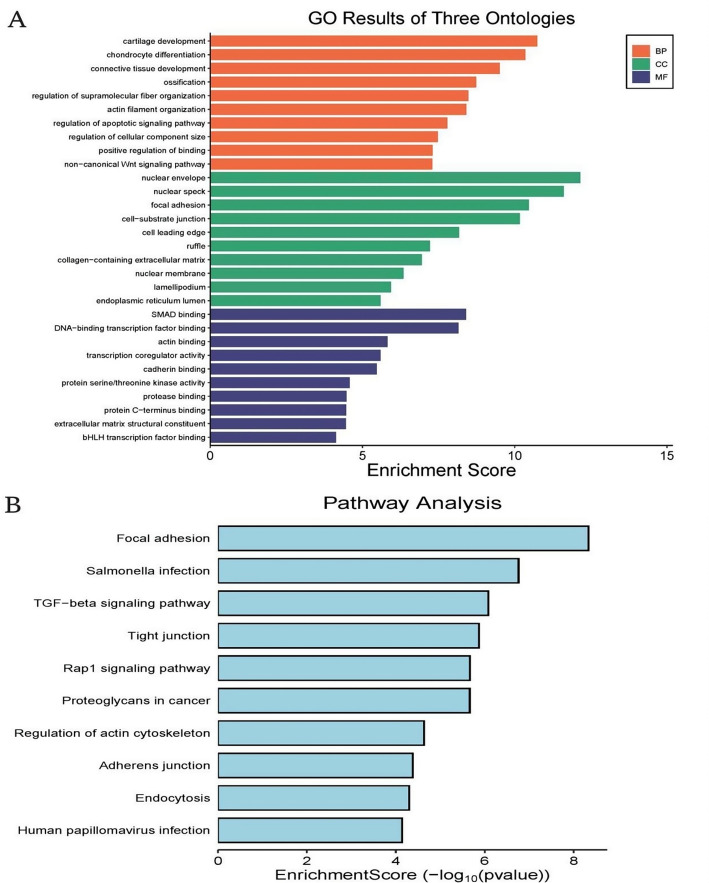
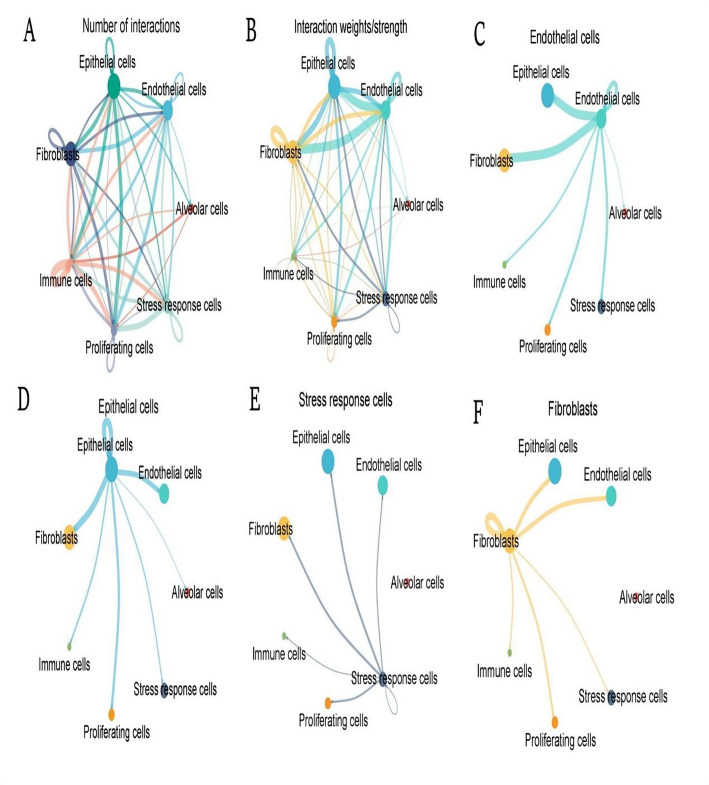
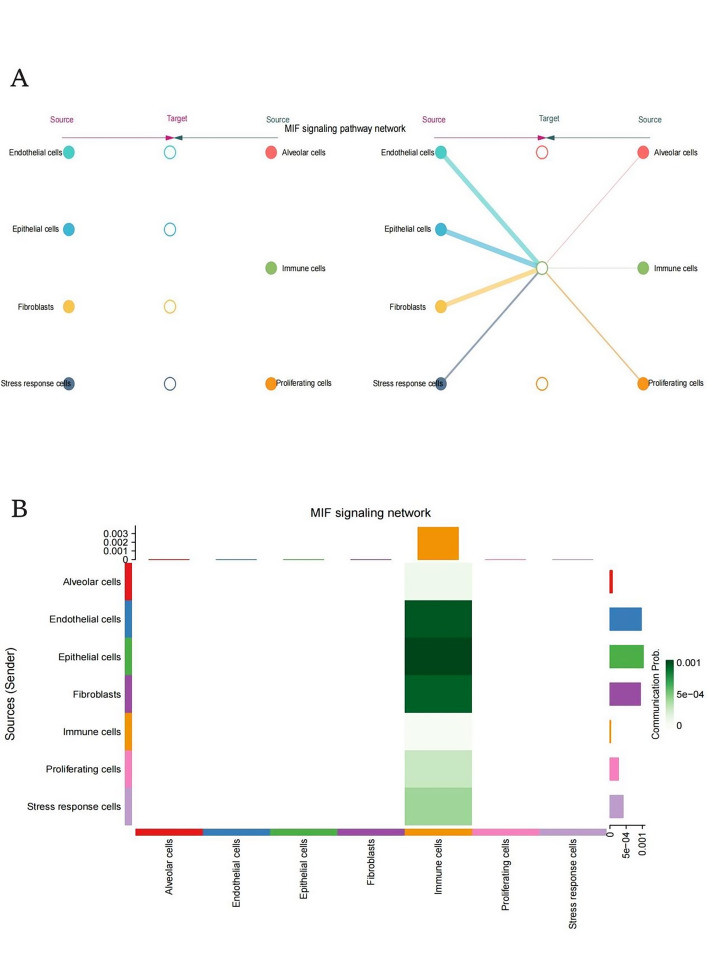
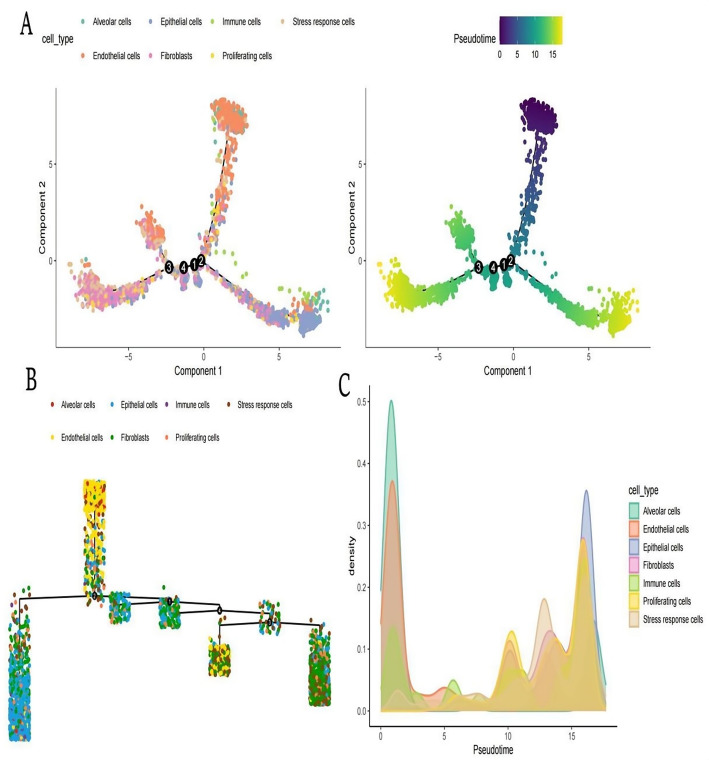
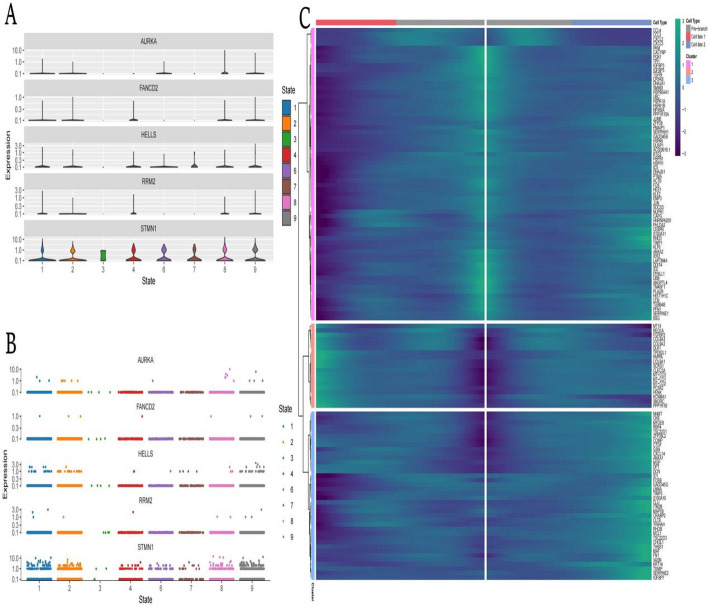
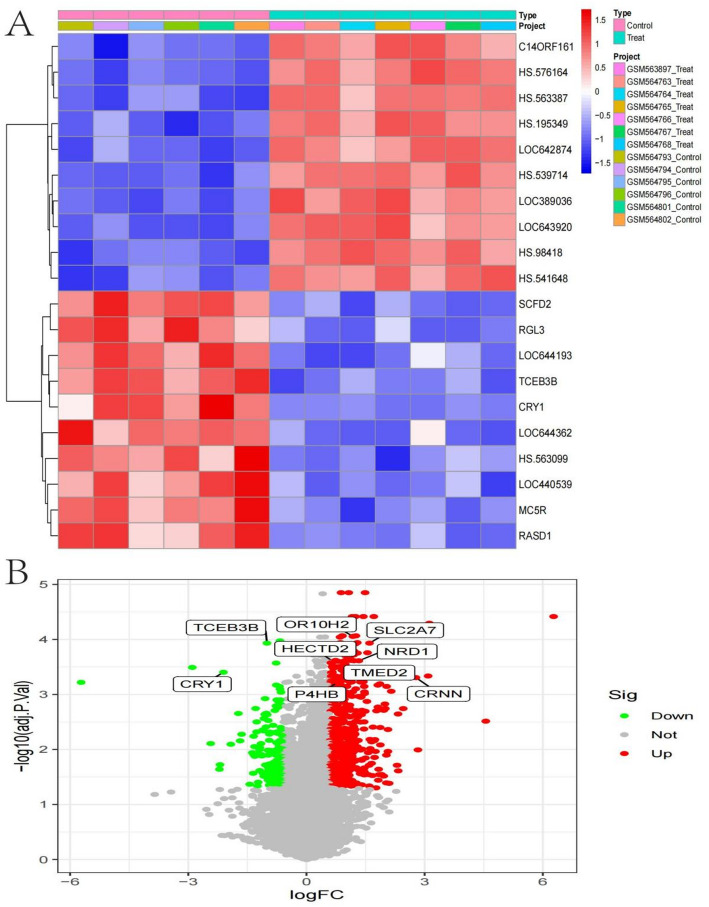
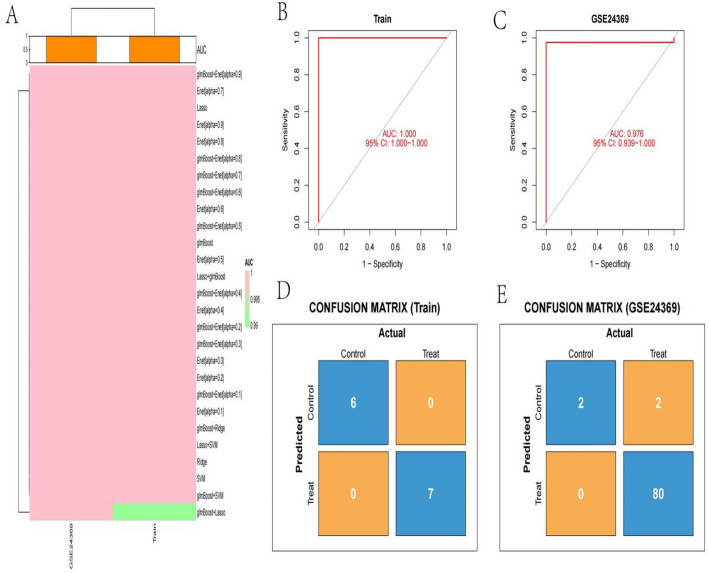
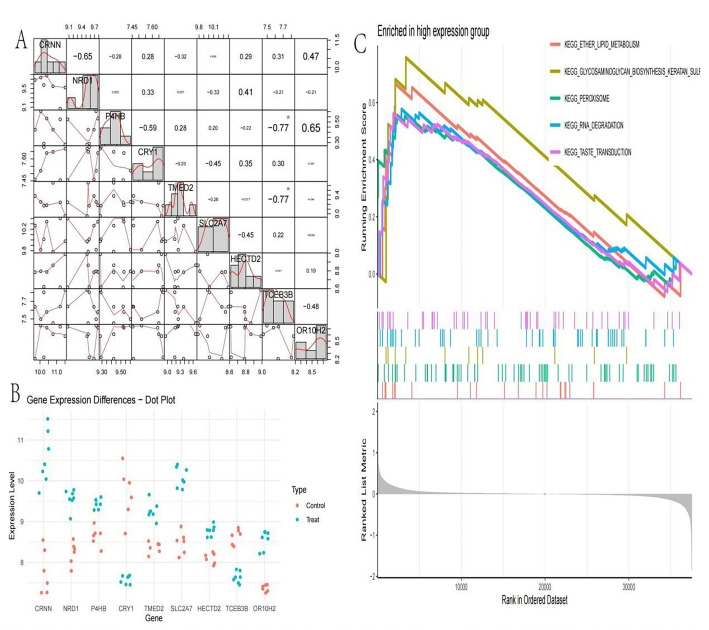
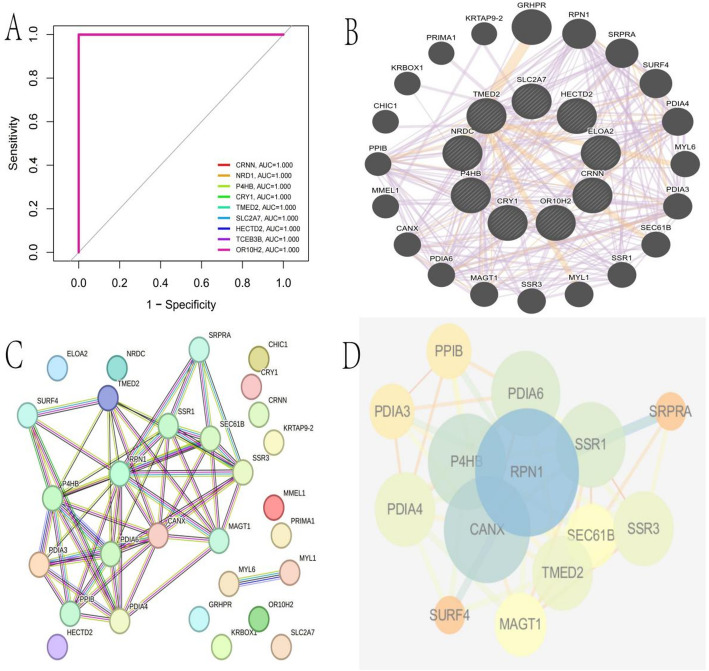
Methods: scRNA-seq was performed on both clinical and experimental chondrosarcoma samples. Dimensionality reduction techniques (UMAP/t-SNE) were used to cluster cell subtypes, followed by Gene Ontology (GO) and pathway analyses to elucidate their biological functions. Cell-cell interaction networks, including the MIF signaling network, were reconstructed to map intercellular communications. Pseudotime analysis charted differentiation trajectories, while machine learning models evaluated the classification accuracy of gene expression patterns. GSEA was conducted to identify state-specific differential expression profiles.

Results: Over ten distinct cell subtypes were identified, including endothelial cells, fibroblasts, and epithelial cells. Key signaling pathways, such as TGF-beta signaling, focal adhesion, and actin cytoskeleton regulation, were found to mediate intercellular interactions. The MIF signaling network underscored the critical roles of immune cells within the tumor microenvironment. Pseudotime analysis revealed dynamic differentiation states, while state-specific gene expression patterns emerged from GSEA. Machine learning models demonstrated robust classification performance across training and external validation datasets.

Conclusions: This comprehensive analysis uncovers the cellular heterogeneity and complex intercellular networks in chondrosarcoma, elucidating critical molecular pathways and identifying novel therapeutic targets. By integrating gene expression, signaling networks, and advanced computational methods, this study contributes to the broader understanding of cancer biology and highlights the potential for precision medicine strategies in treating chondrosarcoma.

Keywords: Bioinformatics analysis; Cell subtypes; Chondrosarcoma; Single-cell RNA sequencing; TGF-beta signaling.


Conflict of interest statement

Declarations. Ethics approval and consent to participate: This study did not involve any human participants or animal subjects, and therefore ethical approval is not applicable. Competing interests: The authors declare no competing interests.

Figures

Fig. 1
Fig. 1
Various analyses of cell populations using dimensionality reduction techniques. A and B: UMAP visualization separates tumor cells into distinct clusters (endothelial, fibroblasts, epithelial, stress response, alveolar, proliferating, and immune cells). C: PCA scree plot showing variance contribution of principal components. D and E: t-SNE projections providing alternative visualization of cell subtype distribution. F: t-SNE map highlighting TGFB1 expression patterns, with red indicating high expression and blue showing low expression across different cell populations
Fig. 2
Fig. 2
Gene ontology (GO) and pathway analysis. A: Gene Ontology classification reveals enriched biological processes centered on cartilaginous tissue formation and chondrocyte maturation; cellular components predominantly associated with nuclear architecture and cell-matrix contact points; and molecular functions primarily involving SMAD-mediated transcriptional regulation and cytoskeletal protein interactions. B: KEGG pathway analysis identifies significant enrichment of cellular mechanisms governing cell-matrix interactions, TGF-beta-mediated signal transduction, and intercellular junction integrity
Fig. 3
Fig. 3
Cell–cell interaction networks among different cell types. A: Network diagram quantifying the frequency of intercellular interactions, with connection thickness representing communication abundance between distinct cellular populations. B: Weighted interaction map illustrating the relative strength and significance of cell-cell communications, with edge intensity proportional to interaction magnitude. CF: Cell type-specific interaction networks highlighting the unique communication patterns of endothelial cells (C), epithelial cells (D), stress response cells (E), and fibroblasts (F), demonstrating their differential connectivity within the tumor ecosystem
Fig. 4
Fig. 4
MIF signaling pathway network. A: Directional network visualization depicting the MIF-mediated signaling architecture, illustrating the complex interplay and information flow between diverse cellular constituents within the tumor microenvironment. B: Heatmap representation of intercellular communication probabilities within the MIF signaling axis, with color intensity corresponding to interaction likelihood and highlighting the central role of immune cell populations in orchestrating this signaling cascade
Fig. 5
Fig. 5
Analysis of cell differentiation and progression using pseudotime. A: Dual representation of cellular states showing spatial distribution of identified cell types (left) and their developmental progression along inferred pseudotime continuum (right), with color gradient reflecting temporal advancement. B: Branching trajectory map revealing the multidirectional differentiation pathways and developmental decision points governing cellular fate determination within the tumor. C: Density distribution analysis displaying the relative abundance of distinct cellular populations across the pseudotemporal continuum, highlighting stage-specific enrichment patterns throughout differentiation progression
Fig. 6
Fig. 6
Gene expression analysis across different cell states. A: Violin plot visualization capturing the distribution and variability of key regulatory genes (AURKA, FANCD2, and others) across distinct cellular states, with width indicating expression frequency at each intensity level. B: Scatter plot representation detailing the cell-by-cell expression patterns of signature genes across different cellular states, revealing both population-level trends and single-cell heterogeneity. C: Hierarchical clustering heatmap illustrating comprehensive gene expression patterns across cellular states and phenotypic categories, with color intensity reflecting relative expression levels and revealing coordinated transcriptional programs characteristic of each cell population
Fig. 7
Fig. 7
Differences between treated and control groups. A: Hierarchically clustered heatmap visualization comparing transcriptional profiles between experimental conditions, with columns representing individual samples (control versus treated) and rows depicting gene expression patterns, where color intensity corresponds to relative expression levels. B: Statistical visualization of gene expression alterations following treatment, plotting fold change against significance level, with significantly upregulated transcripts highlighted in red and downregulated genes in green, revealing key molecular targets responsive to intervention
Fig. 8
Fig. 8
Analysis of model performance using different datasets. A: Color-coded heatmap representation comparing area under the curve (AUC) metrics across various modeling approaches and datasets, with intensity reflecting classification performance. B: Receiver operating characteristic curve for the training dataset demonstrating optimal discrimination capability with perfect AUC (1.000), indicating complete separation between classes. C: External validation performance on the GSE24369 dataset showing robust generalizability with near-perfect discrimination (AUC: 0.976). D: Binary classification outcome matrix for the training cohort showing flawless categorization of all samples into their respective experimental groups. E: Validation cohort classification matrix revealing high predictive accuracy with minimal misassignments, confirming model reliability across independent datasets
Fig. 9
Fig. 9
Comprehensive analysis of gene expression and pathway enrichment. A: Pairwise correlation matrix integrating scatter plots and coefficient values to visualize the strength and directionality of relationships between expression profiles of key regulatory genes. B: Comparative dot plot illustration contrasting gene expression distributions between experimental conditions, with individual data points representing sample-specific measurements and color coding distinguishing control from treatment groups. C: Gene Set Enrichment Analysis (GSEA) plot demonstrating systematic enrichment of specific KEGG pathways associated with high expression phenotypes, with the enrichment score profile (top) reflecting cumulative enrichment and the ranked gene list metric (bottom) indicating the distribution of pathway members across the expression spectrum
Fig. 10
Fig. 10
Analysis of gene interactions and model performance. A: ROC curves showing perfect classification capability (AUC = 1.000) for all candidate biomarker genes. B: Gene interaction network illustrating functional relationships between differentially expressed genes. C: Protein-protein interaction map visualizing physical associations between key proteins identified in the study. D: Clustered network representation highlighting functional modules within the larger interaction network

Similar articles

References

    1. Al-Mourgi M, Shams A. A rare entity of the anterior chest cage rib chondrosarcoma: a case report and review of literature. Semin Thorac Cardiovasc Surg. 2024. 10.1053/j.semtcvs.2024.09.005. - PubMed
    1. Gao Z, Dai Z, Ouyang Z, Li D, Tang S, Li P, et al. Radiomics analysis in differentiating osteosarcoma and chondrosarcoma based on T2-weighted imaging and contrast-enhanced T1-weighted imaging. Sci Rep. 2024;14(1):26594. - PMC - PubMed
    1. Musser ML, Meritet D, Viall AK, Choi E, Willcox JL, Mathews KG. Prognostic impact of a histologic grading scheme in dogs diagnosed with rib chondrosarcoma. Vet Comp Oncol. 2024. 10.1111/vco.13025. - PMC - PubMed
    1. Li J, Bai Y, Zhang H, Chen T, Shang G. Single-cell RNA sequencing reveals the communications between tumor microenvironment components and tumor metastasis in osteosarcoma. Front Immunol. 2024;15:1445555. - PMC - PubMed
    1. Liu WN, Harden SL, Tan SLW, Tan RJR, Fong SY, Tan SY, et al. Single-cell RNA sequencing reveals anti-tumor potency of CD56(+) NK cells and CD8(+) T cells in humanized mice via PD-1 and TIGIT co-targeting. Mol Ther. 2024;32:3895. - PMC - PubMed

LinkOut - more resources