Exploring genetic causal relationships between spinal cord injury and glioma: a Mendelian randomization study
- PMID: 40526188
- PMCID: PMC12173995
- DOI: 10.1007/s12672-025-02919-z
Exploring genetic causal relationships between spinal cord injury and glioma: a Mendelian randomization study
Abstract
Background: Gliomas and spinal cord injuries represent significant health challenges with potential shared genetic underpinnings. Understanding the causal genetic relationships between these conditions could provide valuable insights for targeted therapeutic interventions. This study aimed to investigate potential causal genetic associations between spinal cord injury and glioma using Mendelian Randomization approaches.
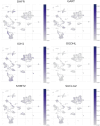
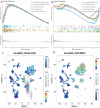
Methods: We employed Mendelian Randomization (MR) to examine potential genetic associations between spinal cord injury and glioma. Four SNPs (rs1358980, rs217992, rs789990, and rs158541) were used as instrumental variables, identified from the FinnGen R11 release's "finngen_R11_C3_GBM_EXALLC" dataset. We applied three MR statistical approaches: MR Egger regression, Inverse Variance Weighted (IVW), and Weighted mode. Additionally, we analyzed gene expression patterns using RNA-sequencing data from TCGA and GEO databases, performed machine learning-based risk stratification, and validated our findings using single-cell RNA sequencing data from glioma patient tissues (GSE131928).
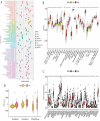
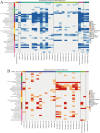
Results: Forest plot analyses revealed that while individual SNPs did not show significant effects on spinal cord injury (confidence intervals crossing zero), different MR methods yielded varying results. The MR Egger method demonstrated a positive correlation trend between glioma-associated genetic factors and spinal cord injury risk, while other methods showed more gradual effects. The MR analysis with the finngen_R11_C3_GBM_EXALLC genetic instrument yielded odds ratios close to 1.000 across all statistical methods (MR Egger: OR = 1.001, 95% CI 0.997-1.004, p = 0.759; IVW: OR = 1.000, 95% CI 1.000-1.000, p = 0.634), suggesting no significant causal relationship. Heterogeneity test results indicated moderate heterogeneity. Additionally, risk stratification analysis revealed significant differences in immune cell infiltration, gene expression patterns, and survival outcomes between high-risk and low-risk groups.
Conclusion: Our comprehensive analysis using Mendelian randomization provides evidence of complex genetic relationships between glioma and spinal cord injury.
Keywords: Genetic association; Glioma; Mendelian randomization; Risk stratification; SNPs; Spinal cord injury.
© 2025. The Author(s).
Conflict of interest statement
Declaration. Ethics approval and consent to participate: This study used publicly available summary data for Mendelian randomization analysis, which does not require ethics committee approval. Consent for publication: Not available. Competing interests: The authors declare no competing interests.
Figures


Similar articles
-
Bidirectional Causal Relationship Between Myopia and Neurodegenerative Diseases: Two-Sample Mendelian Randomization Analyses.Br J Hosp Med (Lond). 2025 Jun 25;86(6):1-19. doi: 10.12968/hmed.2025.0183. Epub 2025 Jun 18. Br J Hosp Med (Lond). 2025. PMID: 40554439
-
Genetically predicted the causal association between serum mineral elements with immune thrombocytopenia and Henoch-Schonlein purpura: a bidirectional two-sample Mendelian randomization analysis.Thromb J. 2025 Jun 16;23(1):65. doi: 10.1186/s12959-025-00756-2. Thromb J. 2025. PMID: 40524203 Free PMC article.
-
Association between thyroid function and type 2 diabetes mellitus based on the NHANES and Mendelian randomization study.Hormones (Athens). 2025 Jun 25. doi: 10.1007/s42000-025-00691-x. Online ahead of print. Hormones (Athens). 2025. PMID: 40560353
-
The relationship between gluten-free diet and IgA nephropathy: A review.Medicine (Baltimore). 2025 Jun 13;104(24):e41964. doi: 10.1097/MD.0000000000041964. Medicine (Baltimore). 2025. PMID: 40527780 Free PMC article. Review.
-
The time-dependent efficacy of early surgical decompression in patients with traumatic spinal cord injury: A systematic review and meta-analysis.J Spinal Cord Med. 2025 Jun 18:1-10. doi: 10.1080/10790268.2025.2517925. Online ahead of print. J Spinal Cord Med. 2025. PMID: 40530919 Review.
References
-
- Cella E, Bosio A, Persico P, Caccese M, Padovan M, Losurdo A, Maccari M, Cerretti G, Ius T, Minniti G, et al. PARP inhibitors in gliomas: mechanisms of action, current trends and future perspectives. Cancer Treat Rev. 2024;131:102850. - PubMed
-
- Cheng H, Ling F, Hou X, Wang J, Zhao Y, Wang Y, Cao Y. The role of STEAP3 in pathogenesis of gliomas: an independent prognostic factor and regulator of ferroptosis. Ann Clin Lab Sci. 2024;54(5):618–32. - PubMed
-
- Luo S, Li Y, Ma R, Liu J, Xu P, Zhang H, Tang K, Ma J, Liu N, Zhang Y, et al. Downregulation of PCK2 remodels Tricarboxylic acid cycle in tumor-repopulating cells of melanoma. Oncogene. 2017;36(25):3609–17. - PubMed
LinkOut - more resources
Full Text Sources
Miscellaneous
