. 2025 Jun 17;41(1):106.
doi: 10.1007/s10565-025-10056-0.

Single-cell spatial proteomics of non-relapse small cell lung cancer identifies tumor microenvironment determinants of survival

Affiliations

Single-cell spatial proteomics of non-relapse small cell lung cancer identifies tumor microenvironment determinants of survival

Yin Li et al. Cell Biol Toxicol. .

Abstract

Small cell lung cancer (SCLC) is characterized by high malignancy and early propensity for metastasis, and modest response to immunotherapy due to the immunosuppressive microenvironment. Surgical intervention has shown benefits in treating early-stage SCLC. However, most patients experience recurrence after surgery. The factors associated with relapse free survival in these patients remain unclear. We collected operation specimens from ten early-stage SCLC patients (N0M0), conducted long-term follow-up, and grouped them based on disease status. Subsequently, we performed a retrospective analysis using single-cell spatial imaging mass cytometry to explore the characteristics of tumor cells and differences in the tumor microenvironment, especially the single-cell constitute of immune cells, between the two groups. We found that, in early-stage SCLC, tumor cells display pronounced heterogeneity, both intra-group and inter-group. Patients with early recurrence are characterized by a distinct subpopulation of tumor cells with high Ki-67 expression. Non-relapse patients demonstrate better infiltration of M1 macrophages and stromal cells. Neighborhood analysis suggested that positive interactions between macrophages, stromal cells, and T cells with tumor cells may benefit patient prognosis. Additionally, recurrent tumor cells might enhance their metastatic capacity and remodel the microenvironment through upregulation of GranzymeB or reduction of c-Myc expression. In conclusion, SCLC tumor cells demonstrate tumor heterogeneity and microenvironmental changes in the early clinical stages. A higher proportion of M1 macrophages is associated with prolonged postoperative survival in early-stage SCLC patients. This research provides novel insights and evidence for treating and preventing postoperative recurrence in SCLC.

Keywords: Imaging Mass Cytometry; Immune signature; Macrophage; Small cell lung cancer; Tumor heterogeneity.


Conflict of interest statement

Declarations. Conflicts of interest: The authors have no relevant financial or non-financial interests to disclose. Competing interests: The authors declare no competing interests. Ethical approval: This study is a retrospective analysis without any intervention. All human specimens and clinical information used in this study had received approval from the Institutional Review Board (IRB) of Shanghai Chest Hospital (IS21118, approved on November 8, 2020), and was conducted in accordance with the Strengthening the Reporting of Observational Studies in Epidemiology (STROBE) guidelines.

Figures

Fig. 1
Fig. 1
The immune cell type recognized by the antibody. Schematic depiction of the specific markers used for immune lineage assignment. Tc, cytotoxic T cell; Treg, regulatory T cell; Tm, memory T cell; T others, undefined T cells; Mac, macrophage. The flow chart was created with BioRender.com
Fig. 2
Fig. 2
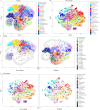
IMC analysis elucidated the disparities in tumor and non-tumor clusters between Non-relapse and Relapse groups. IMC data was dimensionality reduced using t-SNE plots and clustered by PhenoGraph. A t-SNE plots of all tumor cells (cluster number = 24). B t-SNE plots of all non-tumor cells (cluster number = 27). C t-SNE plots of tumor cells in the Non-relapse group (left) and the Relapse group (right) respectively, which illustrate the heterogeneity of tumor cells between the two groups. D t-SNE plots of non-tumor cells in the Non-relapse group (left) and the Relapse group (right) respectively. Non-tumor cells primarily consist of immune cells and stromal cells, and the distribution of these cells between the two groups was relatively homogeneous
Fig. 3
Fig. 3
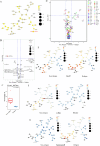
The subset characterized by high Ki-67 expression emerged as a significant determinant for tumor recurrence. A Dendrogram of the hierarchical clustering results obtained from automatic clustering analysis for tumor subpopulations. Shorter branch lengths indicate higher similarity, while longer branch lengths indicate greater dissimilarity. Nodes exhibiting significantly different abundance were highlighted in red. B Abundance volcano plot showing the subgroups enriched for each of the two groups. C The box plot indicating the enrichment differences among subpopulations or nodes. D Expression differences of 34 markers in tumor clusters between the two groups. E-G Differential expression tree of Ki-67 (e), c-Myc (f), GranzymeB (g) between two groups, nodes with differences were highlighted in red. Statistical analysis was performed using an unpaired t-test
Fig. 4
Fig. 4
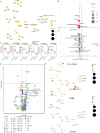
Relapsed patients exhibited a paucity of specific VIM+ stromal cells and M1 macrophages. A Differential abundance analysis tree of non-tumor cells. B Abundance volcano plot showing the enrichment of M1 macrophages and VIM+ stroma cells in the Non-relapse group. C The box plot displayed the specific P values and meaningful clusters or nodes. D Expression differences of 34 markers in non-tumor clusters between two groups. E Differential expression tree of c-Myc between two groups, nodes with differences were highlighted in red. Statistical analysis was performed using an unpaired t-test
Fig. 5
Fig. 5
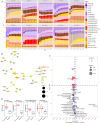
Analysis of non-tumor cell subpopulation abundance based on spatial distance. A Distribution plot showing the proportions of non-tumor cell subpopulations within varying distances from tumor cells for each sample. B-D Re-calculated dendrogram (b), volcano plot (c), and bar plot (d) specifically for non-tumor cells within 30 μm of tumor cells. Cluster 45 and Cluster 27 exhibit distinct distributions between the two groups, consistent with the pre-correction findings
Fig. 6
Fig. 6
Neighborhood analysis highlighted a differential interactive pattern between tumor cells and TME in the two groups. Heatmap indicating significant interaction (red) or avoidance (blue) between Metaclusters of two groups according to a permutation-test-based analysis of spatial single-cell interactions

Similar articles

References

    1. Angelova M, Mlecnik B, Vasaturo A, Bindea G, Fredriksen T, Lafontaine L, et al. Evolution of Metastases in Space and Time under Immune Selection. Cell. 2018;175(3):751–765 e716. 10.1016/j.cell.2018.09.018. - PubMed
    1. Brambilla E, Moro D, Gazzeri S, Brichon PY, Nagy-Mignotte H, Morel F, et al. Cytotoxic chemotherapy induces cell differentiation in small-cell lung carcinoma. J Clin Oncol. 1991;9(1):50–61. 10.1200/JCO.1991.9.1.50. - PubMed
    1. Cao Z, Livas T, Kyprianou N. Anoikis and EMT: Lethal "Liaisons" during Cancer Progression. Crit Rev Oncog. 2016;21(3-4):155–68. 10.1615/CritRevOncog.2016016955. - PMC - PubMed
    1. Carpenter AE, Jones TR, Lamprecht MR, Clarke C, Kang IH, Friman O, et al. CellProfiler: image analysis software for identifying and quantifying cell phenotypes. Genome Biol. 2006;7(10):R100. 10.1186/gb-2006-7-10-r100. - PMC - PubMed
    1. Chan JM, Quintanal-Villalonga A, Gao VR, Xie Y, Allaj V, Chaudhary O, et al. Signatures of plasticity, metastasis, and immunosuppression in an atlas of human small cell lung cancer. Cancer Cell. 2021;39(11):1479–1496 e1418. 10.1016/j.ccell.2021.09.008. - PMC - PubMed

LinkOut - more resources