. 2025 Jun 17;135(16):e187907.
doi: 10.1172/JCI187907. eCollection 2025 Aug 15.

Allergens abrogate antiinflammatory DNA effects and unmask macrophage-driven neutrophilic asthma via ILC2/STING/TNF-α signaling

Affiliations

Allergens abrogate antiinflammatory DNA effects and unmask macrophage-driven neutrophilic asthma via ILC2/STING/TNF-α signaling

Anand Sripada et al. J Clin Invest. .

Abstract

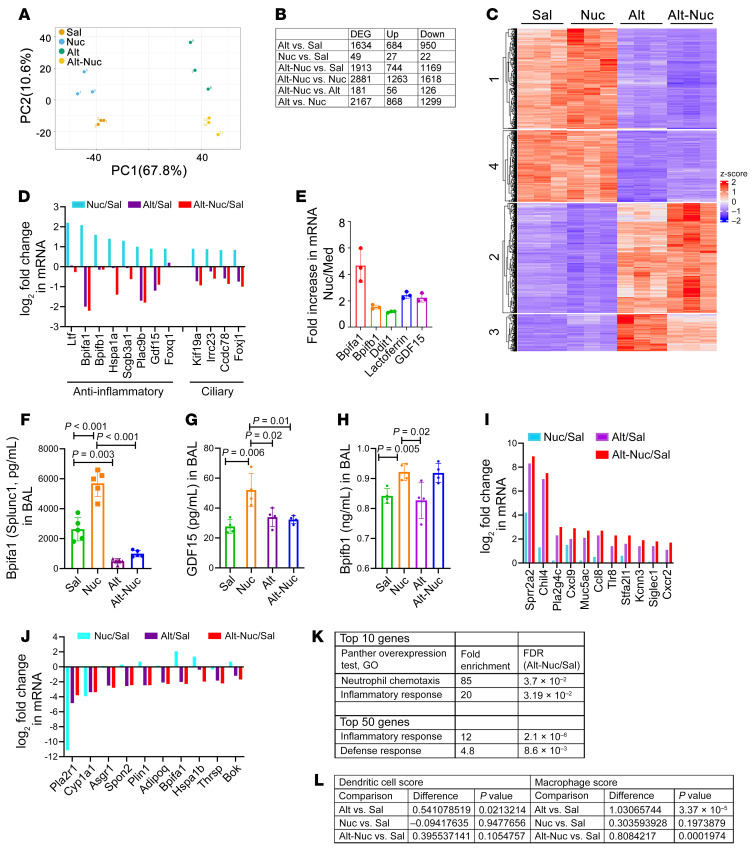
The mechanisms of neutrophilic and mixed neutrophilic-eosinophilic asthma are poorly understood. We found that extracellular DNA and nucleosomes (Nucs) were elevated in the airways of patients with neutrophilic-eosinophilic asthma and correlated with bronchoalveolar lavage neutrophils. Bronchial tissue from neutrophilic-eosinophilic asthma had more DNA sensor-positive cells. Intranasally administered DNA did not induce airway hyperreactivity (AHR) or any pathology but induced AHR and neutrophilic-eosinophilic inflammation when coadministered with the allergen Alternaria (Alt). Nuc alone induced antiinflammatory/defensive genes, whereas the Nuc-Alt combination increased levels of TNF-α and innate cytokines. The Alt-Nuc phenotype was abolished in Cgas-/-, ALR-/-, Sting-/-, LysMCre:Stingfl/fl, IL7RCre:Rorαfl/fl, and Tnfr2-/- mice. Alt, unexpectedly, played an essential role in the Nuc-induced phenotype. It abrogated Nuc induction of antiinflammatory genes, facilitated Nuc uptake, induced type 2 innate lymphoid cells, which, in the presence of Nuc, produced high levels of TNF-α, and promoted neutrophilic infiltration. We established a paradigm whereby allergens inhibit the antiinflammatory effects of DNA/Nuc and facilitate STING-TNF-α-driven neutrophilic-eosinophilic inflammation in asthma.

Keywords: Asthma; Immunology; Inflammation; Pulmonology.


Conflict of interest statement

Conflict of interest: The authors have declared that no conflicts of interest exists.

Figures

Figure 1
Figure 1. DNA in body fluids and allergens.
(A) The DNA level in BAL in DC participants (n = 12), patients with N-NA (n = 17), and those with NA (n = 17). (B) The DNA level in serum in the DC (n = 14), N-NA (n = 16), and NA (n = 16) groups. (C) Correlation analyses between the DNA and PMN in BAL (n = 31). Statistical comparisons are between reads from individuals in the DC group and patients with NA. (D) Comparison of DNA in BAL, serum, and sputum from patients with asthma (n = 6). (E) The presence of DNA in allergen extracts and PM2.5 (n = 3 per group). (F) Nuc-bound DNA in BAL from patients in the DC (n = 10), N-NA (n = 16), and NA (n = 16) groups. (G) MPO-bound DNA in BAL from patients in the DC (n = 10), N-NA (n = 21), and NA (n = 21) groups. (H) The inflammasome cytokine IL-1β in BAL from patients with NA or N-NA, and those in the DC group (n = 20 from each type). (I) The innate cytokine IL-6 in BAL from patients with NA (n = 17) or N-NA (n = 17), and those in the DC group (n = 17). (J) The STING pathway cytokine CXCL10 in BAL from participants in the NA (n = 32), N-NA (n = 17) and DC (n = 18) groups. (K) The type 3 cytokine IL-17A in BAL from participants in the NA, N-NA, and DC groups (n = 16 with each type). (L) Expression of mRNA for DNA sensors in bronchial mucosa and epithelial cells from another cohort of 60 patients with NA versus 30 with N-NA was assessed by microarray, as reported previously (16). The inset (M) shows a dot plot of expression of IFI16 mRNA in NA and N-NA. (N and O) BAL CXCL9 and IFN-β from patients with NA (n = 36) or N-NA (n = 20) and those with DC (n = 14). Data are shown as mean ± SEM. Statistical differences in A, B, D, EK, N, and O were tested using the Mann-Whitney U test. Statistical significance (P values) of difference between the groups are shown above the bar graphs. Padj, adjusted P value.
Figure 2
Figure 2. Effect of i.n. exposure to DNA, Nuc, and Alt (alone or in combination) on mouse AHR, inflammation, and mucus production.
(A) A schematic of the i.n. administration of various agents and the experimental end point. (B) AHR after Sal, DNA, Alt, or Alt+DNA exposure as measured by flexiVent. εSal versus Alt+DNA, P < 0.0001; φSal versus Alt, P < 0.0001; #DNA versus Alt, P = 0.0001; δDNA versus Alt+DNA, P < 0.0001. (CF) Differential counts of BAL macrophages, lymphocytes, eosinophils, and neutrophils (n = 5). (G and H) Morphometric quantification of peribronchial and perivascular inflammation (H&E staining of the lungs) and mucus production (PAS staining) in Sal-, DNA-, Alt-, or Alt+DNA–treated mice (n = 5). (Groups are color-coded as in B). (I) AHR after Sal, Nuc, Alt, or Alt-Nuc exposure as measured by flexiVent. RRS, respiratory system resistance. *Sal versus Nuc, P = 0.02; φSal versus Alt, P < 0.0001; εSal versus Alt-Nuc, P < 0.0001; #Nuc versus Alt, P = 0.02; δNuc versus Alt-Nuc, P < 0.0001; ψAlt versus Alt-Nuc, P = 0.006. (n = 7). (JM) Differential counts of BAL macrophages, lymphocytes, eosinophils, and neutrophils (n = 7). (N and O) Morphometric quantification of peribronchial and perivascular inflammation and mucus production in mice treated with Sal, Nuc, Alt, or Alt-Nuc (n = 7). BM, basement membrane. (Groups are color coded as in I). (P and Q) Expression (semi-quantitative) of select cytokines and chemokines in BAL from mice treated with Sal, Nuc, Alt or Alt-Nuc, as measured by a cytokine array (n = 3). (R) AHR after Sal, DNA, or histone exposure in B6 mice (n = 5). δSal versus histone, P < 0.001; εDNA versus histone, P < 0.001. A 2-way ANOVA with Tukey’s multiple comparisons test was used to determine the statistical significance between groups. Data are presented as mean ± SEM. *P < 0.05, **P < 0.01, ***P < 0.001. ****P < 0.0001.
Figure 3
Figure 3. Transcriptomic analysis of the mouse models.
(A) Principal component (PC) analysis of transcriptomic changes (RNA-Seq of the lung tissue) in Sal-, Nuc-, Alt-, and Alt-Nuc–treated mice (n = 3). (B) Comparison of differentially expressed genes and up- and downregulated genes between the study groups. (C) Heat map of top 200 genes among the 4 study groups. (D) Top genes selectively induced by Nuc and inhibited by Alt and Alt-Nuc. (E) Validation of increased mRNA (RT-PCR) expression of Bpifa1, Bpifb1, Ddit1, Lactoferrin, and GDF15 in Nuc- versus medium-treated mouse airway epithelial cells. Med, medium. (FH) Measurement of BPIFA1, GDF15, and BPIFB1 in BAL by ELISA from Sal-, Nuc-, Alt- and Alt-Nuc–treated mice (n = 4–5). (I and J) Top upregulated (I) and downregulated (J) genes (Log2 fold change compared with Sal) among the study groups. (K) Top biological processes driven by the top 50 and top 10 genes from the study groups. GO, Gene Ontology. (L) Comparison of dendritic cell versus macrophage scores for association with the transcriptomes from the study groups. A 2-way ANOVA with Tukey’s multiple comparisons test were used to determine the statistical significance between groups. Data are presented as mean ± SEM. Statistical significance (P values) of difference between the groups are shown above the bar graphs.
Figure 4
Figure 4. Nuc uptake.
(AD) Labeled Nuc (Nuc-biotin/His; 10 μg/mouse) or Sal were administered i.n. to mice (n = 3), and biotin+ cells were analyzed by FCM in various lung cell populations. (E) Healthy cadaveric alveolar macrophages were incubated with His-labeled Nuc for 4 hours and immunostained for His (red, cytosolic DNA), IFI16 (green), and nucleus (blue). Scale bar, 5 μm (F) Isolated blood monocytes from healthy donors (n = 10) were incubated with His/biotin-labeled Nuc (with or without lipofectamine [Lipo]) for 4 hours and cells with internalized Nuc (His+) were quantified. (G) Blood monocytes from patients with asthma (n = 12) were cultured overnight (ON) with medium (Med) or Alt (5 μg/mL) and then incubated with His-labeled Nuc in the presence of Lipo for 4 hour. Cytosolic Nuc+ (His+) cells were analyzed. (H) Blood monocytes from patients with asthma (n = 9) were cultured as above but without Lipo. Cells were immunostained for IFI16+. Cytosolic IFI16+ monocytes were analyzed. (IK) Healthy cadaveric alveolar macrophages were incubated with Alt for an increasing time (I and J), or with Alt, dust mites (DM), and ragweed (RW) (K) for 72 hours and then immunoblotted for CCDC25 (I) or CLEC2D (J and K) (n = 3). (L) BMDM from WT and ST2–/– mice were cultured with Sal or Alt (5 μg/mL) for 48 hours and then immunoblotted for CLEC2D (n = 3). (M) Internalization of Nuc-biotin by WT and ST2–/– BMDMs was detected by FCM (n = 3). (N) Cadaveric alveolar macrophages were transfected with control (Con) gRNA or CLEC2D gRNA. Cells were incubated 48 hours later with medium or Nuc for 4 hours and immunoblotted for CLEC2D and p-STING (n = 3). Comparison made by Student’s 2-tailed t test (AD) and 2-way ANOVA with Tukey’s multiple comparisons test (FH). Data are presented as mean ± SEM. *P < 0.05, ***P < 0.001.
Figure 5
Figure 5. Cytosolic IFI16 and activated STING in NA.
(AD) Representative image of endobronchial biopsy (n = 12 per group) (A) and BAL samples (n = 8 per group) (C) from patients with NA and those in the DC group. Specimens were immunostained for IFI16 (red) and counterstained with DAPI (blue). Extranuclear IFI16+ (arrows) cells were compared and quantified between the 2 study groups (B and D). Comparison was made by Student’s 2-tailed t test. Scale bar, 10 μm. (E and F) BAL cells from a participants in the DC group and from a patient with NA were fractionated for nuclear and cytosolic fractions and immunoblotted for IFI16. Lamin B and GAPDH were used as markers for nuclear and cytosolic fractions, respectively. Asthmatic BAL cells showed cytosolic IFI16 (n = 3). (G) BAL cells from select patients with asthma were incubated with Nuc in vitro for 4 hours and then stained for IFI16. IFI16+ cells were quantified and statistically analyzed. Comparison was made by paired t test. (H) Correlation of IFI16+ cells in the bronchial mucosa (A and B) with DNA levels in the corresponding BAL. (I and J) Monocyte-derived macrophages (MDM) were transduced with control (Con) or IFI16 gRNA along with CRISPR-Cas9 and then immunoblotted for IFI16 and reprobed for tubulin. (J) MDMs transduced with control or IFI16 gRNA were cultured for 24 hours, and culture supernatant was assayed for the indicated cytokines (n = 3). Comparison was made by Student’s 2-tailed t test. *P < 0.05. (KM) Endobronchial biopsy samples from the DC participants and patients with NA were stained for p-STING, and the quantified data compared between the study groups. ****P < 0.0001 by Student’s 2-tailed t test. Scale bar, 10 μm. Med, medium.
Figure 6
Figure 6. Role of STING in the Alt-Nuc and Alt models of asthma.
(A) Expression of p-STING in the lung. Mouse lungs from the Sal and Alt-Nuc models were immunostained for p-STING (red) and counterstained for DAPI (n = 3). Scale bar 20 μm. (B) Immunoblot analysis of the lung tissue from the Sal and Alt-Nuc models for p-STING (n = 3). The membranes were reprobed for STING and actin. (C) Lung specimens were immunostained for p-TBK1 (red) and KLRG1 (a marker of ILC2s, and a fraction of activated NK cells and T cells) (green). Scale bar, 10 μm. (D) Lung specimens were double stained for p-TBK1 (red) and CD206 (a macrophage marker) (green) (n = 3). Scale bar, 5 μm. (E) AHR after Alt-Nuc treatment (see Figure 2A) of Sting+/+ and Sting–/– mice as measured by flexiVent. εSting+/+-Sal versus Sting+/+-Alt-Nuc, P < 0.0001; *Sting+/+-Sal versus Sting+/+-Alt, P < 0.0001; φSting+/+-Sal versus Sting–/–-Alt, P = 0.002; δSting+/+-Alt versus Sting+/+-Alt-Nuc, P <0.0001; ΨSting–/–-Alt-Nuc versus Sting+/+-Alt-Nuc, P < 0.0001; #Sting–/–-Sal versus Sting–/–-Alt, P = 0.001. (n = 6; 2-way ANOVA with Tukey’s multiple comparisons test). (FH) Differential counts of BAL lymphocytes, eosinophils, and neutrophils. (I and J) Morphometric quantification of inflammation and mucus production in the lung tissue from Sting+/+ and Sting–/– mice from the study groups. (n = 5; 2-way ANOVA with Tukey’s multiple comparisons test). BM, basement membrane. (K) Expression (semi-quantitative) of select cytokines and chemokines in BAL from Sting+/+ and Sting–/– mice treated with Alt-Nuc as measured by a cytokine array. Comparison made by Student’s 2-tailed t test. *P < 0.05. (L and M) ICAM1 immunostaining (green) of the lung tissue and the quantification of MFI of the stained blood vessels from Sting+/+ and Sting–/– mice (n = 5). Scale bar, 50 μm. Comparison made by Student’s 2-tailed t test. Data are presented as mean ± SEM. *P < 0.05, **P < 0.01, ****P < 0.0001.
Figure 7
Figure 7. Effect of germline deletion of various DNA sensors and ILC2s on Alt-Nuc and Alt-induced asthma.
(A) AHR after Alt-Nuc, Alt, and Sal exposure in WT and Cgas–/– mice (n = 5) as measured by flexiVent. RRS, respiratory system resistance. εWT-Sal versus WT-Alt-Nuc, P < 0.0001; #WT-Sal versus WT-Alt, P < 0.0001; §WT-Sal versus Cgas–/–-Alt, P < 0.0001; *WT-Sal versus Cgas–/–-Alt-Nuc, P = 0.001; ΨWT-Alt-Nuc versus Cgas–/–-Alt-Nuc, P < 0.0001; ΦWT-Alt versus WT-Alt-Nuc, P < 0.0001. (BE) Quantification of eosinophils, neutrophils, lung inflammation, and mucus production in WT and Cgas–/– mice treated with Alt or Alt-Nuc (n = 5). (Groups are color-coded as in A). BM, basement membrane. (F) AHR after Alt-Nuc and Sal exposure in WT and ALR–/– mice (n = 5). *WT-Sal versus WT-Alt-Nuc, P < 0.0001; δWT-Sal versus ALR–/–-Alt-Nuc, P = 0.0003; ΨWT-Alt-Nuc versus ALR–/–-Alt-Nuc, P < 0.0001. (GJ) Quantification of eosinophils, neutrophils, lung inflammation, and mucus production in WT and ALR–/– mice treated with Alt-Nuc (n = 5). (Groups are color-coded as in F). (K) AHR after Alt-Nuc, Alt and Sal exposure in Stingfl/fl and LysMCre:Stingfl/fl mice (n = 5). εStingfl/fl-Sal versus Stingfl/fl-Alt-Nuc, P < 0.0001; #Stingfl/fl-Sal versus Stingfl/fl -Alt, P < 0.0001; *Stingfl/fl-Sal versus LysMCre:Stingfl/fl-Alt, P < 0.0001; ΨStingfl/fl-Alt-Nuc versus LysMCre:Stingfl/fl-Alt-Nuc, P<0.0001; §LysMCre:Stingfl/fl-Alt versus LysMCre:Stingfl/fl-Alt-Nuc, P = 0.02. (LO) Quantification of eosinophils, neutrophils, lung inflammation, and mucus production in Stingfl/fl and LysMCre:Stingfl/fl mice treated with Alt-Nuc, Alt, or Sal (n = 5). (Groups are color-coded as in K). (P) AHR after Alt-Nuc, Alt and Sal exposure in RORαfl/fl and IL7RCre:RORαfl/fl mice (n = 5). δRORαfl/fl-Sal versus RORαfl/fl-Alt-Nuc, P < 0.0001; #RORαfl/fl-Sal versus RORαfl/fl-Alt, P < 0.0001; §RORαfl/fl-Sal versus IL7RCre:RORαfl/fl-Alt, P = 0.007; ΨRORαfl/fl-Alt-Nuc versus IL7RCre:RORαfl/fl-Alt-Nuc, P < 0.0001; *RORαfl/fl-Alt versus RORαfl/fl-Alt-Nuc, P < 0.0001; ΦRORαfl/fl-Alt versus IL7RCre:RORαfl/fl-Alt, P = 0.01. (QT) Quantification of eosinophils, neutrophils, lung inflammation, and mucus production in RORαfl/fl and IL7RCre:RORαfl/fl mice (n = 5) treated with Alt-Nuc, Alt, and Sal (groups are color-coded as in P). Two-way ANOVA with Tukey’s multiple comparisons test was used to determine the statistical significance between groups. Data are presented as mean ± SEM. *P < 0.05, **P < 0.01, ***P < 0.001 ****P < 0.0001.
Figure 8
Figure 8. Role of TNF-α and TNFR2 in Alt-Nuc–induced asthma.
(A) AHR following Alt-Nuc, Alt, Nuc and Sal exposure in WT and Tnfr2–/– mice as measured by flexiVent. RRS, respiratory system resistance. δWT-Sal versus WT-Nuc, P < 0.0001; εWT-Sal versus WT-Alt, P < 0.0001; §WT-Sal versus Tnfr2–/–-Alt, P < 0.0001; *WT-Sal versus WT-Alt-Nuc, P < 0.0001; #WT-Nuc versus WT-Alt, P = 0.006; φWT-Alt versus WT-Alt-Nuc, P < 0.0001; ΨWT-Alt-Nuc versus Tnfr2–/–-Alt-Nuc, P < 0.0001. (n = 5; 2-way ANOVA with Tukey’s multiple comparisons test). (BE) Quantification of eosinophils and neutrophils in BAL, morphometric quantification of lung inflammation and mucus production in WT and Tnfr2–/– mice treated with Alt-Nuc, Alt, Nuc, or Sal (groups are color-coded as in A). (n = 5; 2-way ANOVA with Tukey’s multiple comparisons test). BM, basement membrane. (F) ICAM1 expression in the lung tissue of WT and Tnfr2–/– mice (n = 4) treated with Alt-Nuc. (G) Quantification of ICAM1 staining intensity in the lung tissue from WT and Tnfr2–/– mice treated with Alt-Nuc. Comparison made by Student’s 2-tailed t test. Scale bar, 50 μm. (H and I) Comparison of TNF-α+ lung hematopoietic cells (frequency and MFI) from the Alt-Nuc model (n = 4). (J and K) TNF-α (ELISA) in BAL from ILC2 KO (IL7RCre:Rorαfl/fl) and Sting–/– mice (n = 4). (L and M) ICAM1 expression (immunostaining and mean intensity quantification) in the lung tissue from Alt-Nuc–treated IL7RCre:Rorαfl/fl and Rorαfl/fl mice (n = 4). Scale bar, 50 μm. Comparison made by Student’s 2-tailed t test. Data are presented as mean ± SEM. *P < 0.05, **P < 0.01, ***P < 0.001, ****P < 0.0001.

Similar articles

References

    1. Wenzel SE. Severe adult asthmas: integrating clinical features, biology, and therapeutics to improve outcomes. Am J Respir Crit Care Med. 2021;203(7):809–821. doi: 10.1164/rccm.202009-3631CI. - DOI - PMC - PubMed
    1. Bacharier LB, Jackson DJ. Biologics in the treatment of asthma in children and adolescents. J Allergy Clin Immunol. 2023;151(3):581–589. doi: 10.1016/j.jaci.2023.01.002. - DOI - PubMed
    1. Murphy RC, et al. Management strategies to reduce exacerbations in non-T2 asthma. J Allergy Clin Immunol Pract. 2021;9(7):2588–2597. doi: 10.1016/j.jaip.2021.04.033. - DOI - PubMed
    1. Alam R, et al. Airway and serum biochemical correlates of refractory neutrophilic asthma. J Allergy Clin Immunol. 2017;140(4):1004–1014. doi: 10.1016/j.jaci.2016.12.963. - DOI - PMC - PubMed
    1. Steinke JW, et al. Bronchoalveolar lavage cytokine patterns in children with severe neutrophilic and paucigranulocytic asthma. J Allergy Clin Immunol. 2021;147(2):686–693. doi: 10.1016/j.jaci.2020.05.039. - DOI - PMC - PubMed

MeSH terms