. 2025 Jun 17;135(16):e183434.
doi: 10.1172/JCI183434. eCollection 2025 Aug 15.

CNS-targeted base editing of the major late-onset Tay-Sachs mutation alleviates disease in mice

Affiliations

CNS-targeted base editing of the major late-onset Tay-Sachs mutation alleviates disease in mice

Maria L Allende et al. J Clin Invest. .

Abstract

Late-onset Tay-Sachs (LOTS) disease is a lysosomal storage disorder most commonly caused by a point mutation (c.805G>A) in the HEXA gene encoding the α subunit of the lysosomal enzyme β-hexosaminidase A. LOTS manifests as a range of gradually worsening neurological symptoms beginning in young adulthood. Here, we explored the efficacy of an adenine base editor (ABE) programmed with an sgRNA to correct the HEXA c.805G>A mutation. Base editing in fibroblasts from a patient with LOTS successfully converted the pathogenic HEXA c.805A to G and partially restored β-hexosaminidase activity, with minimal genome-wide off-target editing. We generated a LOTS mouse model in which the mice exhibited decreased β-hexosaminidase activity, accumulation of GM2 ganglioside in the brain, progressive neurological manifestations, and reduced lifespan. Treatment of LOTS mice with the neurotropic virus AAV-PHP.eB carrying the ABE and an sgRNA targeting the LOTS point mutation partially corrected the c.805G>A mutation in the CNS, significantly increased brain β-hexosaminidase activity, and substantially reduced GM2 ganglioside accumulation in the brain. Moreover, the therapy delayed symptom onset and significantly extended median lifespan. These findings highlight the potential of base editing as an effective treatment for LOTS and its broader applicability to other lysosomal storage disorders.

Keywords: Genetic diseases; Genetics; Monogenic diseases; Neuroscience.


Conflict of interest statement

Conflict of interest: The authors have declared that no conflict of interest exists.

Figures

Figure 1
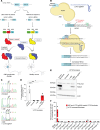
Figure 1. Base editing corrects the HEXA c.805G>A mutation in fibroblasts from a patient with LOTS.
(A) Schematic of late-onset Tay-Sachs (LOTS) disease. A point mutation in the last base of exon 7 of HEXA (c.805G>A) causes a Gly269Ser substitution in the α subunit, impairing assembly of β-hexosaminidase A, the lysosomal enzyme that degrades GM2 ganglioside. Reduced enzymatic activity leads to GM2 ganglioside accumulation in neuronal lysosomes. (B) Base-editing strategy. An adenine base editor (ABE), composed of Cas9 nickase fused to an adenine deaminase, was programmed with a LOTS-sgRNA targeting the HEXA c.805G>A mutation. Editing converted A-to-G within the specified editing window (red box), correcting the LOTS HEXA c.805G>A mutation. (CE) Base editing in fibroblasts from a patient with LOTS. Fibroblasts homozygous for HEXA c.805G>A were transduced with lentivirus encoding ABE only (+ABE), both ABE and LOTS-sgRNA (+ABE, +LOTS-sgRNA), or left untreated and cultured for 4 weeks. Sanger sequencing of PCR amplicons confirmed targeted base editing (C). (D) β-Hexosaminidase A activity was assayed in cell extracts (mean ± SD, n = 3). Control fibroblasts from an unaffected individual were used as a positive control. Statistical significance was determined by 1-way ANOVA with Bonferroni’s correction (*P < 0.05, ***P < 0.001). (E) Western blot of α subunit expression in edited fibroblasts. Precursor and mature forms are indicated; β-actin was used as loading control. (F) Off-target analysis. CIRCLE-Seq identified 11 candidate off-target loci, which were amplified and deep-sequenced in fibroblasts transduced with ABE and LOTS-sgRNA (cultured 27 weeks), and in untreated controls. Shown are percentages of A-to-G conversions at each locus, including the on-target site (HEXA c.805A) for comparison. Partially created with BioRender.com.
Figure 2
Figure 2. Generation of a LOTS mouse model for base editing.
(A) Schematic of the engineered Hexa locus. Cas9-mediated targeting inserted human HEXA exon 7 and flanking intron sequences into the mouse genome to generate either the reference allele (HEXA c.805G, left) or LOTS allele (HEXAc.805A, right). Mouse sequences are in blue; human sequences in red. (B) Body-weight progression in female mice. Weekly weights were recorded for HEXA c.805G and HEXA c.805G/Neu3-KO (left) and HEXA c.805A and HEXA c.805A/Neu3-KO mice (right). Data are mean ± SD (n = 10–15). *P < 0.05, **P < 0.01 (Student’s t test). (C) Kaplan-Meier survival curves for HEXA c.805G and HEXA c.805G/Neu3-KO (left) and HEXA c.805A and HEXAc.805A/Neu3-KO mice (right). Combined sexes shown (n = 25–57). (D and E) GM2 ganglioside levels in brain. Gangliosides were extracted from female mice aged 24–26 weeks (n = 2–3/genotype) and analyzed by high-performance TLC. (D) Representative high-performance TLC plate; each lane contains 5% of gangliosides from 1 brain hemisphere. Arrows indicate ganglioside standards. (E) Quantification of GM2 band intensities (mean ± SD). Each dot represents data from 1 mouse. ****P < 0.0001 (Student’s t test). (F) GM2 degradation pathways. In humans (red box) and mice (blue box), β-hexosaminidase A converts GM2 to GM3. In mice only, NEU3 also degrades GM2 to GA2, bypassing β-hexosaminidase A. (G) Generation of control and LOTS mice. HEXA c.805G or c.805A mice were crossed with Neu3-KO mice to generate HEXA c.805G/Neu3-KO (control) and HEXA c.805A/Neu3-KO (LOTS) mice. Diagrams show expected GM2 degradation in each line. (H) Neurological evaluation. Mice were scored weekly on 6 criteria (left box) starting at 7 weeks. Mean ± SD shown (n = 16 LOTS, n = 27 controls; sexes combined). Partially created with BioRender.com.
Figure 3
Figure 3. Base-editor treatment corrects the HEXA c.805G>A mutation and partially restores brain β-hexosaminidase activity in LOTS mice.
(A) Schematic of ABE treatment in LOTS mice. At 6–7 weeks of age, LOTS mice were injected retro-orbitally with either AAV-PHP.eB-GFP (control) or a 1:1 mixture of AAV-PHP.eB vectors carrying v5 AAV-ABE N- and C-terminal components with LOTS-sgRNA (ABE-treated). Total dose was 2.4 × 10¹² vg/mouse. Tissues were collected at 21 weeks or end of life. (B) Base editing at the HEXA c.805A site. Editing efficiency was quantified in brain, spinal cord, and liver DNA from control- and ABE-treated LOTS mice at 21 weeks using next-generation sequencing. A-to-G conversion was expressed as mean ± SD (brain: n = 18 ABE, n = 4 control; spinal cord/liver: n = 8 ABE, n = 4 control). Each dot represents 1 mouse. ****P < 0.0001 by 1-way ANOVA with Bonferroni’s correction. (C and D) Heatmaps of A-to-G conversion across the ABE editing window in brain (C) and spinal cord (D) from ABE-treated mice. Each row represents 1 mouse. Protospacer sequence is shown above; uppercase: exon, lowercase: intron. (E) β-Hexosaminidase activity in brain lysates from 21-week-old WT, control-treated LOTS, and ABE-treated LOTS mice. α subunit–specific activity is expressed as a percentage of WT (set at 100%). Mean ± SD shown (n = 4 per group, males). **P < 0.01 by Student’s t test. Partially created with BioRender.com.
Figure 4
Figure 4. Base-editor treatment reduces brain GM2 ganglioside accumulation in LOTS mice.
WT, control-treated LOTS, and ABE-treated LOTS mice were euthanized at 21 weeks of age, and sagittal brain sections were prepared (n = 4 per group; mixed males and females). The AAV-treated mice each received 2.4 × 10¹² vg. (A) Representative sagittal brain sections stained with anti-GM2 ganglioside antibody (red) and counterstained with DAPI (blue); scale bar: 1 mm. (B and C) Representative 40× images of the cerebral cortex (B) and brain stem (C) stained with anti-GM2 ganglioside antibody (red) and counterstained with DAPI (blue); scale bar: 20 μm. (D) Quantification of GM2 fluorescence intensity in cortex and brain stem. Small gray symbols represent image-level measurements (technical replicates); large colored symbols indicate per-mouse means (biological replicates). Statistical analysis was performed using a mixed-effects model with Tukey’s correction. ***P < 0.001, ****P < 0.0001. n = 3 for WT; n = 4 for ABE-treated; n = 3 for control-treated. (E) Representative 40× images of the cerebral cortex from control- and ABE-treated LOTS mice stained with anti-NeuN (green), anti-GM2 ganglioside (red), and counterstained with DAPI (blue). Merged images (right panels) show colocalization of GM2 and NeuN; scale bar: 20 μm. (F) Representative 40× images of the cerebral cortex from control- and ABE-treated LOTS mice stained with anti-LAMP1 (green, pseudocolored) and anti-GM2 ganglioside (red). Merged images (right panels) show colocalization of LAMP1 and GM2; scale bar: 10 μm.
Figure 5
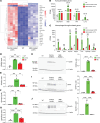
Figure 5. Base-editor treatment reduces brain expression of neuroinflammation markers in LOTS mice.
RNA-Seq was performed on brains from WT, control-treated LOTS, and ABE-treated LOTS male mice at 21 weeks of age (n = 4 per group). The AAV-treated mice each received 2.4 × 10¹² vg. Brains were harvested, RNA was extracted, and transcriptome analysis was performed using the NovoMagic platform (Novogene). (A) Heatmap showing row z scores for the top 25 genes significantly differentially expressed between control-treated LOTS and WT mice. Each column represents an individual mouse. (B and C) Expression of astrocyte-related genes (B) and macrophage/microglia-related genes (C) shown as fragments per kilobase of transcript per million mapped reads (FPKM). Data are presented as mean ± SD; each dot represents 1 mouse. ***P < 0.001 (1-way ANOVA with Bonferroni’s correction). (DG) Quantitative PCR validation of RNA-Seq results. Expression of CD68, GFAP, Gpnmb, and Lgals3bp mRNA in WT, control-treated, and ABE-treated mouse brains. n = 4 per group. Data are expressed as mean ± SD. **P < 0.01, ***P < 0.001, ****P < 0.0001 (1-way ANOVA with Bonferroni’s correction). (HJ) Western blot validation of protein expression. Representative blots (left) and quantification (right) for CD68 (H), GFAP (I), and Gpnmb (J) in brain extracts from WT, control-treated LOTS, and ABE-treated LOTS mice. β-Actin served as a loading control. n = 3 per group. Data are expressed as mean ± SD. **P < 0.01, ****P < 0.0001 (1-way ANOVA with Bonferroni’s correction).
Figure 6
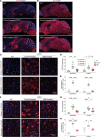
Figure 6. Base-editor treatment reduces glial-cell response in the brain of LOTS mice.
WT, control-treated LOTS, and ABE-treated LOTS mice were euthanized at 21 weeks of age, and sagittal brain sections were immunostained (n = 4 per group unless otherwise indicated). The AAV-treated mice each received 2.4 × 10¹² vg. (A and B) Representative sagittal brain sections stained with anti-GFAP (A) or anti-Iba1 (B) antibodies (red) and counterstained with DAPI (blue); scale bar: 1 mm (C and F) Representative 40× images of the cerebral cortex (top panels) and brain stem (bottom panels) stained with anti-GFAP (C) or anti-Iba1 (F) antibodies (red) and counterstained with DAPI (blue); scale bar: 20 μm. (D and G) Quantification of GFAP (D) and Iba1 (G) fluorescence intensity in cortex and brain stem regions. Small gray symbols represent image-level measurements (technical replicates); large colored symbols indicate per-mouse means (biological replicates). Statistical analysis was performed using a mixed-effects model with Tukey’s correction. *P < 0.05, **P < 0.01, ***P < 0.001, ****P < 0.0001. n = 3 for WT, n = 4 for ABE-treated, n = 3 for control-treated. (E and H) Quantification of activated astrocytes (E) and reactive microglia (H), expressed as the percentage of GFAP+ DAPI+ (E) or Iba1+ DAPI+ (H) cells relative to total DAPI+ nuclei. Cell counts were performed using Fiji software. Small gray symbols represent technical replicates; large colored symbols indicate biological replicates. Statistical significance was assessed using a mixed-effects model with Tukey’s correction. *P < 0.05, **P < 0.01, ****P < 0.0001. n = 3 for each group (WT, control-treated, ABE-treated).
Figure 7
Figure 7. Base-editor treatment mitigates disease manifestations and prolongs the lifespan of LOTS mice.
(A) Body-weight progression of control- and ABE-treated LOTS mice. The AAV-treated mice each received 2.4 × 10¹² vg. Mean ± SD shown by sex at each time point (n = 6 female and n = 4 male ABE-treated; n = 3 female and n = 4 male control-treated). *P < 0.05, **P < 0.01, ***P < 0.001 (Student’s t test). (B) Ataxia scores based on 6 behavioral assessments (Figure 2H) collected weekly after treatment until death. Data shown as mean ± SD (n = 34 ABE-treated, n = 32 control-treated; includes all mice in Supplemental Table 2). *P < 0.05, **P < 0.01, ****P < 0.0001 (Student’s t test). (C) Left: Kaplan-Meier survival plot for ABE- and control-treated LOTS mice (n = 10 and n = 7, respectively). P < 0.0001 (log-rank test). Right: median survival of each group. Each dot represents 1 mouse. ****P < 0.0001 (1-way ANOVA with Bonferroni’s correction). (D) On-target editing efficiency at HEXA c.805A site in brain, spinal cord, and liver DNA from end-stage ABE-treated LOTS mice (age 45–52 weeks). A-to-G conversion shown as mean ± SD from next-generation sequencing (n = 10 brain; n = 5 spinal cord and liver). ****P < 0.0001 (1-way ANOVA). (E) Heatmaps of A-to-G editing at the on-target locus in brain (right) and spinal cord (left) of individual end-stage ABE-treated mice. Protospacer sequence shown above; uppercase = exon, lowercase = intron. (F) Brain GM2 ganglioside levels in control-treated (21 weeks), ABE-treated (21 weeks), and end-stage ABE-treated LOTS mice. Left: representative high-performance TLC plate of gangliosides (0.5% of hemisphere extract). Arrow marks GM2 standard. Right: quantification of GM2 levels relative to control (set at 100%). Mean ± SD (n = 4/group). *P < 0.05, ****P < 0.0001; ns = not significant (ANOVA with Bonferroni’s correction).

Similar articles

References

    1. Toro C, et al. The GM2 gangliosidoses: unlocking the mysteries of pathogenesis and treatment. Neurosci Lett. 2021;764:136195. doi: 10.1016/j.neulet.2021.136195. - DOI - PMC - PubMed
    1. Regier DS, et al. The GM1 and GM2 gangliosidoses: natural history and progress toward therapy. Pediatr Endocrinol Rev. 2016;13 Suppl 1(suppl 1):663–673. - PMC - PubMed
    1. Neudorfer O, et al. Late-onset Tay-Sachs disease: phenotypic characterization and genotypic correlations in 21 affected patients. Genet Med. 2005;7(2):119–123. doi: 10.1097/01.GIM.0000154300.84107.75. - DOI - PubMed
    1. Lopshire MC, et al. The diagnostic journey for patients with late-onset GM2 gangliosidoses. Mol Genet Metab Rep. 2023;37:101014. doi: 10.1016/j.ymgmr.2023.101014. - DOI - PMC - PubMed
    1. Shapiro BE, et al. Late-onset Tay-Sachs disease: the spectrum of peripheral neuropathy in 30 affected patients. Muscle Nerve. 2008;38(2):1012–1015. doi: 10.1002/mus.21061. - DOI - PubMed