. 2025 Jun 17;135(16):e183741.
doi: 10.1172/JCI183741. eCollection 2025 Aug 15.

β Cell Gαs signaling is critical for physiological and pharmacological enhancement of insulin secretion

Affiliations

β Cell Gαs signaling is critical for physiological and pharmacological enhancement of insulin secretion

Megan E Capozzi et al. J Clin Invest. .

Abstract

The incretin peptides glucose-dependent insulinotropic polypeptide and glucagon-like peptide-1 receptors coordinate β cell secretion that is proportional to nutrient intake. This effect permits consistent and restricted glucose excursions across a range of carbohydrate intake. The canonical signaling downstream of ligand-activated incretin receptors involves coupling to Gαs protein and generation of intracellular cAMP. However, recent reports have highlighted the importance of additional signaling nodes engaged by incretin receptors, including other G proteins and β-arrestin proteins. Here, the importance of Gαs signaling was tested in mice with conditional, postdevelopmental β cell deletion of Gnas (encoding Gαs) under physiological and pharmacological conditions. Deletion of Gαs/cAMP signaling induced immediate and profound hyperglycemia that responded minimally to incretin receptor agonists, a sulfonylurea, or bethanechol. While islet area and insulin content were not affected in Gnasβcell-/-, perifusion of isolated islets demonstrated impaired responses to glucose, incretins, acetylcholine, and IBMX In the absence of Gαs, incretin-stimulated insulin secretion was impaired but not absent, with some contribution from Gαq signaling. Collectively, these findings validate a central role for cAMP in mediating incretin signaling, but also demonstrate broad impairment of insulin secretion in the absence of Gαs that causes both fasting hyperglycemia and glucose intolerance.

Keywords: Diabetes; Endocrinology; G proteins; Insulin; Metabolism.


Conflict of interest statement

Conflict of interest: The Campbell lab receives funding for basic science from Eli Lilly, Novo Nordisk, and Merck, and JEC has served as an advisor/consultant in the past 12 months for Altimmune, Arrowhead Pharma, Boehringer Ingelheim, Septerna, and Structure Therapeutics. DAD has served as an advisor/consultant in the past 12 months for Eli Lilly, Arrowhead Pharma, and Structure Therapeutics. DJH receives licensing revenue from Celtarys Research for provision of GLP1R/GIPR chemical probes. The University of Birmingham and Leibniz-Forschungsinstitut für Molekulare Pharmakologie filed patent WO2024133236 (“Peptide conjugates for labelling endogenous GIPR and GLP1R”) with inventors DJH and Johannes Broichhagen. The University of Birmingham filed patent WO GB WO2024062254A1 (“Gc-globulin for use in treating diabetes”) with inventors DJH, KV, and Martin Hewison. Oxford University Innovation Ltd. filed a PCT patent application on March 14, 2025 (PCT/GB2025/050523, “Combination therapy”) with inventors DJH, KV, Ali Shilleh, and Martin Hewison), which is due to be published on September 14, 2025. MJM has equity in State 4 Therapeutics. FSW and KWS are employees of Eli Lilly. JEC is the guarantor of this work.

Figures

Figure 1
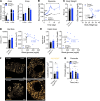
Figure 1. Characterization of Gnasβcell–/– mouse islets.
(A) Gnas and Gnaq expression in β cell– and α cell–enriched populations (n = 4–5). (B) Ambient fed glycemia over time in 6- to 8-week-old control (n = 29) and Gnasβcell–/– (n = 23) mice at start of tamoxifen delivery (day 0). (C) Body weight of control (n = 24) and Gnasβcell–/– (n = 15) mice and its correlation with fed glycemia. (D) Average islet size and its correlation with blood glucose at the time of sacrifice in control (n = 7) and Gnasβcell–/– (n = 9) mice and its correlation with fed glycemia. (E) Insulin-positive area per total pancreas area in control (n = 7) and Gnasβcell–/– (n = 9) mice. (F) Insulin granule number (localizations/μm2) from control and Gnasβcell–/– mice, with representative images of insulin granules (n = 41 cells from 3 mice per group). Dashed box represents the area selected for zoom, shown in right-hand panel. Scale bars: 18.9 μm (left panels), 1.98 μm (right panels). (G) Proinsulin levels at baseline (t = 0) and 10 minutes after meal challenge with Ensure (t = 10). Data are shown as mean ± SEM, *P < 0.05 as indicated. Data were analyzed by 2-tailed Student’s t test (A and CG), 2-way ANOVA (B and G), or linear regression (CE). dSTORM, direct stochastic optical reconstruction microscopy.
Figure 2
Figure 2. Gnasβcell–/– mice are hyperglycemic and do not secrete insulin in response to glucose or meal challenge.
(A) Intraperitoneal glucose tolerance test (IPGTT) (1.5 g/kg) in control (n = 24) and Gnasβcell–/– mice (n = 15) and insulin at baseline (t = 0) and 10 minutes after injection (t = 10) in control (n = 20) and Gnasβcell–/– mice (n = 13). (B) Mixed-meal tolerance test with Ensure (10 μL/g) in control (n = 23) and Gnasβcell–/– mice (n = 15) and insulin at baseline (t = 0) and 10 minutes after injection (t = 10) in control (n = 23) and Gnasβcell–/– mice (n = 15). (C) Insulin levels in 5-hour-fasted mice, (D) glycemia after 5-hour fast, and (E) the insulin/glucose ratio for 5-hour-fasted mice (n = 22, 15). Data are shown as mean ± SEM, *P < 0.05 as indicated. Data were analyzed by 2-way ANOVA of glycemia data (A and B) or 2-tailed Student’s t test (AE).
Figure 3
Figure 3. Gnasβcell–/– islets have an impaired insulin secretory response to both cAMP-dependent and -independent stimulation.
(A) Insulin secretion from control or Gnasβcell–/– islets in response to increasing glucose doses, acetylcholine (Ach; 10 nM), IBMX (100 μM), and KCl (30 mM) and iAUC of each treatment (n = 3). (B) cAMP traces in control and Gnasβcell–/– islets (n = 55, 34). (C) Representative blot of pPKA substrates in control- or IBMX-treated islets from control or Gnasβcell–/– mice. (D) The independent and combined effects of Gnas deletion or treatment with Ex9 on insulin secretion in response to an IBMX ramp (n = 3). (E) Insulin secretion from an FSK ramp in control (n = 4) or Gnasβcell–/– (n = 7) islets and iAUC of each treatment (n = 3). (F) Insulin secretion in control and Gnasβcell–/– islets in response to ramping concentrations of Sp-8-BnT-cAMPS (n = 4, 5). Data are shown as mean ± SEM, *P < 0.05 as indicated. Data were analyzed by 2-way ANOVA of iAUC (A and DF).
Figure 4
Figure 4. Loss of Gnas in β cells partially impairs incretin-stimulated insulin secretion.
(A) Insulin secretion in response to GIP (3 nM) stimulation in control or Gnasβcell–/– islets in the presence or absence of GIPR antibody (300 nM) and iAUC of GIP-stimulated insulin secretion (n = 1–6). (B) Insulin secretion in response to GLP-1 (10 pM) stimulation in control or Gnasβcell–/– islets in the presence or absence of Ex9 (1 μM) and iAUC of GLP-1–stimulated insulin secretion (n = 5–7). (C) Insulin secretion in response to GIP (3 nM) stimulation in control or Gnasβcell–/– islets in the presence or absence of the Gq inhibitor YM254890 (100 nM) and iAUC of GIP-stimulated insulin secretion (n = 5–6). (D) Insulin secretion in response to GLP-1 (10 and 300 pM) stimulation in control or Gnasβcell–/– islets in the presence or absence of the Gq inhibitor YM254890 (100 nM) or Ex9 (1 μM) and iAUC of GLP-1–stimulated insulin secretion (n = 5–6). Data are shown as mean ± SEM, *P < 0.05 as indicated. Data were analyzed by 2-way ANOVA of iAUC.
Figure 5
Figure 5. β Cell Gnas expression is necessary for incretin-stimulated insulin secretion in vivo.
(AD) Control (n = 34) or Gnasβcell–/– (n = 23) mice were treated with PBS, D-Ala2-GIP (A and B), or Ex4 (C and D) at t = –10 minutes. Mice were then challenged with i.p. glucose (1.5 g/kg) and iAUC presented from t = 0. Insulin secretion in D-Ala2-GIP–challenged (B, n = 23,14) and Ex4-challenged (D, n = 21,13) mice are shown at baseline (t = 0) and 10 minutes after glucose challenge (t = 10). Data are shown as mean ± SEM, *P < 0.05 as indicated. Data were analyzed by 2-way ANOVA of glycemic curves and insulin levels or 2-tailed Student’s t test of the iAUCs.
Figure 6
Figure 6. β Cell Gnas is necessary for glucose lowering in response to Gαs-independent, islet-targeted therapies.
(A) Glycemia and iAUC from control (n = 28–34) and Gnasβcell–/– mice (n = 16–23) treated with PBS or bethanechol (Beth; 2 mg/kg) by i.p. injection 10 minutes before (t = –10) i.p. glucose challenge (t = 0; 1.5 g/kg). (B) Insulin at baseline (t = 0) and 10 minutes after glucose injection (t = 10) in control (n = 18) and Gnasβcell–/– mice (n = 7). (C) Glycemia, percent of baseline glycemia, and integrated area above the curve (iAAC) from tolbutamide (100 mg/kg) gavage in control (n = 28) and Gnasβcell–/– (n = 16) mice. (D) Glycemia, percent of baseline glycemia, and iAAC from insulin tolerance test (1 U/kg) in control (n = 8) and Gnasβcell–/– (n = 7) mice. (E) Glycemia after dapagliflozin (10 mg/kg) gavage in control (n = 19) and Gnasβcell–/– (n = 14) mice. SGLT2i, SGLT2 inhibitor. Data are shown as mean ± SEM, *P < 0.05 as indicated. Data were analyzed by 1-way ANOVA of glycemia (E), 2-way ANOVA of glycemic curves and insulin levels, or 2-tailed Student’s t test of the iAUCs.

Similar articles

References

    1. Kahn SE. Beta cell failure: causes and consequences. Int J Clin Pract Suppl. 2001;123:13–18. - PubMed
    1. Thomas DD, et al. Hyperinsulinemia: an early indicator of metabolic dysfunction. J Endocr Soc. 2019;3(9):1727–1747. doi: 10.1210/js.2019-00065. - DOI - PMC - PubMed
    1. Xing J, Chen C. Hyperinsulinemia: beneficial or harmful or both on glucose homeostasis. Am J Physiol Endocrinol Metab. 2022;323(1):E2–E7. doi: 10.1152/ajpendo.00441.2021. - DOI - PubMed
    1. Mirzadeh Z, et al. Central nervous system control of glucose homeostasis: a therapeutic target for type 2 diabetes? Annu Rev Pharmacol Toxicol. 2022;62:55–84. doi: 10.1146/annurev-pharmtox-052220-010446. - DOI - PMC - PubMed
    1. Campbell JE, Newgard CB. Mechanisms controlling pancreatic islet cell function in insulin secretion. Nat Rev Mol Cell Biol. 2021;22(2):142–158. doi: 10.1038/s41580-020-00317-7. - DOI - PMC - PubMed