. 2025 Jun 17;20(6):e0326212.
doi: 10.1371/journal.pone.0326212. eCollection 2025.

Integrated multi-omics analysis and predictive modeling of heart failure using sepsis-related gene signature

Affiliations

Integrated multi-omics analysis and predictive modeling of heart failure using sepsis-related gene signature

Yiping Lang et al. PLoS One. .

Abstract

Background: Heart failure (HF) is characterized by complex molecular alterations, and recent studies suggest a potential role for sepsis-related genes in cardiovascular dysfunction. This study aimed to develop a predictive model for HF based on sepsis-related gene signatures.

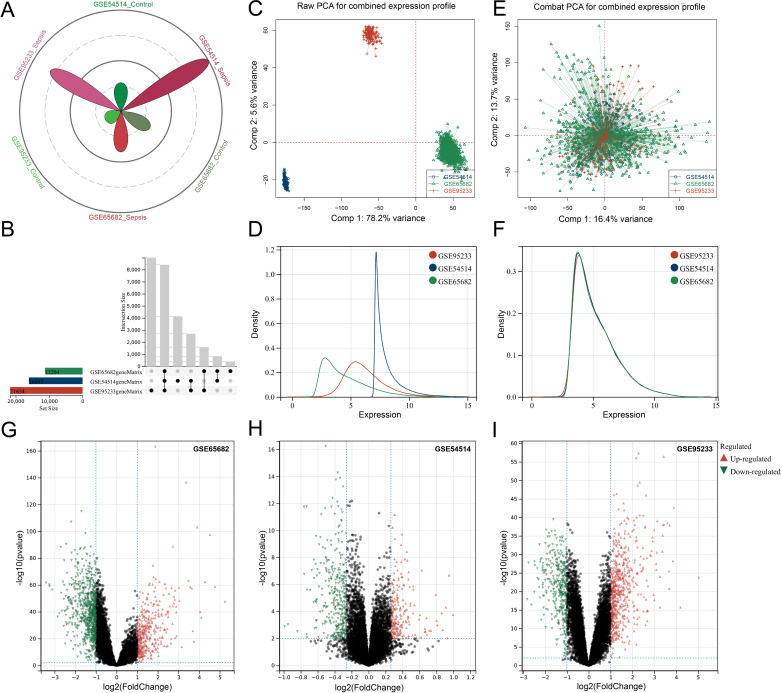
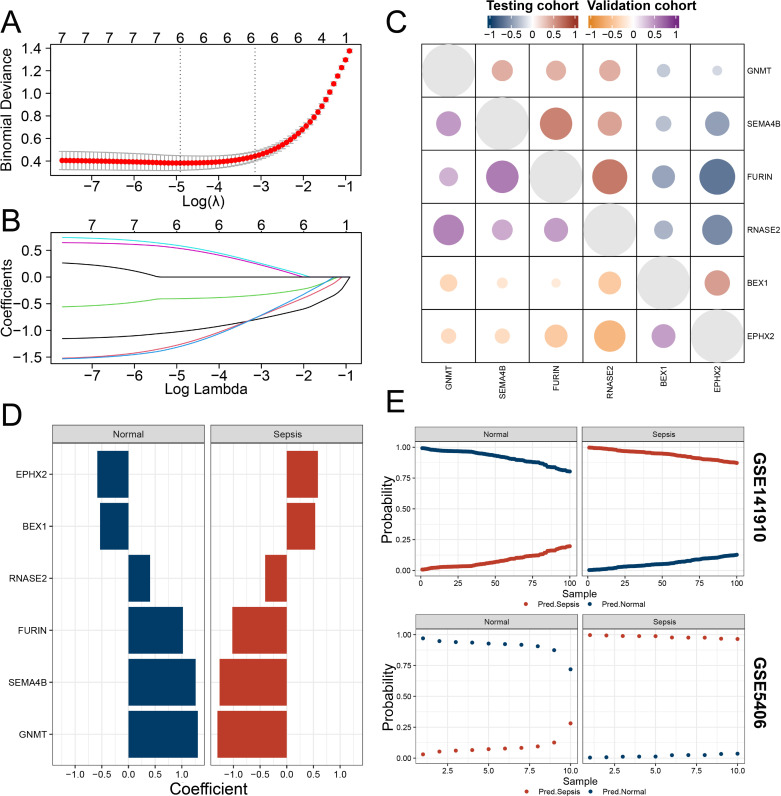
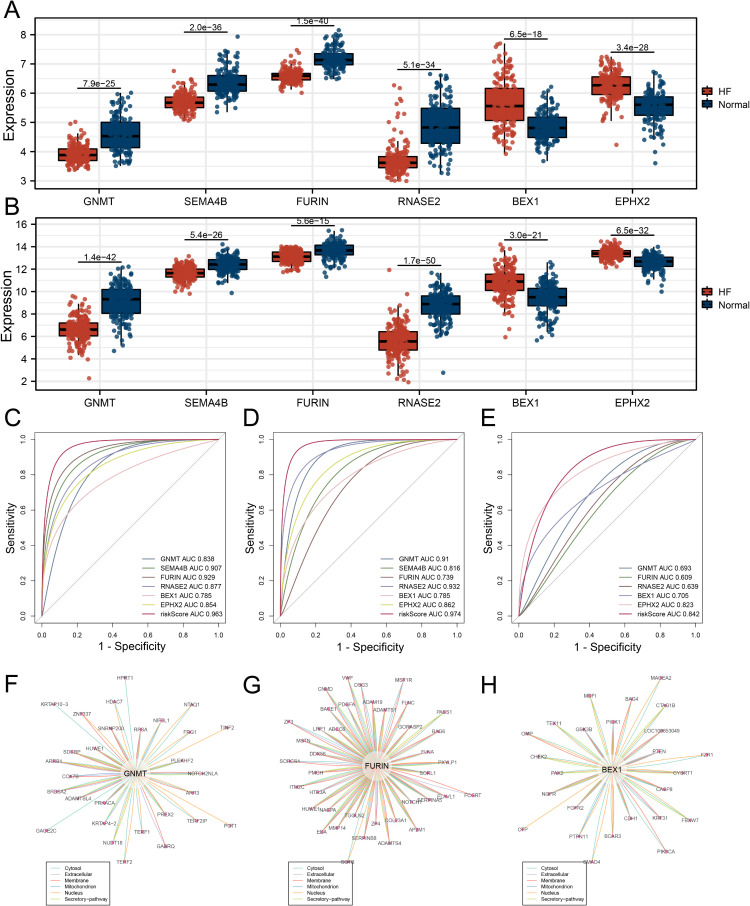
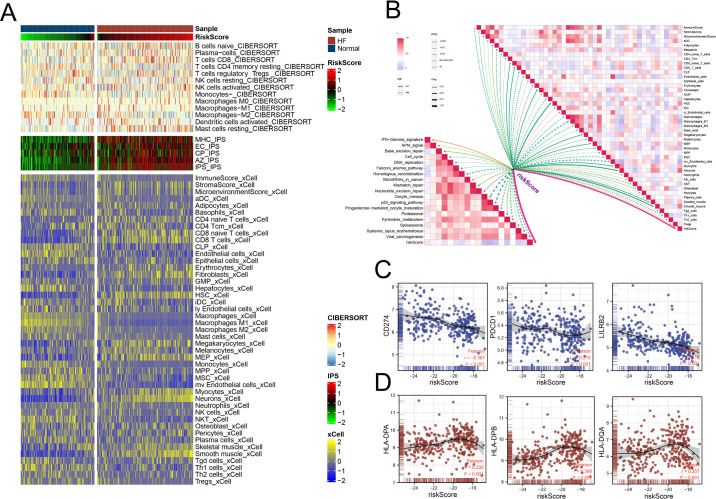
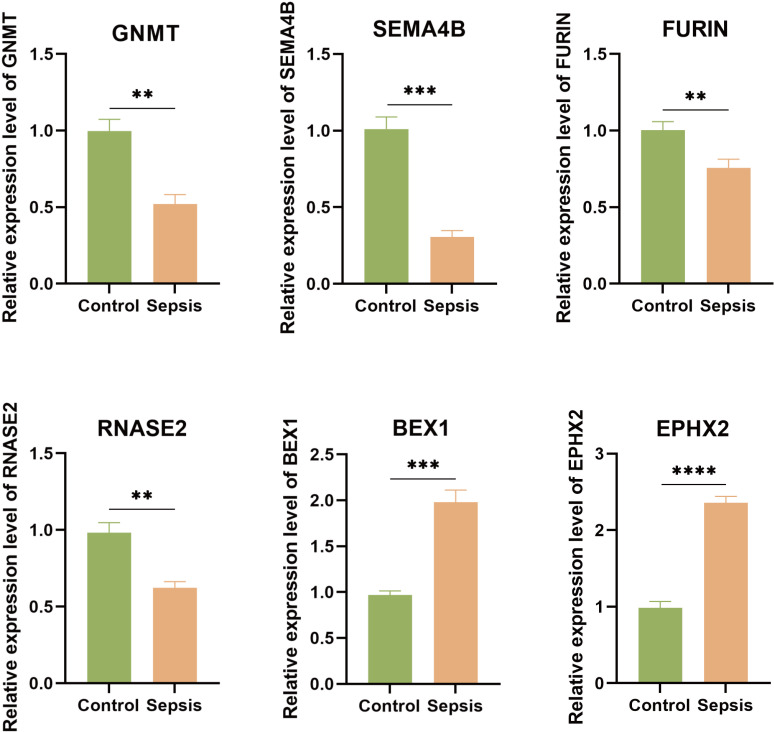
Methods: Three sepsis-related datasets (GSE65682, GSE54514, and GSE95233) were analyzed to identify differentially expressed genes (DEGs) following batch effect correction using the ComBat algorithm. With the use of elastic net regularization and the glmnet package in R, Lasso Cox regression was employed to screen out gene signatures. A predictive model was developed based on the expression of each gene signature and the co-efficient values. In addition, the predictive model was validated on independent HF datasets (GSE57345, GSE141910, and GSE5406). Model performance was assessed through receiver operating characteristic (ROC) analysis and AUC values of each gene signature, and immune infiltration was evaluated using CIBERSORT, IPS, and xCell. Sepsis models of C57BL/6 mice were established by cecal ligation and puncture (CLP).

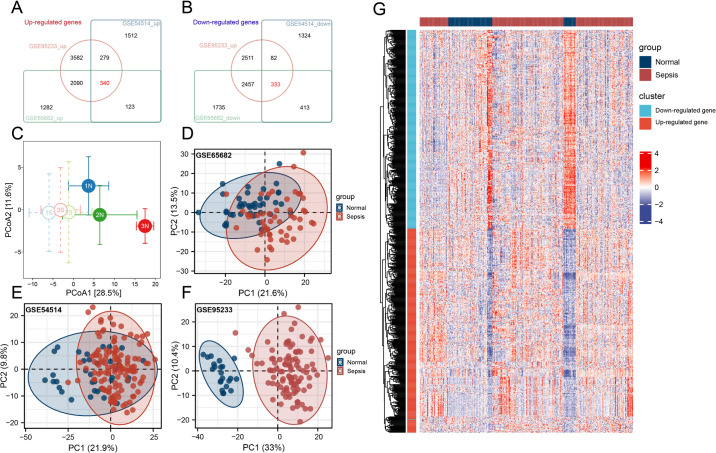
Results: We identified 340 up-regulated and 333 down-regulated sepsis-related genes. The predictive model, incorporating six key genes, demonstrated superior performance compared to individual genes across both training and validation datasets with the AUC value of the risk score above 0.9, significantly higher than that of a single gene. Immune infiltration profiles differed significantly between HF patients and controls, with more pronounced alterations observed at higher risk score levels. Finally, the expression of six key genes in sepsis models was confirmed to be consistent with our prediction.

Conclusion: The model constructed through sepsis-related characteristic genes provides a highly advantageous method for predicting HF, and the characteristic genes we have screened may be potential biomarkers for predicting HF. This model has potential application value in early diagnosis and risk stratification, which can help improve the clinical management of heart failure and provide new ideas for preventing HF.


Conflict of interest statement

The authors have declared that no competing interests exist.

Figures

Fig 1
Fig 1. Batch Effect Correction of Multi-Dataset Integration and Differential Expression Analysis.
(A) Petal diagram illustrating the sample size distribution for sepsis and control groups across GSE65682, GSE54514, and GSE95233. (B) UpSet plot depicting the intersection and unique gene sets among the three datasets. (C) PCA plot before batch correction, showing dataset-specific clustering, indicating batch effects. (D) Density plot illustrating significant differences in data distribution across datasets before batch correction. (E) PCA plot after Combat correction, demonstrating mixed clustering of samples from different datasets, confirming successful batch effect removal. (F) Density plot after batch correction, showing aligned data distributions with comparable means and variances across datasets. (G-I) Volcano plots for GSE65682 (G), GSE54514 (H), and GSE95233 (I), visualizing the up-regulated (red) and down-regulated (green) genes with p-value < 0.05.
Fig 2
Fig 2. Identification, Dimensionality Reduction, and Expression Visualization of Sepsis-Related Genes.
(A) Venn diagram showing the 340 up-regulated sepsis-associated genes common across the three datasets. (B) Venn diagram displaying the 333 down-regulated sepsis-associated genes shared across the datasets. (C) PCA plot illustrating the inter-cohort distances based on the mean expression and standard error of sepsis-related genes, demonstrating distinct separation between sepsis and control samples. (D-F) PCA plots for individual datasets (GSE65682, GSE54514, and GSE95233) after z-score normalization, showing distinct clustering of sepsis and control samples. (G) Heatmap of sepsis-associated gene expression across all samples, highlighting marked inter-patient variability.
Fig 3
Fig 3. PPI Network and Module Identification of Sepsis-Related Genes.
(A) PPI network of up-regulated sepsis-related genes, constructed using the STRING database, illustrating key molecular interactions and their potential roles in sepsis pathogenesis. (B) PPI network of down-regulated sepsis-related genes, visualizing distinct functional interactions among the proteins involved. (C) Module analysis of the PPI networks using the ‘dynamicTreeCut’ algorithm, identifying six distinct gene modules. Each module contains at least two genes, indicating functional coherence and potential relevance to shared biological processes.
Fig 4
Fig 4. GO and KEGG Pathway Enrichment Analysis of Sepsis-Related Genes.
(A) GO enrichment analysis of up-regulated sepsis-related genes, highlighting enrichment in pathways such as mitotic nuclear division, secretory granule, mitochondrial respirasome, and enzyme binding. (B) GO enrichment analysis of down-regulated sepsis-related genes, showing enrichment in pathways including regulation of metabolic processes, protein binding, nucleoplasm, and intracellular anatomical structures. (C) Merged KEGG pathway enrichment analysis, with red bars representing pathways enriched by up-regulated genes and blue bars indicating pathways enriched by down-regulated genes.
Fig 5
Fig 5. Performance and Validation of the Predictive Model for HF.
(A) Development of the binomial classifier using the regularization parameter that minimized binomial deviance in the training datasets. (B) Expression profiles of the six key genes used to construct the predictive model. (C) Correlation analysis of the expression levels of the six model genes between the training and testing datasets. (D) Analysis of genes with non-zero coefficients, showing that their expression profiles are nearly mutually exclusive. (E) Validation of the predictive model on independent datasets GSE141910 and GSE5406, confirming the model’s ability to differentiate HF patients from healthy controls.
Fig 6
Fig 6. Differential Expression, ROC Analysis, and PPI Network of Model Genes.
(A) Differential expression analysis of the model genes in the training dataset, showing significant differences between HF and control samples. (B) Differential expression analysis in the validation dataset, confirming the significant expression patterns observed in the training dataset. (C) ROC curve analysis in the training dataset, demonstrating that the risk score provides superior predictive performance for HF compared to individual model genes. (D-E) ROC curve analyses in two independent validation datasets, showing that the risk score consistently outperforms individual genes in predicting HF. (F-H) PPI network analysis of GNMT, FURIN, and BEX1, with interactions supported by experimental evidence. The length of the lines reflects the strength of interaction evidence, with shorter lines indicating stronger interactions.
Fig 7
Fig 7. Immune Infiltration and Association with Risk Score in HF Patients.
(A) Immune infiltration analysis using CIBERSORT, IPS, and xCell, showing significant differences between HF patients and control samples, with more pronounced differences at higher risk score levels. (B) Correlation analysis between the risk score and 46 immune-related metrics, demonstrating significant associations. (C) Negative correlation between the risk score and immune checkpoint gene expression. (D) Positive correlation between the risk score and HLA family gene expression.
Fig 8
Fig 8. The Relative Expression Levels of Six Key Genes in Sepsis Models.
The qRT-qPCR results demonstrated that the expression levels of GNMT, SEMA4B, FURIN, and RNASE2 in the sepsis group (n = 9) were significantly lower than those of the control group (n = 9), whereas the relative expression levels of BEX1, and EPHX2 were significantly higher. **p 0.01, ***p 0.001, ****p 0.0001, t-test based p-value.

Similar articles

References

    1. Shankar-Hari M, Harrison DA, Rubenfeld GD. Epidemiology of sepsis and septic shock in critical care units: comparison between sepsis-2 and sepsis-3 populations using a national critical care database. British Journal of Anaesthesia. 2017;119(4):626–36. - PubMed
    1. Gräff I, Goldschmidt B, Glien P, Dolscheid-Pommerich RC, Fimmers R, Grigutsch D. Validity of the Manchester Triage System in patients with sepsis presenting at the ED: a first assessment. Emerg Med J. 2017;34(4):212–8. doi: 10.1136/emermed-2015-205309 - DOI - PubMed
    1. Gotts JE, Matthay MA. Sepsis: pathophysiology and clinical management. BMJ. 2016;353:i1585. - PubMed
    1. Bloom MW, Greenberg B, Jaarsma T, Januzzi JL, Lam CSP, Maggioni AP, et al. Heart failure with reduced ejection fraction. Nat Rev Dis Primers. 2017;3:17058. doi: 10.1038/nrdp.2017.58 - DOI - PubMed
    1. Singer M, Deutschman CS, Seymour CW, Shankar-Hari M, Annane D, Bauer M, et al. The Third International Consensus Definitions for Sepsis and Septic Shock (Sepsis-3). JAMA. 2016;315(8):801–10. doi: 10.1001/jama.2016.0287 - DOI - PMC - PubMed