

Physical model of serum supplemented medium flow in organ-on-a-chip systems
- PMID: 40526698
- PMCID: PMC12173184
- DOI: 10.1371/journal.pone.0322069
Physical model of serum supplemented medium flow in organ-on-a-chip systems
Abstract
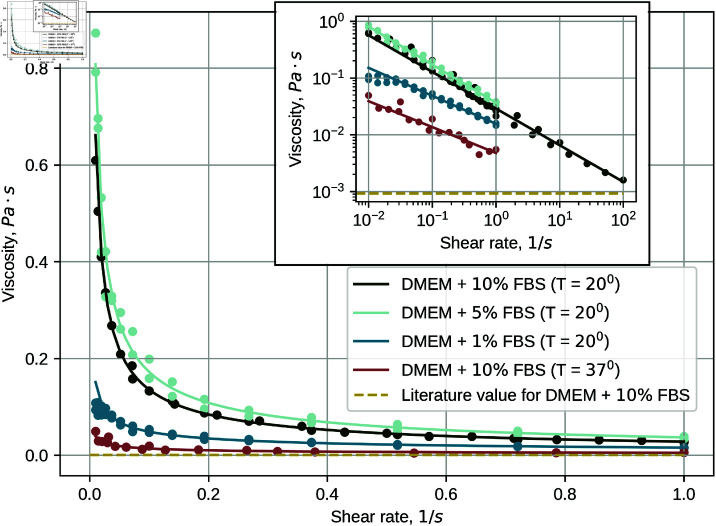
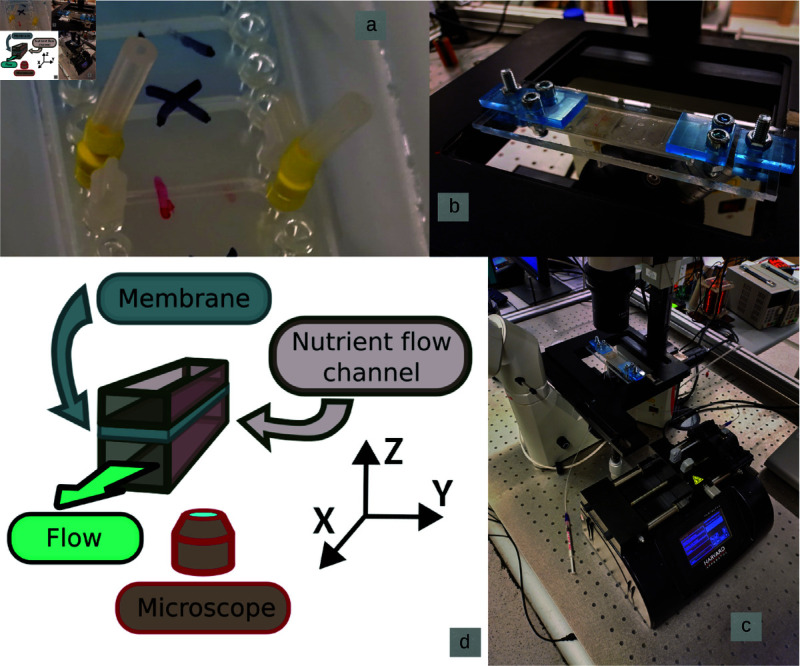
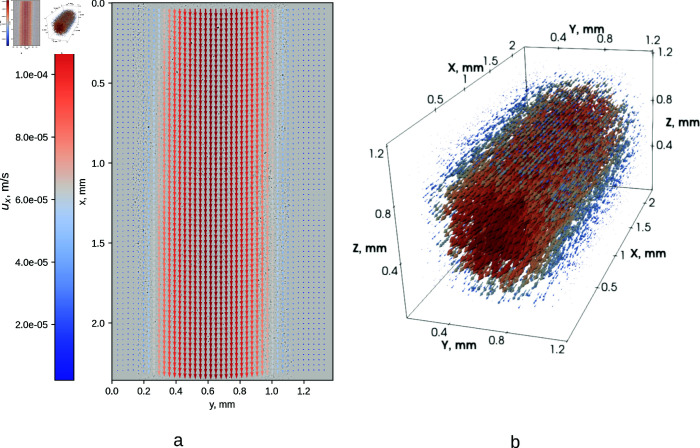
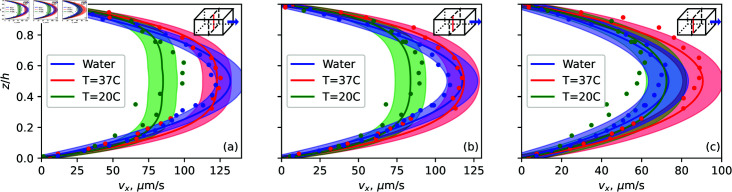
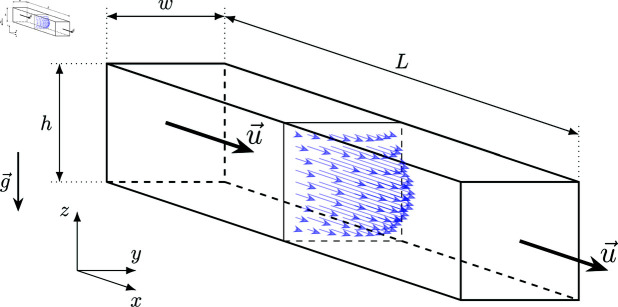
Creating a physiologically relevant shear stress in organ-on-a-chip (OOC) devices requires careful tailoring of microfluidic flow parameters. Currently, it is fairly common to use a simple approximation assuming constant viscosity, even for serum-based media. Here, we show that a popular nutrient solution (Dulbecco's Modified Eagle Medium supplemented with Fetal Bovine Serum) requires a more complex treatment (i.e., is a non-Newtonian fluid), with observed shear stress values significantly greater than reported in literature. We measure the rheology of the solutions and combine it with a 3-dimensional flow field measurement to derive shear stress at the channel surface. We verify the experiments with numerical simulations, finding good agreement and deriving flow properties. Finally, we provide relevant expressions for the shear stress approximation, suitable for development of OOC devices with various geometries.
Copyright: © 2025 Šints et al. This is an open access article distributed under the terms of the Creative Commons Attribution License, which permits unrestricted use, distribution, and reproduction in any medium, provided the original author and source are credited.
Conflict of interest statement
The authors have declared that no competing interests exist.
Figures


Similar articles
-
Multi modal optical coherence tomography flowmetry of organ on chip devices.Sci Rep. 2025 Jul 17;15(1):26013. doi: 10.1038/s41598-025-10089-9. Sci Rep. 2025. PMID: 40676026 Free PMC article.
-
Assessing the comparative effects of interventions in COPD: a tutorial on network meta-analysis for clinicians.Respir Res. 2024 Dec 21;25(1):438. doi: 10.1186/s12931-024-03056-x. Respir Res. 2024. PMID: 39709425 Free PMC article. Review.
-
Cauliflower leaf diseases: A computer vision dataset for smart agriculture.Data Brief. 2025 Apr 28;60:111594. doi: 10.1016/j.dib.2025.111594. eCollection 2025 Jun. Data Brief. 2025. PMID: 40534720 Free PMC article.
-
Prenatal administration of progestogens for preventing spontaneous preterm birth in women with a multiple pregnancy.Cochrane Database Syst Rev. 2019 Nov 20;2019(11):CD012024. doi: 10.1002/14651858.CD012024.pub3. Cochrane Database Syst Rev. 2019. PMID: 31745984 Free PMC article.
-
Fluid flow impacts endothelial-monocyte interactions in a model of vascular inflammatory fibrosis.Sci Rep. 2025 Jan 25;15(1):3227. doi: 10.1038/s41598-025-85987-z. Sci Rep. 2025. PMID: 39863621 Free PMC article.
References
MeSH terms
Substances
LinkOut - more resources
Full Text Sources
