. 2025 Jun;22(227):20240885.
doi: 10.1098/rsif.2024.0885. Epub 2025 Jun 18.

Viscoelastic differences between isolated and live MCF7 cancer cell nuclei resolved with AFM microrheology

Affiliations

Viscoelastic differences between isolated and live MCF7 cancer cell nuclei resolved with AFM microrheology

Ellen Juel Pørtner et al. J R Soc Interface. 2025 Jun.

Abstract

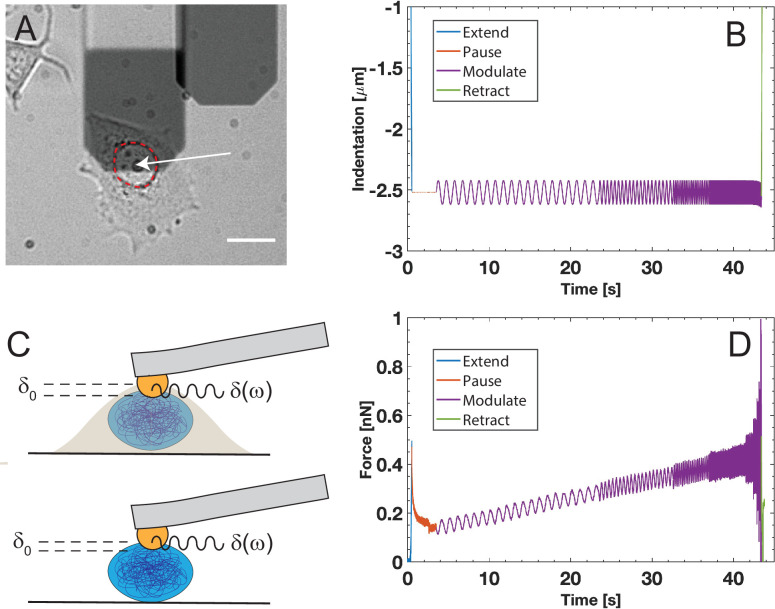
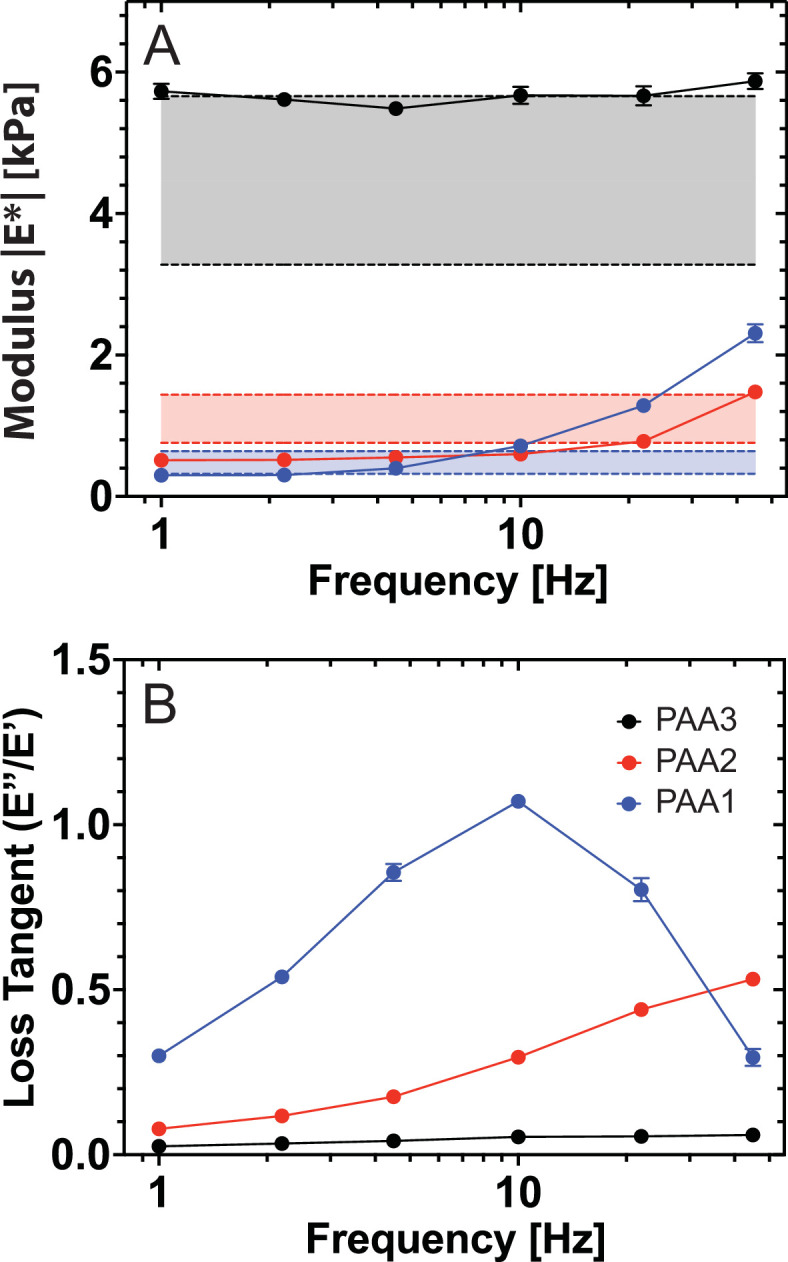
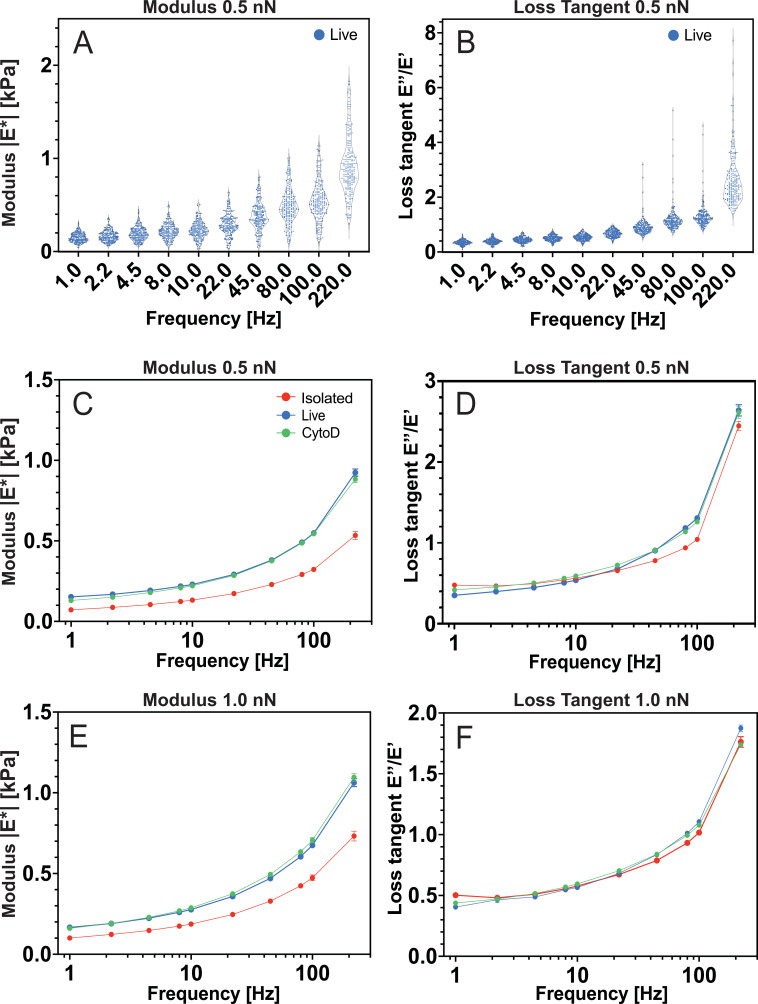
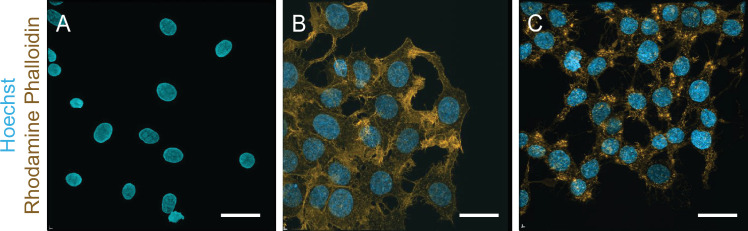
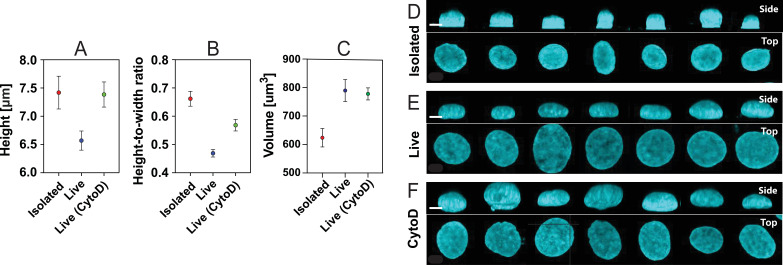
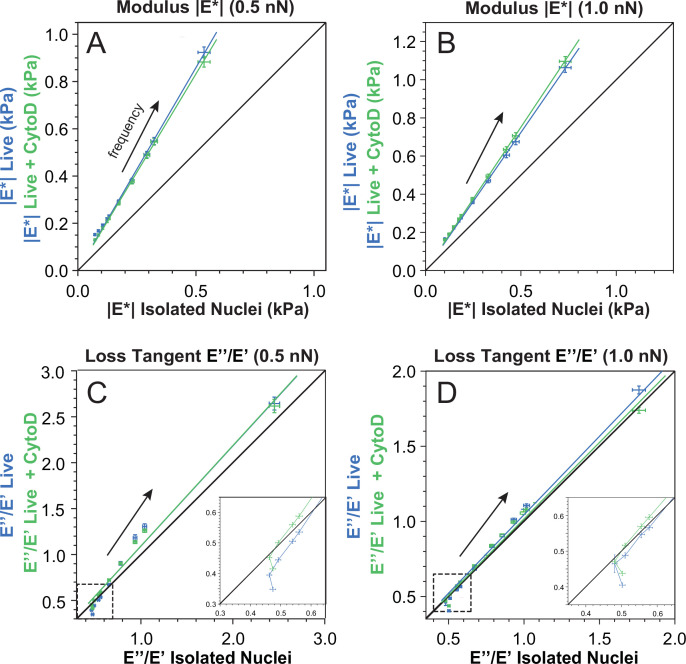
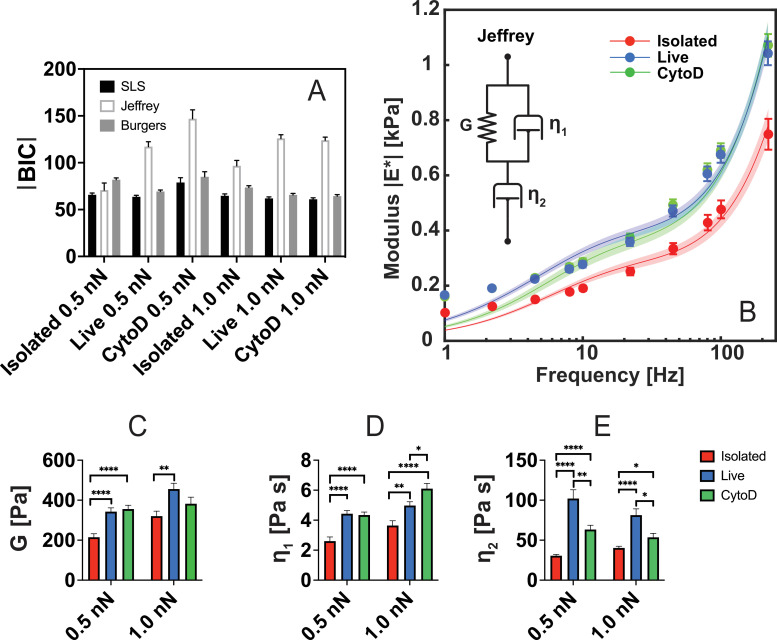
Cell nuclei are commonly isolated for mechanobiology studies although isolated nuclei may display viscoelastic properties differing from those of live cells. Nuclear mechanics is generally dependent on the time scale of the applied load and cannot accurately be assessed by a simple elasticity parameter. Active microrheology with an atomic force microscope (AFMMR) is a versatile tool for probing nuclear mechanics and we employ the technique for exploring isolated and live-cell nuclei in MCF7 cells, including the significance of actin depolymerization. We successfully validate the method using polyacrylamide hydrogels with correction for cantilever drag in the fluid. The AFMMR results reveal that isolated and live-cell nuclei are equivalent to within a scaling factor, in their frequency-dependent modulus, with isolated nuclei being softer. The loss tangent reveals a transition from solid- to liquid-like behaviour occurring at higher frequency in isolated than in live-cell nuclei. Viscoelastic modelling using the Jeffreys model describes the frequency-dependent modulus of all measured nuclei. Model parameters display sensitivity to nuclei isolation and to actin depolymerization in live cells. Sections of the Jeffreys circuit can potentially be assigned to internal and external nucleus structures, respectively, thereby establishing a minimal mechanistic framework for interpreting microrheology data on cell nuclei.

Keywords: MCF7; atomic force microscopy; cell nucleus; microrheology; viscoelasticity.


Conflict of interest statement

We declare we have no competing interests.

Figures

Principle of dynamic AFM Microrheology: (A) Cantilever positioned above a live cell nucleus as highlighted by the red dashed line
Figure 1.
Principle of dynamic AFM microrheology: (A) cantilever positioned above a live-cell nucleus as highlighted by the red dashed line. The colloidal probe is located at the end of the cantilever as indicated by the arrow (scale bar: 20 μm). The probe indents the nucleus until a pre-defined force setpoint is reached. The corresponding indentation is δ0. The cantilever is held at fixed height for 3 s to allow for relaxation of the material, followed by a modulation of the indentation (B). During modulation, the cantilever indentation oscillates in feedback at increasing frequencies ω. The position of the cantilever relative to δ0 is defined as δ(ω) (C). Typical recording on a live-cell nucleus with indentation (B) and force (D).
AFM Microrheology of polyacrylamide hydrogels for validation
Figure 2.
AFM microrheology of polyacrylamide hydrogels for validation. The modulus |E| (A) and the loss tangent (B) of the hydrogels are shown as mean ± standard error of the mean. Shaded bands show published frequency-independent AFM indentation results [39] (mean ± standard deviation). The loss tangent resolves a changing ratio between the viscous and elastic response of the hydrogels and correlates with a decreasing ratio [A][BA] of acrylamide and bisacrylamide concentrations in samples PAA1 to PAA3.
Active microrheology data on MCF7 cell nuclei as probed by AFMMR with indentation forces of 0
Figure 3.
Active microrheology data on MCF7 cell nuclei as probed by AFMMR with indentation forces of 0.5 nN and 1 nN. Shown are the modulus |E| (A,C,E) and loss tangent (B,D,F) of isolated nuclei (n=50), live-cell nuclei (n=50) and nuclei in cells treated with 2 μM CytoD (n=50). Data in (A,B) show the full dataset for live nuclei at 0.5 nN while (C–F) show mean values ± standard error of the mean.
Maximum intensity projection of the z-stack of isolated nuclei adhered to glass coverslips with PEI (A), untreated MCF7 cells (B) and cells incubated in 2 M CytoD (C), respectively.
Figure 4.
Maximum intensity projection of the z-stack of isolated nuclei adhered to glass coverslips with PEI (A), untreated MCF7 cells (B) and cells incubated in 2 μM CytoD. Both isolated nuclei and cells were stained with the nucleic acid stain Hoechst 33342 and with the F-actin stain rhodamine phalloidin to monitor actin filament disruption by CytoD. Scale bar, 25 μm.
Morphological comparison of MCF7 cell nuclei based on confocal microscopy.
Figure 5.
Morphological comparison of MCF7 cell nuclei based on confocal microscopy. Height, height-to-width ratio and volume (A–C) of nuclei calculated based on fluorescence z-stack three-dimensional projections (n = 59 isolated, n = 59 live, n = 82 CytoD). Results are shown as mean ± standard error of the mean. Side view and top view of isolated nuclei (D), live-cell nuclei (E) and nuclei in cells treated with 2 μM CytoD (F), obtained from fluorescence microscopy z-stacks. All nuclei are stained with Hoechst 33342. Scale bars, (D–F) 5 μm.
Correlations of the modulus and the loss tangent between isolated and live MCF7 cell nuclei
Figure 6.
Correlations of the modulus and the loss tangent between isolated and live MCF7 cell nuclei. Live-cell data are shown on the y-axis while data for isolated nuclei are on the x-axis (A–D). Error bars are ± standard error of the mean. Solid lines are linear fits and arrows indicate the direction of increasing frequency and the black lines show equality (y=x). Data above the black line indicate that live-cell nuclei are stiffer (A,B) or have a higher loss tangent value (C,D) than isolated nuclei for a given frequency and setpoint force.
Viscoelastic circuit models of AFMMR data for cell nuclei.
Figure 7.
Viscoelastic circuit models of AFMMR data for cell nuclei. Three models (SLS, Jeffreys and Burgers) were fitted to the modulus |E*| of nuclei (n = 50). The Bayesian information criterion (BIC) is used for model selection (A). Jeffreys model has the overall highest |BIC| values, and is chosen for fitting. Fitting of Jeffreys model to the mean modulus |E*| for nuclei at 1.0 nN, with shaded regions indicating the standard error mean (B). Jeffreys model contains three components, which are shown in bar plots with indicators of statistical significance: The spring G (C), the dashpot η1 in parallel with the spring (D), and a second viscous element η2 (E). Error bars in (C)–(E) indicate the standard error of the mean. No marker indicates non-significance (p > 0.05) while asterisks indicate the significance level: *(p < 0.05), **(p < 0.01), ***(p < 0.001), ****(p < 0.0001).

Similar articles

References

    1. Barriga EH, Mayor R. 2019. Adjustable viscoelasticity allows for efficient collective cell migration. Semin. Cell Dev. Biol. 93, 55–68. ( 10.1016/j.semcdb.2018.05.027) - DOI - PMC - PubMed
    1. Suresh S. 2007. Biomechanics and biophysics of cancer cells. Acta Biomater. 3, 413–438. ( 10.1016/j.actbio.2007.04.002) - DOI - PMC - PubMed
    1. Chen YQ, Kuo CY, Wei MT, Wu K, Su PT, Huang CS, Chiou A. 2014. Intracellular viscoelasticity of HeLa cells during cell division studied by video particle-tracking microrheology. J. Biomed. Opt. 19, 011008. ( 10.1117/1.JBO.19.1.011008) - DOI - PubMed
    1. Dahl KN, Ribeiro AJS, Lammerding J. 2008. Nuclear shape, mechanics, and mechanotransduction. Circ. Res. 102, 1307–1318. ( 10.1161/CIRCRESAHA.108.173989) - DOI - PMC - PubMed
    1. Vivante A, Bronshtein I, Garini Y. 2020. Chromatin viscoelasticity measured by local dynamic analysis. Biophys. J. 118, 2258–2267. ( 10.1016/j.bpj.2020.04.002) - DOI - PMC - PubMed

Grants and funding

LinkOut - more resources