. 2025 Jun;14(6):e70112.
doi: 10.1002/jev2.70112.

Single-Cell Analysis Reveals Fibroblast-Derived Migrasomes as CXCL12 Carriers Promoting Skin Wound Repair

Affiliations

Single-Cell Analysis Reveals Fibroblast-Derived Migrasomes as CXCL12 Carriers Promoting Skin Wound Repair

Haoyu Zhou et al. J Extracell Vesicles. 2025 Jun.

Abstract

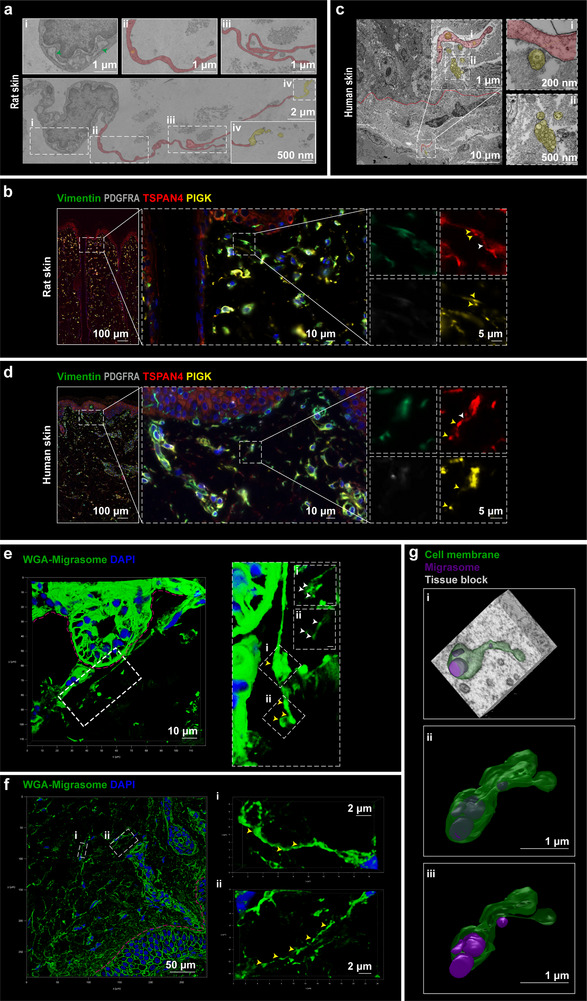
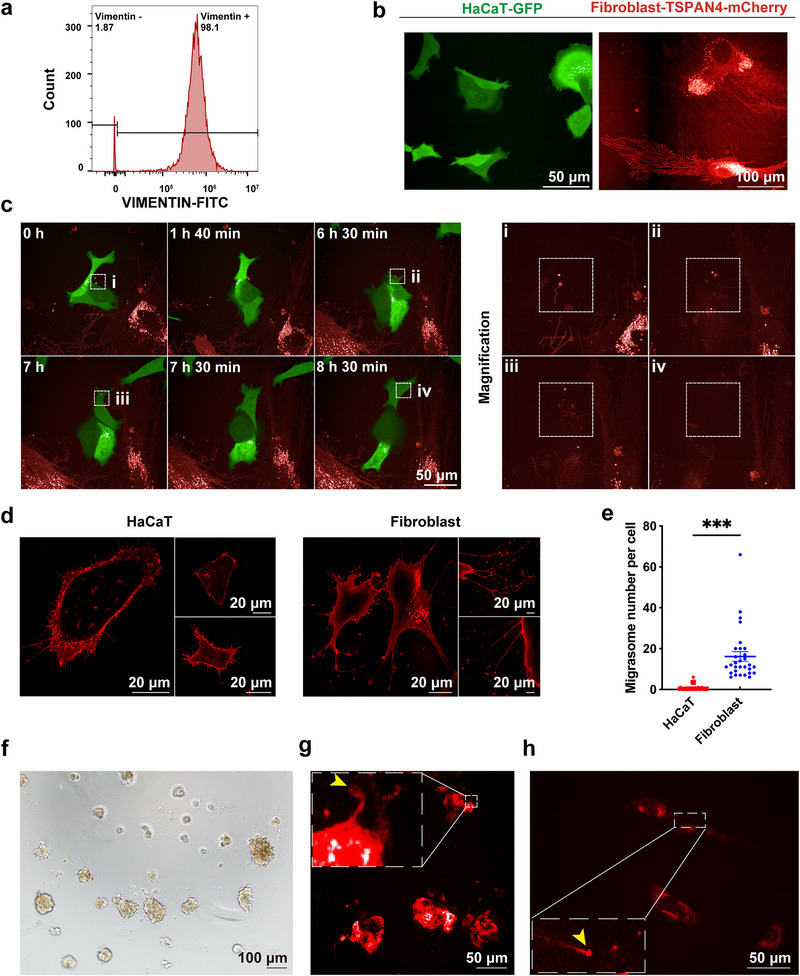
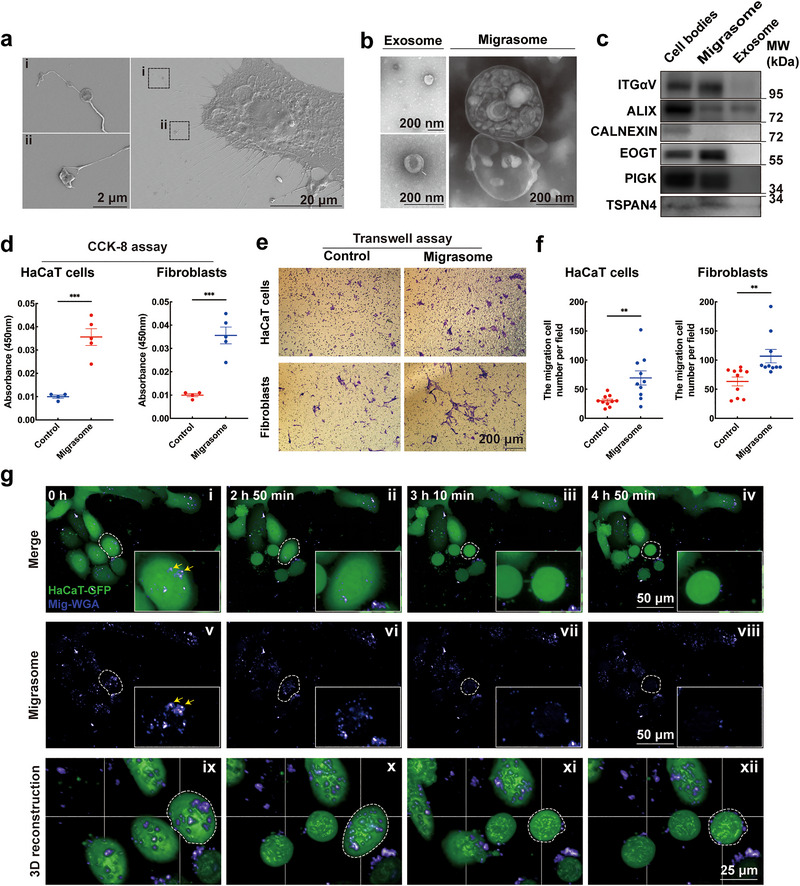
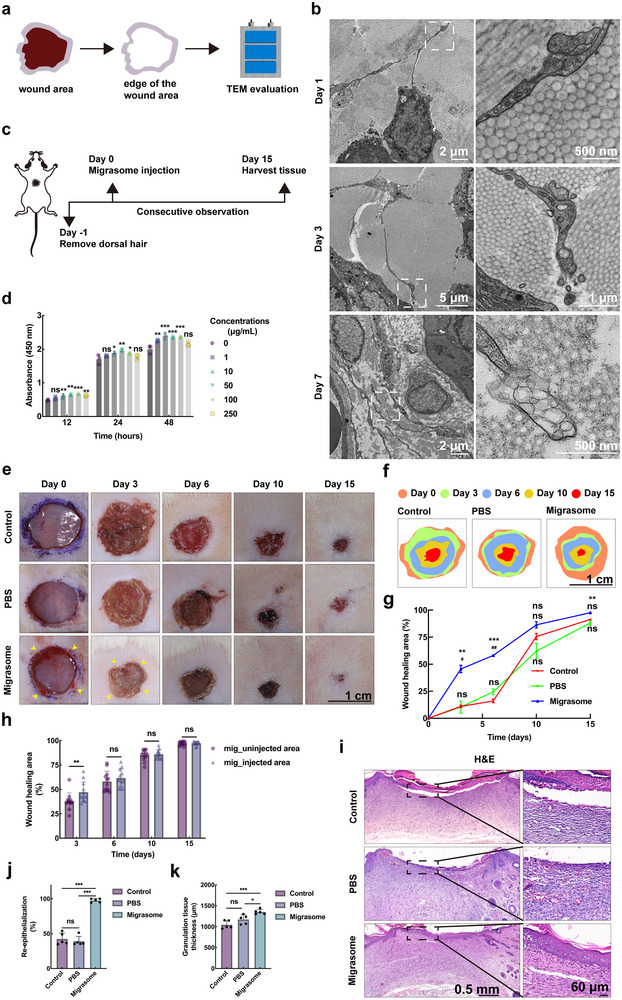
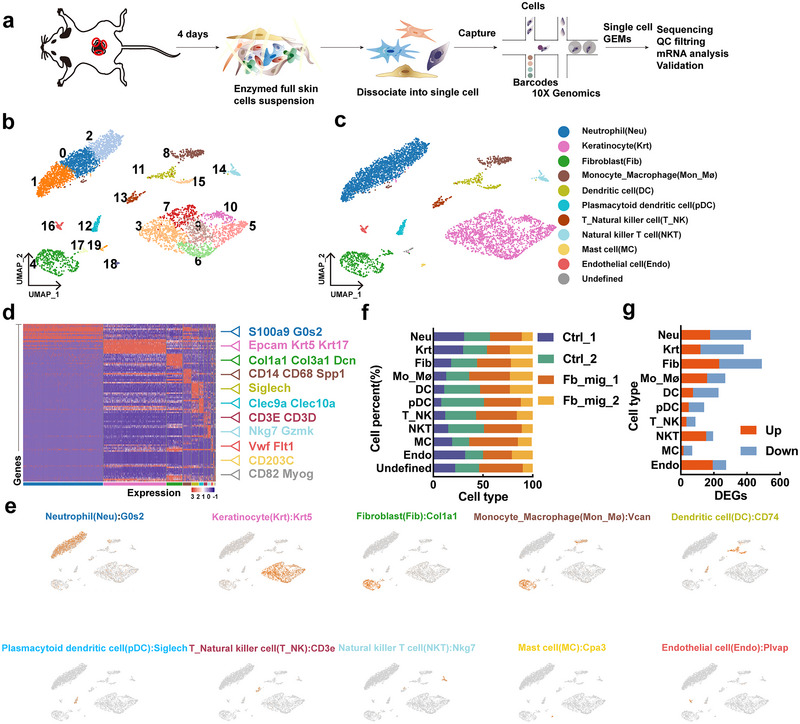
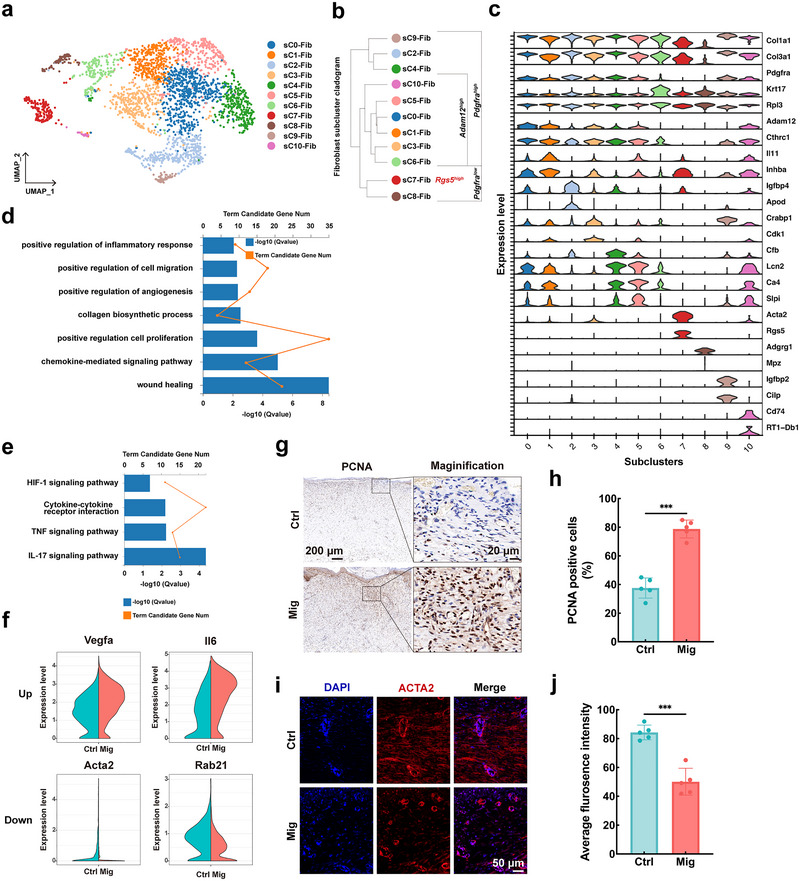
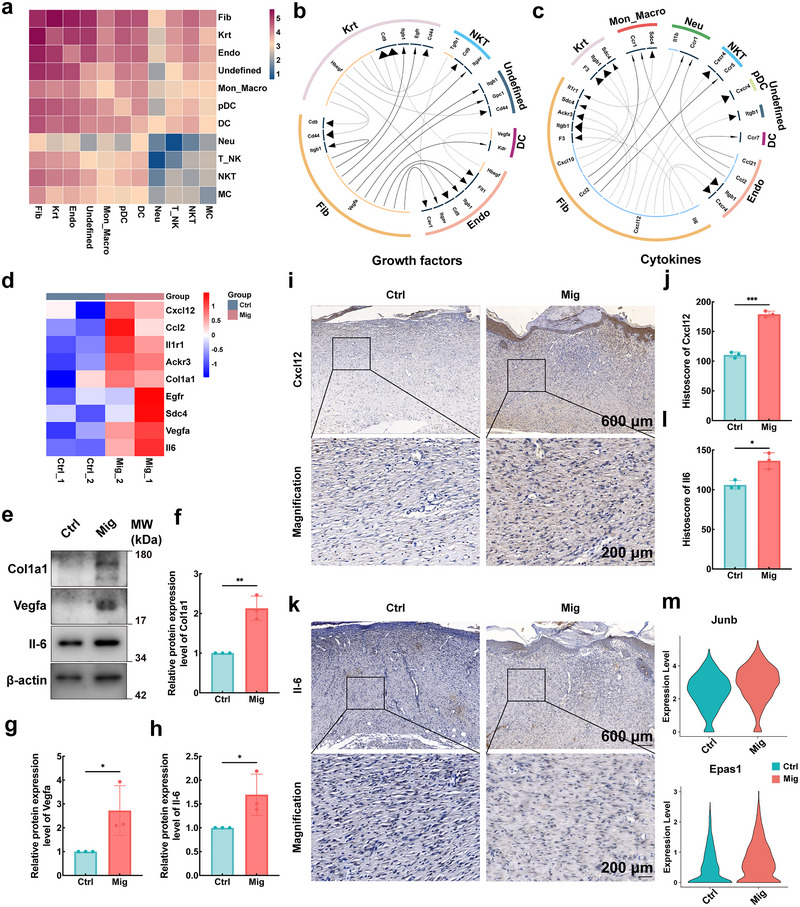
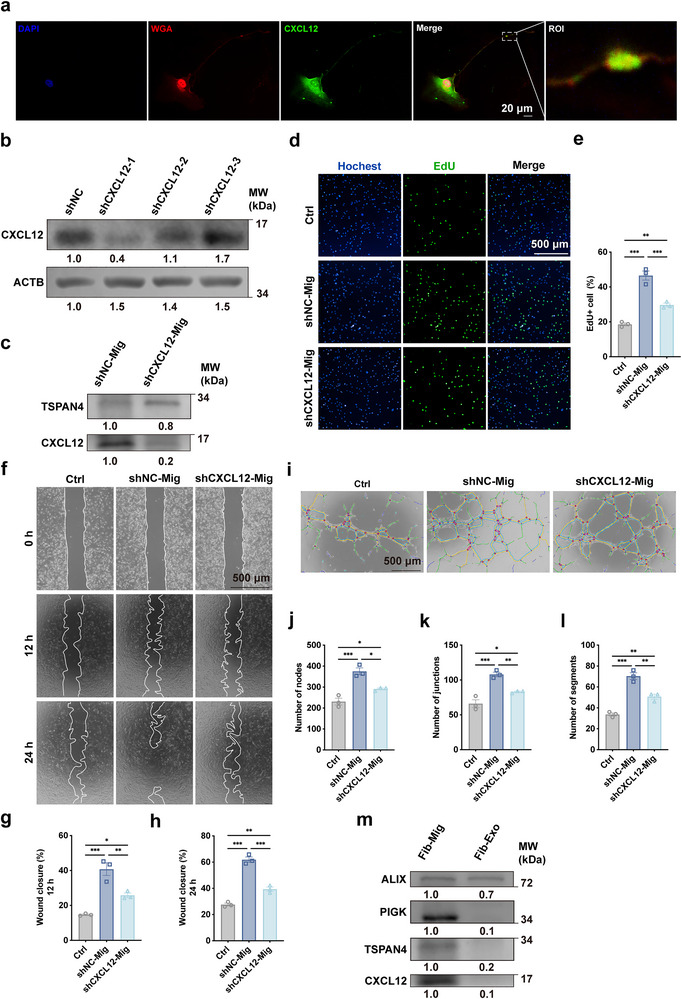
Migrasomes are newly discovered organelles with demonstrated functions in organ morphogenesis and angiogenesis. However, the effect of migrasomes in tissue repair remains unreported. Our super-resolution confocal microscopy and focused ion beam scanning electron microscopy results confirmed that migrasomes were directly connected with retraction fibres and could release their contents into the surroundings in human and rat skins and oral mucosae. Multiplex immunofluorescence staining results revealed that these retraction fibres and migrasomes originated from fibroblasts. Live-cell imaging demonstrated that human oral mucosal fibroblast-derived migrasomes could be taken up by both fibroblasts and HaCaT cells. In addition, the injection of purified fibroblast-derived migrasomes into the edges of rat skin wounds significantly accelerated wound healing. Single-cell sequencing results suggested that the clusters of keratinocytes, fibroblasts, and endothelial cells play key roles in the wound-healing process. Moreover, the expression of Vegfa, Il-6, and Col1a1 in the fibroblast subcluster was significantly upregulated. Furthermore, these purified migrasomes increased the protein levels of VEGFA, IL-6, and COL1A1 in cultured fibroblasts in vitro. Mechanistically, migrasomes may facilitate wound healing by delivering CXCL12. Thus, our research revealed that fibroblast-derived migrasomes are potential therapeutic vesicles for skin wound-healing repair.

Keywords: extracellular vesicles; migrasome; single‐cell RNA sequence; skin wound healing.


Conflict of interest statement

The authors declare no conflicts of interest.

Figures

FIGURE 1
FIGURE 1
Identification of the trace of genuine migrasomes in the skin samples. (a) TEM Analysis of Rat Skin Samples Skin samples from rats were subjected to TEM. Red tints emphasize RFs. Yellow tints emphasize migrasomelike structures. Panels i, ii, iii, and iv exhibit magnified images of the areas of interest. (b) mIF Staining of Rat Skin Samples Rat skin samples were collected and subjected to mIF staining of Vimentin, PDGFRA, TSPAN4, and PIGK. Colocalized Vimentin and PDGFRA immunofluorescence were used to label fibroblasts. Colocalized TSPAN4 and PIGK immunofluorescence was used to label migrasomes. TSPAN4 was used to label RFs. Representative images are displayed. RFs are labelled with a white arrow. Migrasomes are labelled with a yellow arrow. (c) TEM Analysis of Human Skin Samples Human skin samples were subjected to TEM. Red tints emphasize RFs. Yellow tints emphasize migrasomelike structures. (d) mIF Staining of Human Skin Samples Human skin samples were collected and subjected to mIF staining for Vimentin, PDGFRA, TSPAN4, and PIGK. Representative images were displayed. RFs are labelled with a white arrow. Migrasomes are labelled with a yellow arrow. (e), (f) Super‐resolution Confocal microscopy of human skin samples: Human skin samples were collected and subjected to staining for WGA. Representative images were displayed. Scale bars in subpanels (i) and (ii) were 2 µm. The red line indicated the intersection of the epidermis and dermis. (g) FIB‐SEM analysis of human skin samples: Human skin samples were collected and subjected to FIB‐SEM analysis. Representative images were displayed.
FIGURE 2
FIGURE 2
Fibroblasts‐derived migrasomes could be taken up by the recipient cells and regulate their behaviour. (a) Flow cytometry overlay histogram depicting the purity of isolated fibroblasts. (b) HaCaT cells were transfected with GFP, and fibroblasts were transfected with TSPAN4‐mCherry, followed by culturing for 12 h and observation by using the High Content Screening System. (c) Live‐cell images showing HaCaT‐GFP cells taking up migrasomes from TSPAN4‐mCherry‐fibroblasts. HaCaT‐GFP cells were mixed with TSPAN4‐mCherry‐fibroblasts and co‐cultured for 12 h, followed by time‐lapse images with the High Content Screening System. The images were captured every 10 min for 24 h. Enlarged regions of migrasomes (i, ii, iii, and iv) from the left images are shown on the right. (d) HaCaT cells and fibroblasts were stained with 1 µg/mL of WGA‐Alexa 555 and observed under confocal microscopy. (e) Migrasome number per cell from panel (d) was averaged from three independent experiments. Data are presented as mean ± SEM; p < 0.001 by unpaired t‐test. Migrasomes were defined as spherical vesicles (∼0.5–3 µm) located at retraction fibre junctions or termini. Quantification was performed manually by two blinded observers, and the average count was used. (f) Spheroids derived from fibroblasts. (g) Spheroids derived from fibroblasts were observed under a high‐content screening system. (h) Migrating fibroblasts were observed under the high‐content screening system.
FIGURE 3
FIGURE 3
Identification and effect of fibroblast‐derived migrasomes. (a) Migrasomes (black boxes) released by fibroblasts. Panels (i, ii) displayed higher magnifications of migrasomes in the black‐boxed areas. (b) Representative TEM images of migrasomes and exosomes. (c) Western blotting of migrasome‐enriched proteins (ITGαV, EOGT, PIGK, TSPAN4), endoplasmic reticulum marker (CALNEXIN), and small EV marker (ALIX) in cell bodies, migrasomes, and exosomes from fibroblasts. Representative images are shown. (d) Proliferation ability of HaCaT cells and fibroblasts treated with purified migrasomes (2 µg) assessed by using a CCK‐8 assay after 4 h. The absorbance was measured at 450 nm, normalized against controls. Statistical significance was determined by t‐test, *** p < 0.001. Error bars represent the mean ± SEM. (e) The migration ability of HaCaT cells and fibroblasts treated with PBS (Control) or migrasomes (Migrasome) (10 µg) assessed by transwell assay. (f) Quantitative analysis of migrated cells in panel (e). Ten fields were randomly selected from two replicates and counted. Statistical significance was determined by t‐test, ** p < 0.01. Error bars indicate the mean ± SEM. (g) Live‐cell images showing HaCaT‐GFP cells taking up migrasomes stained by WGA. HaCaT‐GFP cells were mixed with purified migrasomes and monitored immediately by time‐lapse images with high content.
FIGURE 4
FIGURE 4
The effect of fibroblast‐derived migrasomes on full‐thickness cutaneous wound rat models. (a) Schematic diagram illustrating the procedures of skin tissue harvesting at the edge of the wound. (b) TEM analysis of rat skin harvesting at different time points. Enlarged regions of migrasomes from the left images are shown on the right. (c) Schematic diagram illustrating the animal experimental procedures. (d) HaCaT cell viability with different concentrations of migrasome at different time points. n = 3. One‐way ANOVA. Data are presented as mean values ± SEM. (e) Images depicting changes in the wound area of rats across the control, PBS, and migrasome groups on Days 0, 3, 6, 10, and 15. (f) Representative trace plots showing the progression of wound closure. (g) Quantitative analysis of the wound closure rates. n = 3. Two‐way ANOVA. Data presented as the mean values ± SEM (*control vs. migrasome, ** p < 0.01, *** p < 0.001; #PBS vs. migrasome, #p < 0.05, ##p < 0.01; ns, no significance) (h) Wound healing area rates of migrasome injected areas and migrasome uninjected areas of the migrasome group. Data are presented as mean values ± SEM (n = 3, with 4 injection sites analysed per animal). Statistical significance was determined through a t‐test (** p < 0.01). (i) Representative images of H&E of the tissue sections from the control, PBS, and migrasome groups. (j) Quantification analysis of the wound re‐epithelialization rate. n = 3. with five sections randomly selected from each group for quantification. One‐way ANOVA. Data are presented as mean values ± SEM. (*** p <0.001). (k) Quantification analysis of the granulation tissue thickness. n = 3. with five sections randomly selected from each group for quantification. One‐way ANOVA. Data are presented as mean values ± SEM. (* p < 0.05, *** p < 0.001).
FIGURE 5
FIGURE 5
Single‐cell RNA‐seq reveals cell heterogeneity of migrasome non‐injection and injection wound‐healing skin. a) Schematic diagram illustrating the process of cell isolation, processing, capture by droplet‐based device, sequencing, and downstream analysis of single‐cell RNA‐seq in the migrasome non‐injection (Ctrl) group and migrasome injection (Mig) group wound‐healing skin. (b) Unbiased clustering of 31747 cells revealed 19 cellular clusters distinguished by different colours. (c) Assignment of 10 cell types from the 19 cellular clusters. The general identity of each cell type is indicated. (d) Heatmap displaying DEGs. The top 10 genes and their relative expressions in all sequenced cells per cluster are shown. Selected genes for each cluster have been color‐coded, which is parallel to the colour in panel (c). (e) Feature plots displaying the expression distribution for selected cell type‐specific genes. The expression for each cell is colour‐coded and overlaid onto the U‐MAP plot. The cells with the highest expressions are indicated in red. (f) The proportion of cell types in migrasome non‐injection (Ctrl) and migrasome injection (Mig) samples. (g) Number of DEGs in each cell type available in Ctrl and Mig groups (two‐sided Wilcoxon rank sum test, |log2 fold change (FC)| > 0.25, and adjusted p value of < 0.05). Red bars indicate upregulated genes, and blue bars indicate downregulated genes in the Mig group.
FIGURE 6
FIGURE 6
Fibroblast heterogeneity in migrasomes injection and non‐injection wound‐healing skin. (a) U‐MAP plot illustrating 11 distinct subclusters (sC0 through sC10) of fibroblasts derived from clusters 4 and 17 (Figure 5b). Each subcluster has been colour‐coded and defined on the right. (b) Unsupervised hierarchical clustering depicting the relatedness of wound fibroblast subclusters. (c) Violin plots displaying the relative expressions of selected cluster‐specific genes across the identified fibroblast subclusters. The genes have been colour‐coded to match the clusters in panel (b). (d) GO enrichment analysis highlighting 7 selected terms enriched in differentially expressed genes (DEGs) among fibroblast subpopulations, sorted by q value. (e) KEGG analysis of DEGs in fibroblasts on comparing the Ctrl group and Mig groups. (f) Violin plots showing representative DEGs in fibroblasts on comparing the Ctrl group and Mig group. (g) Immunohistochemistry staining of PCNA in the tissue sections from the Ctrl and Mig groups, exhibiting proliferative activity. Right panels depict the magnifications of the left panels. (h) Quantification of PCNA expression in the Mig group compared with the Ctrl group by IHC analysis. Statistical significance was determined by t‐test, n = 3, *** p < 0.001. Error bars represent the mean ± SEM. (i) Immunofluorescence staining of ACTA2 (α‐SMA) in the tissue sections from the Ctrl and Mig groups. (j) Quantification analysis of immunofluorescence with ACTA2 of wound samples. Statistical significance was determined by t‐test, n = 5, *** p < 0.001. Error bars represent the mean ± SEM.
FIGURE 7
FIGURE 7
Potential ligand‐receptor interaction in fibroblast subpopulation. (a) Heatmap illustrating the relative expressions of inter‐population communications with each other in all samples. (b), (c) Visualization of the ligand‐receptor interactions between any two cell types across all samples. The outer circle of the Circos diagram shows the cell type, while the inner circle shows the details of each interacting ligand‐receptor pair. Arrows indicate receptors, with the arrow size reflecting the ligand expressions on a logarithmic scale. (d) Heatmap displaying intersection genes between DEGs identified in Fib and genes of Fib in ligand‐receptor pairs. (e) Western blotting of VEGFA and IL‐6 expressions in the Ctrl and Mig group. The experiments were repeated thrice using fibroblasts from different donors; a representative result is shown. (f) Quantification of Col1a1 expression in Mig groups compared with the Ctrl group by western blot analysis. Expression level was normalized against Ctrl group. Statistical significance was determined by t‐test, n = 3, ** p < 0.01. Error bars represent the mean ± SEM. (g) Quantification of Vegfa expression in Mig group compared with Ctrl group by western blot analysis. Expression level was normalized against Ctrl group. Statistical significance was determined by t‐test, n = 3, * p < 0.05. Error bars represent the mean ± SEM. (h) Quantification of Il‐6 expression in Mig group compared with Ctrl group by western blot analysis. Expression level was normalized against Ctrl group. Statistical significance was determined by t‐test, n = 3, * p < 0.05. Error bars represent the mean ± SEM. (i) Immunohistochemistry staining of CXCL12 in the Ctrl and Mig groups. Lower panels depict the magnifications of the upper panels. (j) Quantification of CXCL12 expression in Mig group compared with Ctrl group by IHC analysis. Statistical significance was determined by t‐test, n = 3, *** p < 0.001. Error bars represent the mean ± SEM. (k) Immunohistochemistry staining of IL‐6 in the Ctrl and Mig groups. Lower panels depict the magnifications of the upper panels. (l) Quantification of IL‐6 expression in Mig group compared with Ctrl group by IHC analysis. Statistical significance was determined by t‐test, n = 3, * p < 0.05. Error bars represent the mean ± SEM. (m) Violin plots illustrating the expressions of differentially expressed TFs in Fib between the Ctrl group and Mig groups.
FIGURE 8
FIGURE 8
Migrasome‐mediated delivery of CXCL12 regulates wound healing. (a) Fibroblast was stained with DAPI, WGA and CXCL12 antibody and then visualized. Scale bar, 20 µm. ROI (region of interest). (b) Western blot analysis showing CXCL12 knockdown efficiency in fibroblasts transduced with three different shRNA sequences. Band intensities were quantified using ImageJ. (c) Western blot analysis of CXCL12 expression in migrasomes isolated from shNC‐ and shCXCL12‐transduced fibroblasts (shNC‐Mig and shCXCL12‐Mig). Band intensities were quantified using ImageJ. (d) Representative EdU staining images of fibroblasts treated with Ctrl, shNC‐Mig (10 µg/mL), or shCXCL12‐Mig (10 µg/mL). (e) Quantification of EdU‐positive cells. Statistical significance was determined by one‐way ANOVA. n = 3. ** p < 0.01, *** p < 0.001. Data are presented as mean values ± SEM. f) Representative images from scratch wound assays at 0, 12, and 24 h post‐scratch in fibroblasts treated with Ctrl, shNC‐Mig (10 µg/mL), or shCXCL12‐Mig (10 µg/mL). (g), (h) Quantification of wound closure rate at 12 h (g) and 24 h (h). Statistical significance was determined by One‐way ANOVA. n = 3. * p < 0.05, ** p < 0.01, *** p < 0.001. Data are presented as mean values ±SEM. (i) Representative tube formation images of HUVECs cultured with Ctrl, shNC‐Mig (10 µg/mL), or shCXCL12‐Mig (10 µg/mL). (j)–(l) Quantitative analysis of the number of nodes (j), number of junctions (k), and number of segments (l). Statistical significance was determined by one‐way ANOVA. n = 3. * p < 0.05, ** p < 0.01, *** p < 0.001. Data are presented as mean values ± SEM. (m) Western blot analysis comparing CXCL12 levels between migrasomes and exosomes. Band intensities were quantified using ImageJ.

Similar articles

References

    1. Amiri, N. , Golin A. P., Jalili R. B., and Ghahary A.. 2022. “Roles of Cutaneous Cell‐Cell Communication in Wound Healing Outcome: An Emphasis on Keratinocyte‐Fibroblast Crosstalk.” Experimental Dermatology 31: 475–484. 10.1111/exd.14516. - DOI - PubMed
    1. Amjadian, S. , Moradi S., and Mohammadi P.. 2022. “The Emerging Therapeutic Targets for Scar Management: Genetic and Epigenetic Landscapes.” Skin Pharmacology and Physiology 35: 247–265. 10.1159/000524990. - DOI - PMC - PubMed
    1. Biton, M. , Haber A. L., Rogel N., et al. 2018. “T Helper Cell Cytokines Modulate Intestinal Stem Cell Renewal and Differentiation.” Cell 175: 1307–1320.e22. 10.1016/j.cell.2018.10.008. - DOI - PMC - PubMed
    1. Butler, A. , Hoffman P., Smibert P., Papalexi E., and Satija R.. 2018. “Integrating Single‐Cell Transcriptomic Data Across Different Conditions, Technologies, and Species.” Nature Biotechnology 36: 411–420. 10.1038/nbt.4096. - DOI - PMC - PubMed
    1. Chen, L. , Ma L., and Yu L.. 2019. “WGA Is a Probe for Migrasomes.” Cell Discovery 5: 13. 10.1038/s41421-018-0078-2. - DOI - PMC - PubMed

Substances

LinkOut - more resources