Observational Study
. 2025 Jun 13;104(24):e42872.
doi: 10.1097/MD.0000000000042872.

Total cholesterol/high-density lipoprotein cholesterol-related indices as predictors of obstructive sleep apnea and cardiovascular mortality: A cross-sectional study

Affiliations
Observational Study

Total cholesterol/high-density lipoprotein cholesterol-related indices as predictors of obstructive sleep apnea and cardiovascular mortality: A cross-sectional study

Yang Gu et al. Medicine (Baltimore). .

Abstract

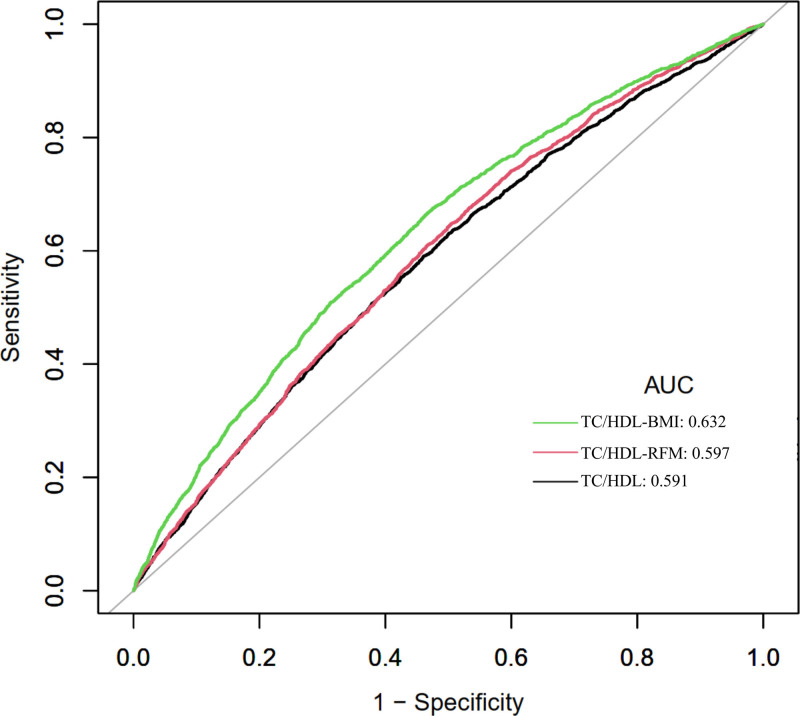
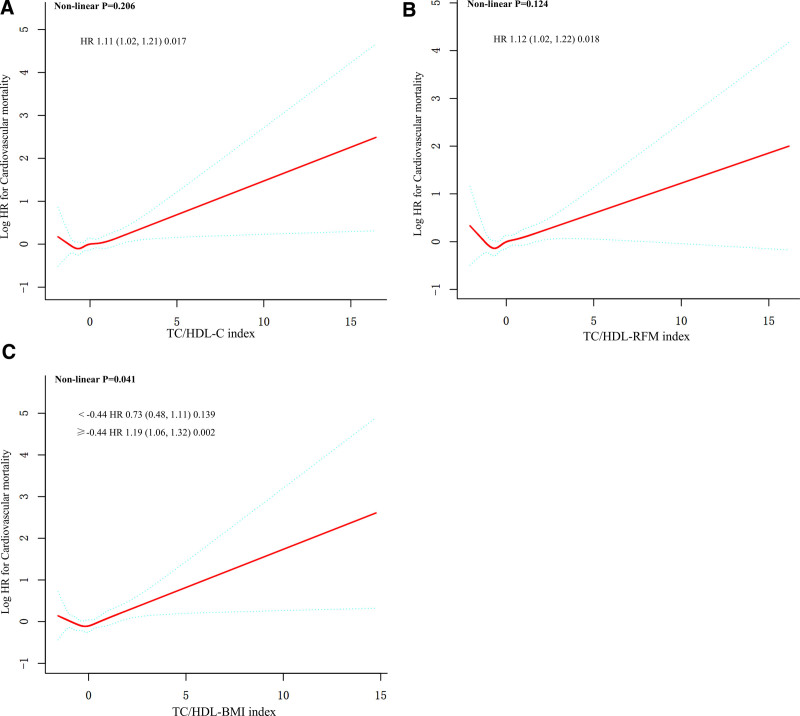
The relationship between the total cholesterol/high-density lipoprotein cholesterol (TC/HDL) and TC/HDL with the combination of obesity indicators and obstructive sleep apnea (OSA) remains unclear. Therefore, we aimed to explore the associations between TC/HDL-related indices and OSA as well as clinical outcomes. This study enrolled 20,076 patients from the National Health and Nutrition Examination Survey (2005-2008 and 2015-2018). Three indicators were constructed including TC/HDL index, TC/HDL combining with relative fat mass (TC/HDL-RFM), and TC/HDL combining with body mass index (TC/HDL-BMI). We performed multivariable logistic regression and generalized additive models to evaluate the association between TC/HDL-related indices and OSA. Multivariable Cox proportional hazards regression models with restricted cubic splines were performed to assess the relationships between TC/HDL-related indices and mortality. Stratified analyses were conducted to further investigate population-specific differences. The multivariable logistic regression analyses showed that high levels of TC/HDL-related indices were significantly associated with increased prevalences of OSA (TC/HDL: odds ratio [OR] per 1 standard deviation [SD] increase: 1.1, 95% confidence interval [CI]: 1.07-1.14, P < .001; TC/HDL-RFM: OR per 1SD increase: 1.22, 95% CI: 1.18-1.27, P < .001; TC/HDL-BMI: OR per 1SD increase: 1.28, 95% CI: 1.23-1.33, P < .001). Inverted U-shaped curves were depicted between TC/HDL-related indices and OSA. During a mean follow-up of 91 months, 1917 (9.5%) all-cause deaths occurred, and 567 (2.8%) were contributed to cardiovascular deaths. Meanwhile, the TC/HDL-related indices were associated with cardiovascular mortality, but not with all-cause mortality. Subgroup analyses showed that the strength of this relationship was found to be more pronounced in participants with OSA. The TC/HDL-related indices were independent predictors of OSA and cardiovascular mortality. Our study indicated that TC/HDL-related indices can assist clinicians in making more informed clinical decisions for patients with OSA and help reduce the risk of cardiovascular mortality.

Keywords: TC/HDL; TC/HDL-BMI; TC/HDL-RFM; cardiovascular mortality; obstructive sleep apnea.


Conflict of interest statement

The authors have no conflicts of interest to disclose.

Figures

Figure 1.
Figure 1.
Flow chart of study participants.
Figure 2.
Figure 2.
Plots of estimated smoothing spline functions with 95% confidence band of the association between OSA and TC/HDL ((A) TC/HDL-RFM (B), and TC/HDL-BMI (C) in all participants. The red line and dashed line represent the estimated values and their corresponding 95% confidence interval. Analyses were adjusted for age, gender, race, PIR, BMI, education, daily alcohol consumption, physical activity status, smoking status, diabetes, hypertension, CAD, stroke, NAFLD, hemoglobin, ALT, BUN, SUA, use of lipid-lowering agents and glucose-lowering drugs. Two-piecewise linear models were used to estimate the risk inflection point, and effect sizes for per 1SD increase in TC/HDL-related indices before and after the inflection point were shown separately. ALT = alanine aminotransferase, BMI = body mass index, BUN = blood urea nitrogen, CAD = coronary atherosclerotic heart disease, HDL = high-density lipoprotein cholesterol, NAFLD = nonalcoholic fatty liver disease, OR = odds ratio, OSA = obstructive sleep apnea, PIR = poverty–income ratio, RFM = relative fat mass, TC = total cholesterol, SUA = serum uric acid.
Figure 3.
Figure 3.
Subgroup and interaction analyses of OSA and TC/HDL (A), TC/HDL-RFM (B), and TC/HDL-BMI (C) in all participants. Analyses were adjusted for age, gender, race, PIR, BMI, education, daily alcohol consumption, physical activity status, smoking status, diabetes, hypertension, CAD, stroke, NAFLD, hemoglobin, ALT, BUN, SUA, use of lipid-lowering agents and glucose-lowering drugs. Effect estimates are expressed per 1SD increase. The strata variable was not included when stratifying by itself. CI, confidence intervals. ALT = alanine aminotransferase, BMI = body mass index, BUN = blood urea nitrogen, CAD = coronary atherosclerotic heart disease, HDL = high-density lipoprotein cholesterol, NAFLD = nonalcoholic fatty liver disease, OR = odds ratio, OSA = obstructive sleep apnea, PIR = poverty–income ratio, RFM = relative fat mass, TC = total cholesterol, SUA = serum uric acid.
Figure 4.
Figure 4.
Receiver operating characteristic curve between OSA and TC/HDL, TC/HDL-RFM, and TC/HDL-BMI in all participants. AUC = area under the curve, BMI = body mass index, HDL = high-density lipoprotein cholesterol, OSA = obstructive sleep apnea, RFM = relative fat mass, TC = total cholesterol.
Figure 5.
Figure 5.
Associations between TC/HDL, TC/HDL-RFM, and TC/HDL-BMI and all-cause and cardiovascular mortality in all participants. Analyses were adjusted for age, gender, race, PIR, BMI, education, daily alcohol consumption, physical activity status, smoking status, diabetes, hypertension, CAD, stroke, NAFLD, hemoglobin, ALT, BUN, SUA, use of lipid-lowering agents and glucose-lowering drugs. Effect estimates are expressed per 1SD increase. AUC = area under the curve, BMI = body mass index, BUN = blood urea nitrogen, CAD = coronary atherosclerotic heart disease, CI = confidence intervals, HDL = high-density lipoprotein cholesterol, HR = hazard ratio, NAFLD = nonalcoholic fatty liver disease, OR = odds ratio, OSA = obstructive sleep apnea, PIR = poverty–income ratio, RFM = relative fat mass, TC = total cholesterol, SUA = serum uric acid.
Figure 6.
Figure 6.
Restricted cubic spline curves for the associations of cardiovascular mortality with TC/HDL (A), TC/HDL-RFM (B), and TC/HDL-BMI (C) in all participants. The red line and dashed line represent the estimated values and their corresponding 95% confidence interval. Analyses were adjusted for age, gender, race, PIR, BMI, education, daily alcohol consumption, physical activity status, smoking status, diabetes, hypertension, CAD, stroke, NAFLD, hemoglobin, ALT, BUN, SUA, use of lipid-lowering agents and glucose-lowering drugs. Two-piecewise linear models were used to estimate the risk inflection point, and effect sizes for per 1SD increase in TC/HDL-related indices before and after the inflection point were shown separately. AUC = area under the curve, BMI = body mass index, BUN = blood urea nitrogen, CAD = coronary atherosclerotic heart disease, CI = confidence intervals, HDL = high-density lipoprotein cholesterol, HR = hazard ratio, NAFLD = nonalcoholic fatty liver disease, OR = odds ratio, OSA = obstructive sleep apnea, PIR = poverty–income ratio, RFM = relative fat mass, TC = total cholesterol, SUA = serum uric acid.
Figure 7.
Figure 7.
Subgroup and interaction analyses of cardiovascular mortality and TC/HDL (A), TC/HDL-RFM (B), and TC/HDL-BMI (C) in all participants. Analyses were adjusted for age, gender, race, PIR, BMI, education, daily alcohol consumption, physical activity status, smoking status, diabetes, hypertension, CAD, stroke, NAFLD, hemoglobin, ALT, BUN, SUA, use of lipid-lowering agents and glucose-lowering drugs. Effect estimates are expressed per 1SD increase. The strata variable was not included when stratifying by itself. AUC = area under the curve, BMI = body mass index, BUN = blood urea nitrogen, CAD = coronary atherosclerotic heart disease, CI = confidence intervals, HDL = high-density lipoprotein cholesterol, HR = hazard ratio, NAFLD = nonalcoholic fatty liver disease, OR = odds ratio, OSA = obstructive sleep apnea, PIR = poverty–income ratio, RFM = relative fat mass, TC = total cholesterol, SUA = serum uric acid.

Similar articles

References

    1. Seetho IW, Parker RJ, Craig S, Duffy N, Hardy KJ, Wilding JPH. Obstructive sleep apnea is associated with increased arterial stiffness in severe obesity. J Sleep Res. 2014;23:700–8. - PubMed
    1. Vavougios GD, George DG, Pastaka C, Zarogiannis SG, Gourgoulianis KI. Phenotypes of comorbidity in OSAS patients: combining categorical principal component analysis with cluster analysis. J Sleep Res. 2016;25:31–8. - PubMed
    1. Almendros I, Basoglu K, Conde SV, Liguori C, Saaresranta T. Metabolic dysfunction in OSA: is there something new under the sun? J Sleep Res. 2022;31:e13418. - PubMed
    1. Pan X, Zhang X, Wu X, et al. Association between non-high-density lipoprotein cholesterol to high-density lipoprotein cholesterol ratio and obstructive sleep apnea: a cross-sectional study from NHANES. Lipids Health Dis. 2024;23:209. - PMC - PubMed
    1. Kastelein JJ, van der Steeg WA, Holme I, et al. ; TNT Study Group. Lipids, apolipoproteins, and their ratios in relation to cardiovascular events with statin treatment. Circulation. 2008;117:3002–9. - PubMed

Publication types