. 2025 Jun 17;16(1):5310.
doi: 10.1038/s41467-025-60507-9.

Circulating cell-free DNA methylation patterns indicate cellular sources of allograft injury after liver transplant

Affiliations

Circulating cell-free DNA methylation patterns indicate cellular sources of allograft injury after liver transplant

Megan E McNamara et al. Nat Commun. .

Abstract

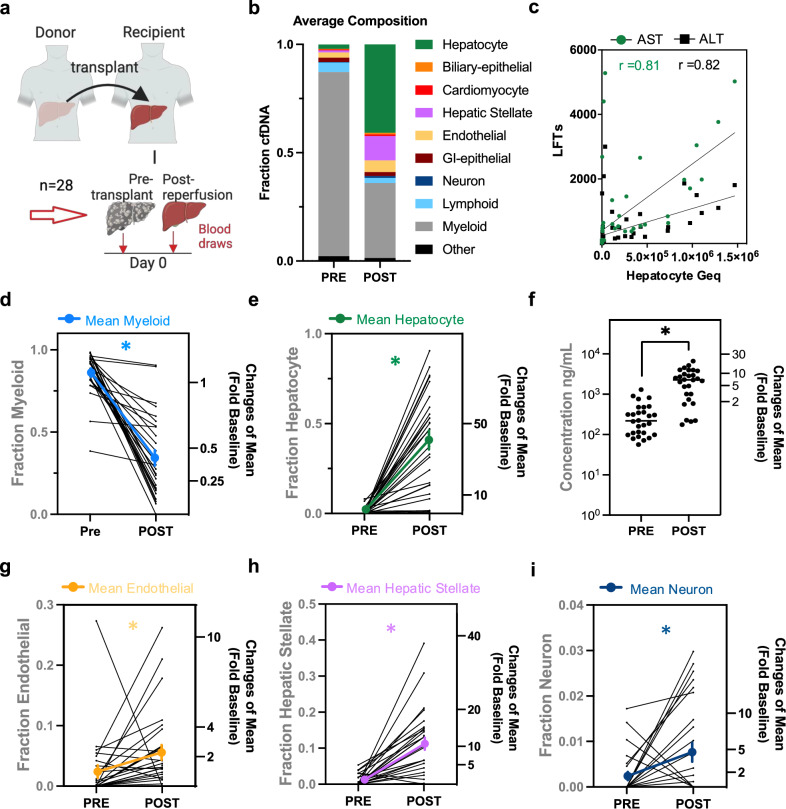
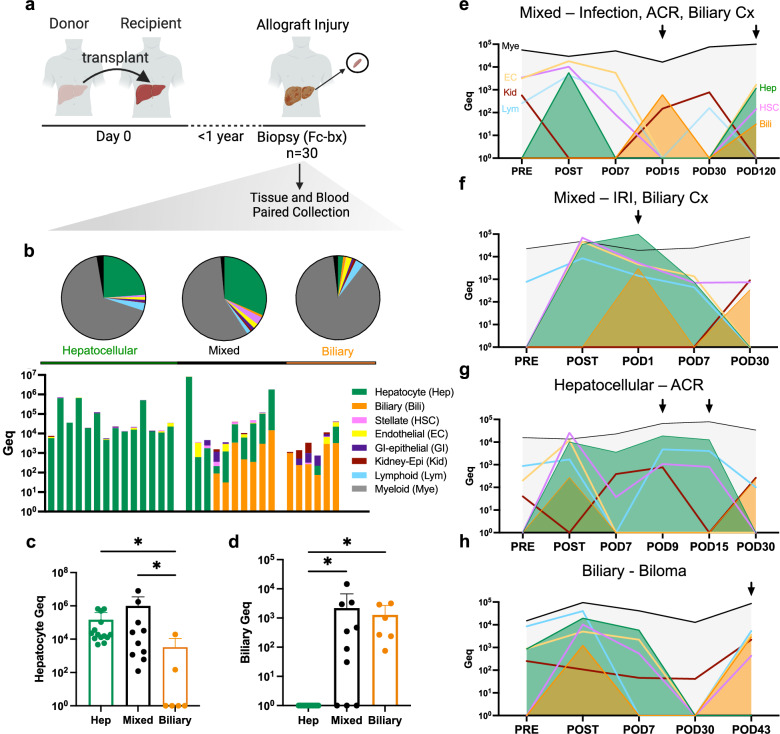
Post-transplant complications reduce allograft and recipient survival. Current approaches for detecting allograft injury non-invasively are limited and do not differentiate between cellular mechanisms. Here, we monitor cellular damages after liver transplants from cell-free DNA (cfDNA) fragments released from dying cells into the circulation. We analyzed 130 blood samples collected from 44 patients at different time points after transplant. Sequence-based methylation of cfDNA fragments were mapped to an atlas of cell-type-specific DNA methylation patterns derived from 476 methylomes of purified cells. For liver cell types, DNA methylation patterns and multi-omic data integration show distinct enrichment in open chromatin and functionally important regulatory regions. We find that multi-tissue cellular damages post-transplant recover in patients without allograft injury during the first post-operative week. However, sustained elevation of hepatocyte and biliary epithelial cfDNA within the first month indicates early-onset allograft injury. Further, cfDNA composition differentiates amongst causes of allograft injury indicating the potential for non-invasive monitoring and intervention.


Conflict of interest statement

Competing interests: A.W., A.K., and M.E.M. are named as inventors on pending patent applications (U.S. Patent Application No. 18/291,113 and U.S. Patent Application No. 63/714,126) filed by Georgetown University, which cover the detection of liver damage using the methods described in this manuscript. The remaining authors declare that the research was conducted in the absence of any commercial or financial relationships that could be construed as a potential conflict of interest. Ethics approval and consent to participate: All collaborators of this study have fulfilled the criteria for authorship required by Nature Portfolio journals and have been included as authors, as their participation was essential for the design and implementation of the study. Roles and responsibilities were agreed among collaborators ahead of the research. This work includes findings that are locally relevant, which have been determined in collaboration with local partners. This research was not severely restricted or prohibited in the setting of the researchers, and does not result in stigmatization, incrimination, discrimination or personal risk to participants.

Figures

Fig. 1
Fig. 1. Study overview using cell-free DNA methylation patterns in blood to monitor cellular damages after liver transplant.
a Cell-type-specific DNA methylation patterns were identified from reference data consisting of 476 methylomes of purified cells within healthy tissues. Methylation patterns were validated to show distinct enrichment in open chromatin and functionally important regulatory regions and then used to trace the origins of patient cfDNA fragments. b Serial serum samples were collected from 28 patients before and after liver transplant at predetermined time points (n = 100 samples) during the first month. We also collected serum samples from an additional 16 patients at the time of liver-biopsy proven allograft injury (n = 30 samples). Cell-free DNA (cfDNA) methylome profiling of serum samples was performed using hybridization capture-sequencing of bisulfite-treated cfDNA. c Cellular damages of the transplanted organ as well as other recipient organs were quantified to monitor organism-wide impact. Figure created in BioRender (2025) [https://BioRender.com/i51j954].
Fig. 2
Fig. 2. Liver cell-type DNA methylation atlas relative to other healthy tissues.
a Heatmap of differentially methylated, cell-type-specific blocks (DMBs) identified from reference WGBS data of healthy human cell-types. Each cell in the plot marks the methylation score of one genomic region (rows) at each of 20 cell-types (columns), with up to 50 blocks shown per cell type. The methylation score represents the number of fully unmethylated or methylated read-pairs divided by total coverage for hypo- and hyper-methylated blocks, respectively. b Heatmap highlighting the top 25 hepatocyte-specific DMBs. c Example of one hepatocyte-specific hypomethylated block (highlighted in blue), upstream of ECHS1 highly expressed in hepatocytes (green track). The alignment from the UCSC genome browser depicts the average DNA methylation (DNAm, purple tracks) across WGBS samples from five different liver cell-types as well as PBMC samples. Chromatin organization marks in hepatocytes are displayed (blue tracks) to show accessibility (DNAse I hypersensitivity, DHS) and regulatory function (H3K27ac binding). d Fragment-level visualization of methylation sequencing reads at hepatocyte-specific hypomethylated block in reference WGBS samples from five different liver cell-types.
Fig. 3
Fig. 3. Liver cell-specific hypomethylated DNA blocks coincide with other cell-specific epigenetic marks.
a, b Relationship of liver cell-type-specific hypomethylated blocks to chromatin accessibility and H3K27ac binding. Summary plots show the intensity of DHS/ATAC-seq or H3K27ac marks in a ±5-kb regions surrounding each hepatocyte-, biliary epithelial- or hepatic stellate-, liver endothelial-, and liver immune cell-specific hypomethylated block, respectively. Solid lines represent plot summary with standard error depicted by semi-transparent colored region. c Fraction of cell-type-specific hypomethylated blocks labeled as enhancers, associated with H3K4me1 mark, in chromHMM annotations for the same cell-types. d UCSC genome browser alignment at one example hepatocyte-specific hypomethylated block containing the FOXA1 binding sequence. Average methylation across WGBS samples shown in purple tracks. e Pioneer and developmental TF binding sites enriched within liver cell-type-specific hypomethylated blocks, from HOMER motif analysis using the findMotifsGenome.pl function. Shown are the binomial p-values (one-sided). Captured blocks without liver cell-type-specific methylation were used as background. Hepatocyte DHS, H3K27ac, and H3K4me1 data were obtained from the German Epigenome programme (DEEP). Hepatocyte FOXA1 Chip-seq data was obtained from the ENCODE project. Biliary epithelial ATAC-seq data and Hepatic stellate H3K27ac histone modification data were obtained from the ENCODE project. Source data are provided as a Source Data file.
Fig. 4
Fig. 4. Origins of cellular damage after liver transplant derived from methylation patterns of cfDNA fragments.
a Serial serum samples from 28 liver transplant patients collected pre-transplant and post-reperfusion on post-operative day 0 (POD0). b Average cellular origins of cfDNA estimates. c Correlation of AST and ALT enzyme activity with hepatocyte-derived cfDNA (Spearman r = 0.81 AST, r = 0.82 ALT, two-sided, p = 0.0021 AST, p = 0.004 ALT). Pre-transplant (PRE) and post-reperfusion (POST) fraction of cfDNAs from myeloid (d), hepatocyte (e), endothelial (g), hepatic stellate (h), and neuronal cells (i) of individual patients. The mean ± SEM of the cohort is shown in bold. Right axes: Fold change relative to pre-transplant. f Concentration of cfDNA isolated from patient serum. Individual patient and median values are shown. df Wilcoxon matched-pairs signed rank test was used for comparison amongst groups (two-sided, n = 28). NS p ≥ 0.05, *p < 0.05; myeloid p = 0.0001, hepatocyte p = 0.0001, endothelial p = 0.0025, hepatic stellate p = 0.0001, neuron p = 0.029, concentration p = 0.001. Source data are provided as a Source Data file. Figure 4a created in BioRender (2025) [https://BioRender.com/y41q857].
Fig. 5
Fig. 5. Time course of cell-type-specific damages after liver transplant.
a Serial serum samples from 20 liver transplant patients collected pre-transplant, post-reperfusion (POD0), post-operative day 7 and 30 (POD7, POD30). b Etiologies of allograft injury. By 1 year after transplant, 11 of 20 patients were diagnosed with different etiologies of allograft injury by for-cause biopsy. c Hepatocyte cfDNA time course in patients with allograft injury (right, n = 11 patients) or no allograft injury (left, n = 9 patients). Mean ± SEM of each cohort is shown in bold. d Average combined hepatocyte cfDNA on POD7 and POD30 for each individual, grouped by outcome (allograft injury = 11 patients, no allograft injury = 9 patients). Bar plot displaying group Mean + SD (Mann–Whitney test, two-sided, p = 0.006). e Biliary cfDNA time course in patients with allograft injury (right, n = 11 patients) or no allograft injury (left, n = 9 patients). Mean ± SEM of each cohort is shown in bold. f Average combined biliary cfDNA on POD7 and POD30, grouped by outcome (allograft injury = 11 patients, no allograft injury = 9 patients). Bar plot displaying group Mean + SD (Mann–Whitney test, two-sided, p = 0.009). g Time course of five liver cell type cfDNAs in patients with allograft injury (right, n = 11) or no allograft injury (left, n = 9). Mean ± SD of each cohort is shown. d, f NS p ≥ 0.05, *p < 0.05. Source data are provided as a Source Data file. Figure 5a created in BioRender (2025) [https://BioRender.com/l14b192].
Fig. 6
Fig. 6. Cell-free DNA methylation patterns indicate cellular sources of allograft injury.
a Serum samples collected at the time of for-cause liver biopsies (FC-bx) to diagnose allograft injury. All biopsies were taken within 1 year of liver transplant and samples are representative of 24 patients (n = 30 samples). b Cellular origins of cfDNAs classified by injury patterns observed in biopsies. Top, Average fractions of different cellular sources detected for each type of allograft injury. Bottom, Contingency stacked bar graph that depicts the proportion of solid-organ cellular Geq within each individual sample where each stack represents a different sample and the height of each segment within the stack represents the relative proportion of cfDNA within that cell-type group across samples. c Hepatocyte cfDNA in serum samples with hepatocellular or mixed hepatobiliary injury compared to biliary injury alone (Mann-Whitney test, two-sided, p = 0.003 Hep vs Biliary; p = 0.007 Mixed vs Biliary). Bar plot displaying group Mean + SD. d Biliary cfDNA in serum samples with biliary or mixed hepatobiliary injury compared to hepatocellular injury alone (Mann–Whitney test, two-sided p = 0.0001 Biliary vs Hep; p = 0.0003 Mixed vs Hep). Bar plot displaying group Mean + SD. bd Serum samples classified as n = 14 hepatocellular, n = 10 mixed hepatobiliary, and n = 6 biliary etiologies of allograft injury. eh Time courses of cellular damage during the peri-transplant time period in patients with hepatocellular, biliary, and mixed hepatobiliary forms of allograft injury. Timepoints corresponding to complications and liver-biopsy proven diagnoses are marked by an arrow. e Patient with COVID-19 infection at POD15 and FC-bx diagnosis of acute cellular rejection (ACR) with hyperbilirubinemia at POD120 (mixed injury classification). Elevated kidney epithelial cfDNA detected on POD0, POD15, and POD30 match with the hepato-renal syndrome (HRS) diagnosis pre-transplant and acute kidney injury (AKI) after transplant. f Patient with FC-bx diagnosis of hepatic ischemia with hyperbilirubinemia at POD1 (mixed injury classification). AKI was indicated by elevated creatinine levels POD9 and elevated kidney epithelial cfDNA on POD30. g Patient with FC-bx diagnosis of ACR at POD9 and POD15 (hepatocellular injury classification). AKI was indicated by elevated creatinine levels on POD8 and elevated kidney epithelial cfDNA POD7, POD9, and POD30. h Patient with diagnosis of biloma at POD43 (biliary injury classification). Source data are provided as a Source Data file. Figure 6a created in BioRender (2025) [https://BioRender.com/r21k256].

Update of

References

    1. Lucey, M. R., Furuya, K. N. & Foley, D. P. Liver transplantation. N. Engl. J. Med.389, 1888–1900 (2023). - PubMed
    1. Agostini, C. et al. Complications in post-liver transplant patients. J. Clin. Med.12, 6173 (2023). - PMC - PubMed
    1. Craig, E. V. & Heller, M. T. Complications of liver transplant. Abdom. Radio.46, 43–67 (2021). - PubMed
    1. Limaye, A.R., Dixon, L.R. & Firpi, R.J. Liver biopsy - indications, procedures, results, 10.5772/52617 (2012).
    1. Heitzer, E., Auinger, L. & Speicher, M. R. Cell-free DNA and apoptosis: how dead cells inform about the living. Trends Mol. Med.26, 519–528 (2020). - PubMed

Substances

LinkOut - more resources