. 2025 Jun 17;16(1):5326.
doi: 10.1038/s41467-025-60756-8.

Nuclear deformability increases PARPi sensitivity in BRCA1-deficient cells by increasing microtubule-dependent DNA break mobility

Affiliations

Nuclear deformability increases PARPi sensitivity in BRCA1-deficient cells by increasing microtubule-dependent DNA break mobility

Elena Faustini et al. Nat Commun. .

Abstract

Microtubules and nuclear transmembrane SUN1/2 proteins promote the mobility of DNA Double Strand Breaks (DSBs) induced by ionizing radiation and the misrepair of one-ended DSBs induced in BRCA1-deficient cells by Poly(ADP-ribose) polymerase inhibitors (PARPi). However, whether microtubules promote aberrant DSBs repair by altering the nuclear structure and whether the nuclear structure itself plays a role in these processes is still unclear. Here we show that microtubule-dependent DSBs mobility in BRCA1-deficient cells after PARPi treatment is associated with nuclear envelope (NE) invaginations. Furthermore, increasing NE invaginations by Lmna deletion or inhibition of sphingolipid synthesis increases DSBs mobility, chromosomal aberrations, and PARPi cytotoxicity in BRCA1-deficient cells. These findings reveal a functional connection between the NE and DSB repair and suggest that drugs increasing NE deformability will enhance PARPi therapy efficacy in BRCA1-deficient cancers.


Conflict of interest statement

Competing interests: The authors declare no competing interests.

Figures
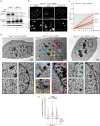
Fig. 1
Fig. 1. Microtubule-dependent nuclear deformations and DSBs mobility.
a Immunoblot for BRCA1, CHK2 and phospho-CHK2 (P-CHK2) in p53-deleted (sg-P53) Brca1F/F Mouse Embryonic Fibroblasts (MEFs) 72 h after transduction with Hit&Run Cre and/or 6 h treatment with PARPi (0.5 μM). Actin is shown as loading control. b Examples of 10 min traces of mCherry-BP1-2 foci in Brca1F/F MEFs 72 h after Brca1 deletion, 6 h after PARPi addition in the absence or presence of taxol (1 h) or nocodazole (2 h). Scale bars: 10 μm. c MSD of mCherry-BP1-2 foci in the indicated MEFs as described in (b), with SD. Total foci analyzed: 1618 for DMSO, 1056 for taxol, and 1085 for nocodazole from 35, 30, 28 nuclei, respectively from n = 3 independent experiment. d Representative image of Brca1F/F MEFs without any treatment or 72 h after Cre-mediated deletion of Brca1, PARPi treatment for 6 h treatment and/or incubation with taxol for 1 h. Highlighted boxes indicate nuclear deformations as vertical invaginations (blue), light (green) and deep (yellow) lateral invaginations, and longitudinal invaginations (magenta). In black and gray boxes, the control nuclear edges and nuclear interior with no invaginations, respectively. Scale bars: 2 μm. Magnification ×4.25. (e) Quantification of nuclear deformations as in (d) from 40, 20 and 22 cells for each condition derived from one representative experiment. Statistical analysis by Kruskal–Wallis test for multiple comparisons. (*) P < 0.05 (p = 0.0381); P ≧ 0.05 are not significant. Source data are provided as a Source Data file. See also Supplementary Fig. 1.
Fig. 2
Fig. 2. Lamin-A but not Lamin-B1 suppresses DSBs mobility in BRCA1-deficient cells treated with PARPi.
a Representative images of Immunofluorescence (IF) with anti- Lamin-A/C or Lamin-B1 antibodies of p53-deleted Brca1F/F MEFs. Cells were fixed before immunostaining. Arrowheads indicate nuclear invaginations. Scale bar: 10 μm. b Immunoblot for 53BP1, BRCA1 and Lamin-A (LMNA) in p53-deleted Brca1F/F Lmna+/+ or Brca1F/F Lmna−/− litter mates MEFs without any treatment or 72 h after Brca1 deletion with Hit&Run Cre, as indicated. Ponceau S staining is shown as loading control. Immunoblot for 53BP1 was processed in parallel using the same samples. c Immunoblot for 53BP1, BRCA1, Lamin-B1 (LMNB1) in p53-deleted Brca1F/F MEFs transduced with the empty vector control (vec) or two independent shRNAs against (mRNA) LmnB1 (B1) before and 72 h after Cre-mediated deletion of Brca1. Immunoblot for actin is shown as loading control. Immunoblots for 53BP1 and actin were processed in parallel using the same samples as the other two blots. d Representative IF images with anti-Lamin-B1 antibodies of Brca1F/F Lmna+/+ or Brca1F/F Lmna−/− MEFs, or with anti-Lamin-A antibodies of Brca1F/F MEFs transduced with vec or the shRNA against LmnB1 as in described in (b, c). Arrowheads indicate nuclear invaginations or blebs, respectively. e, f Quantification of normal nuclei and nuclei with blebs or invaginations/deformations in MEFs deleted of Lmna (e) or depleted of Lamin-B1 (f) as indicated and shown in (d) for n = 3 independent experiments with mean ± SEM. For each experiment, 50 cells were analyzed for condition. g Examples of 10 min traces of mCherry-BP1-2 foci in Brca1F/F Lmna+/+ or Brca1F/F Lmna−/− MEFs 72 h after Brca1 deletion, 6 h after PARPi addition in the absence or presence of taxol. Scale bar: 1 μm. h, i MSD of mCherry-BP1-2 foci in the indicated MEFs as described in (g), with SD. Total foci analyzed in (h): 1442 for Lmna+/+, 1487 for Lmna+/+ + taxol, 711 for Lmna−/− and 1374 for Lmna−/− + taxol from 42, 37, 21, 37 nuclei, respectively, from n = 3 independent experiments. Total foci analyzed in (i): 998 for vec, 1250 for shB1.1, 959 for shB1.2, from 30, 36, and 27 nuclei, respectively, from n = 3 independent experiments. Statistical analysis by two-way Anova for multiple comparison for (e, f). (****) p < 0.0001, P ≧ 0.05 is not significant. Source data are provided as a Source Data file. See also Supplementary Figs. 2 and 3.
Fig. 3
Fig. 3. Lamin A but not Lamin B1 suppresses aberrant repair in BRCA1-deficient cells treated with PARPi.
a Representative mis-rejoined chromosomes in Brca1F/F Lmna+/+ and Brca1F/F Lmna−/− 96 h after Brca1 deletion with Hit&Run Cre and PARPi treatment for 24 h. DNA is visualized with DAPI. Arrowheads indicate centromeres of chromosomes involved in mis-rejoining events. Scale bar: 10 μm. b, c Quantification of the percentage of mis-rejoined chromosomes per metaphases in Brca1F/F Lmna+/+ and Brca1F/F Lmna−/− (b) or Brca1F/F Lmna+/+ transduced with vec or two shRNAs against (mRNA) LmnB1 (B1) (c) as shown in (a). Each dot represents a metaphase. Bars represent the median for n = 3 independent experiments, with 10 metaphases each (30 metaphases in total). Statistical analysis by ordinary one-way ANOVA for multiple comparisons: (*) P < 0.05 (0.0167 and 0.0441, respectively); (****) P < 0.0001; P ≧ 0.05 is not significant. d Representative survival assay of Brca1F/F Lmna+/+ and Brca1F/F Lmna−/− MEFs treated with or without Hit&Run Cre and/or the indicated concentration of PARPi. Cells were treated with PARPi for 24 h before wash. e Quantification of survival to the indicated concentrations of PARPi in Brca1F/F Lmna+/+ and Brca1F/F Lmna−/− MEFs before or after Cre-mediated deletion of Brca1, as shown in (d). Colonies were stained with Methylene blue and their number in the different conditions was normalized over the number of colonies recovered in the untreated plates. Data represents the average and SEMs from n = 3 independent experiments. f Quantification of survival to the indicated concentrations of PARPi in Brca1F/F Lmna+/+ MEFs transduced with vec or depleted of Lamin-B1 before or after Cre-mediated deletion of Brca1. Data represents the average and SEMs from n = 3 independent experiments. Source data are provided as a Source Data file. See also Supplementary Figs. 2 and 3.
Fig. 4
Fig. 4. Sphingolipids affects DSBs mobility, DSB misrepair and survival after PARP inhibition in BRCA1-deficient MEFs.
a Immunoblot for BRCA1, LMNA/C and SPT1 in P53-deleted Brca1F/F MEFs transduced with the empty vector control (vec) or an shRNA against (mRNA) Spt1 (shSpt1) before or 72 h after Hit&Run Cre-mediated deletion of Brca1. b IF for Lamin-B1 of representative nuclei of Brca1F/F MEFs transduced with vec or shSpt1. c Quantification of nuclear deformations blebs or invagination/deformations as shown in (b). Data are from 150 nuclei from n = 3 independent experiments (50 cells/experiment) with mean ± SEM. Statistical analysis by 2way Anova for multiple comparison: (***) P < 0.001 (0.0005 for EV and 0.0003 for shSpt1); P ≧ 0.05 is not significant. d Representative 10 min traces of mCherry-BP1-2 foci in the MEFs transduced with the empty vector or shSpt1 72 h after Cre-mediated deletion of Brca1 and 6 h treatment with PARPi. e MSD of mCherry-BP1-2 foci as shown in (d) for n = 3 independent experiments, with SD (total foci analyzed: 763 from 24 nuclei for vec and 1201 foci from 32 nuclei for shSpt1). f Representative metaphases showing aberrant mis-rejoined chromosomes in MEFs with or without shSpt1. DNA is visualized with DAPI. Arrows show chromosomes in aberrant structures. g Quantification of mis-rejoined chromosomes as shown in (f). Each dot represents a metaphase. Bars shows the median for n = 3 independent experiment, with 10 metaphases each (total = 30 metaphases per condition). Statistical analysis by ordinary one-way ANOVA for multiple comparisons: (***) P < 0.001 (0.0002); (****) P < 0.0001; P ≧ 0.05 is not significant. h Representative survival assay of Brca1F/F MEFs transduced with vec or shSPT1, before or after Cre-mediated deletion of Brca1. PARPi was added for 24 h before wash. Colonies are stained with Methylene blue a week later. i Quantification of colony formation as shown in (h), normalized on MEFs growing without PARPi before Brca1 deletion. Data represents average and SEM for n = 3 independent experiments. All scale bars, 10 μm. Source data are provided as a Source Data file. See also Supplementary Fig. 4.
Fig. 5
Fig. 5. SPT chemical inhibition increases PARPi sensitivity of BRCA-1 deficient human cancer cell lines.
a IF for Lamin-A of representative nuclei of breast cancer HCC-1937 cell line cells treated with DMSO or myriocin for 24 h, with quantification of NE invaginations in one representative experiment. Scale bars, 10 μm. DMSO n = 63; myriocin n = 62. b, c Representative survival assay (b) and quantification (c) of HCC-1937 cells after exposure for 24 h to myriocin and/or 72 h exposure to PARPi at the indicated concentrations. After removal of the drugs, cells were let grow for a week before harvest. Cells were stained with methylene blue (b) or counted after trypsinization (c). Quantifications of growth is normalized over the growth without PARPi. Data represents average and SEM for n = 3 independent experiments. Representative survival assay (d) and quantification of uWB1.289 ovarian cancer cell line expressing exogenous BRCA1 (e) or the original BRCA1-deficient uWB1.289 cell line (f) after exposure for 24 h to the indicated concentrations of PARPi and myriocin as described in (b, c). Quantifications of growth is obtained independently for uWB1.289 + BRCA1 and uWB1.289. Data represents average and SEM for n = 5 independent experiments. g Proposed model of how nuclear deformability increases microtubule-dependent DSBs mobility and misrepair, enhancing the sensitivity of BRCA1-deficient cells to PARPi treatment. Source data are provided as a Source Data file. See also Supplementary Fig. 5.

References

    1. Farmer, H. et al. Targeting the DNA repair defect in BRCA mutant cells as a therapeutic strategy. Nature434, 917–921 (2005). - PubMed
    1. Pommier, Y., O’Connor, M. J. & de Bono, J. Laying a trap to kill cancer cells: PARP inhibitors and their mechanisms of action. Sci. Transl. Med.8, 362ps17 (2016). - PubMed
    1. Bouwman, P. et al. 53BP1 loss rescues BRCA1 deficiency and is associated with triple-negative and BRCA-mutated breast cancers. Nat. Struct. Mol. Biol.17, 688–695 (2010). - PMC - PubMed
    1. Bunting, S. F. et al. 53BP1 inhibits homologous recombination in Brca1-deficient cells by blocking resection of DNA breaks. Cell141, 243–254 (2010). - PMC - PubMed
    1. Zimmermann, M., Lottersberger, F., Buonomo, S. B., Sfeir, A. & de Lange, T. 53BP1 regulates DSB repair using Rif1 to control 5’ end resection. Science339, 700–704 (2013). - PMC - PubMed

MeSH terms