Clinical Trial
. 2025 Aug;7(8):1550-1569.
doi: 10.1038/s42255-025-01311-z. Epub 2025 Jun 17.

A nitroalkene derivative of salicylate, SANA, induces creatine-dependent thermogenesis and promotes weight loss

Karina Cal #  1   2   3 Alejandro Leyva #  4   5 Jorge Rodríguez-Duarte  1   4 Santiago Ruiz  1 Leonardo Santos  1   3 Maria Pia Garat  1   3 Lucía Colella  4   6 Mariana Ingold  3   4   6 Andrés Benitez-Rosendo  1   2   7 Valentina Pérez-Torrado  1   3 Cecilia Vilaseca  8 German Galliussi  4   9 Lucía Ziegler  10 Thais R Peclat  7   11   12 Mariana Bresque  1   3 Rachel M Handy  13 Rachel King  14 Larissa Menezes Dos Reis  15   16   17   18 João Manoel Alves  19 Camila Espasandín  1   20 Victoria de la Sovera  4   6 Peter Breining  21 Rosina Dapueto  1   4   22 Andrés Lopez  23 Katie L Thompson  7   11   12 Caroline A Lino  24 Julia V França  24 Thayna S Vieira  24 Ramandeep Rattan  25 Guillermo Agorrody  26 Evan DeVallance  27 Jacqueline Haag  3 Ethan Meadows  28 Sara E Lewis  27   28   29 Gabriele Catarine Santana Barbosa  30 Leonardo Osbourne Lai de Souza  30 Marina Santos Chichierchio  30 Valeria Valez  31   32   33 Adrián Aicardo  32   33   34 Paola Contreras  1   8 Mikkel H Vendelbo  21   35 Steen Jakobsen  35 Andrés Kamaid  4   5   36 Williams Porcal  4   6 Aldo Calliari  1   2 José Manuel Verdes  37 Jianhai Du  28   38 Yekai Wang  38 John M Hollander  28   39 Thomas A White  7 Rafael Radi  32   33 Guillermo Moyna  23 Celia Quijano  32   33 Robert O'Doherty  40   41 Pedro Moraes-Vieira  15   16   17   18 Shailendra Giri  42 Graham P Holloway  13 William T Festuccia  24 Luiz Osório Leiria  19 Roberta Leonardi  14   28 Marcelo A Mori  43   44   45   46 Juliana Camacho-Pereira  30 Eric E Kelley  27   28   29 Rosario Duran  5 Gloria V López  4   6 Eduardo N Chini  47   48   49   50 Carlos Batthyány  51 Carlos Escande  52
Affiliations
Clinical Trial

A nitroalkene derivative of salicylate, SANA, induces creatine-dependent thermogenesis and promotes weight loss

Karina Cal et al. Nat Metab. 2025 Aug.

Abstract

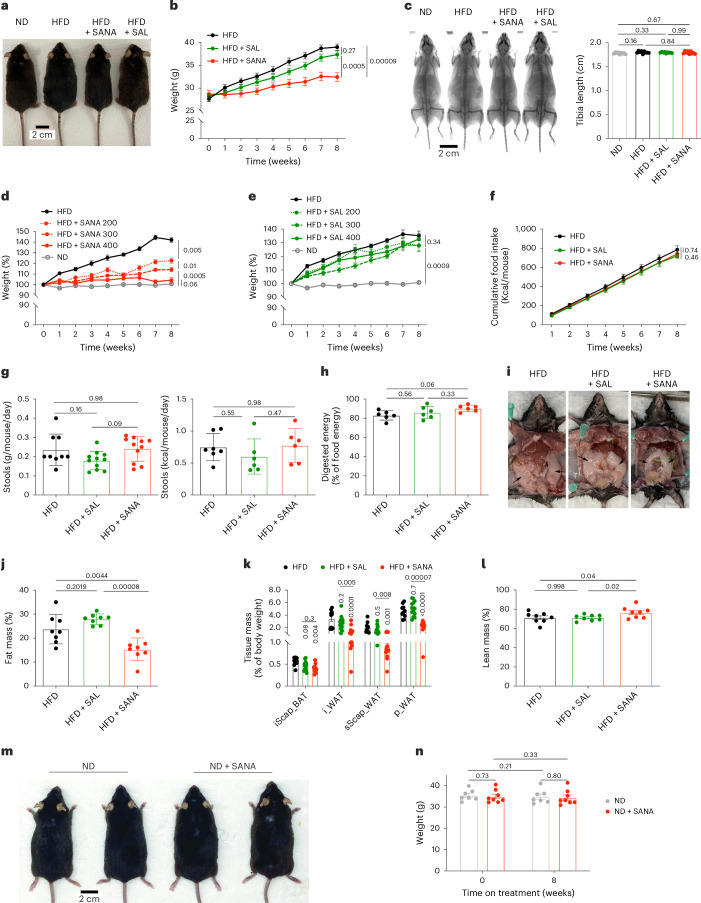
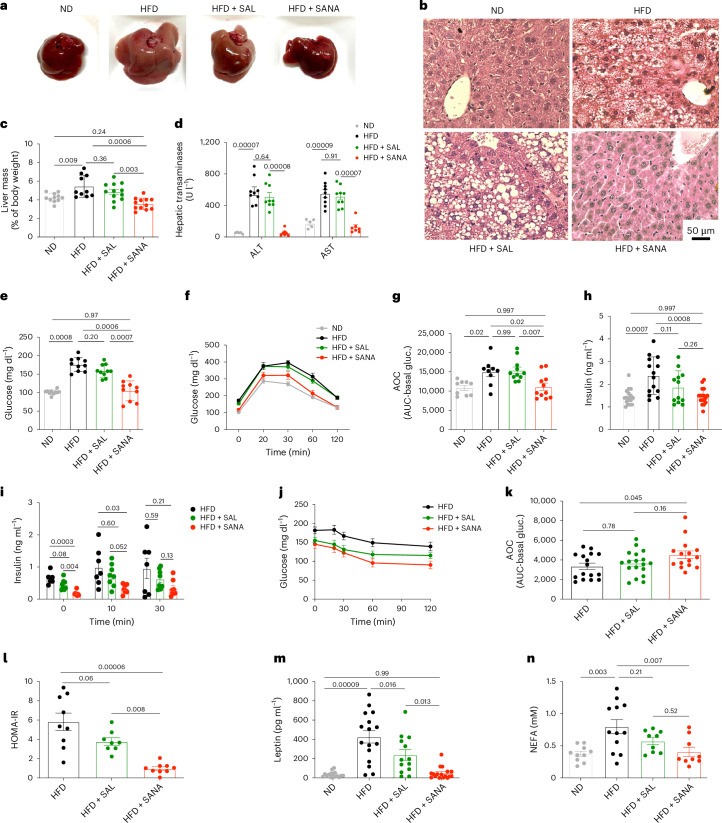
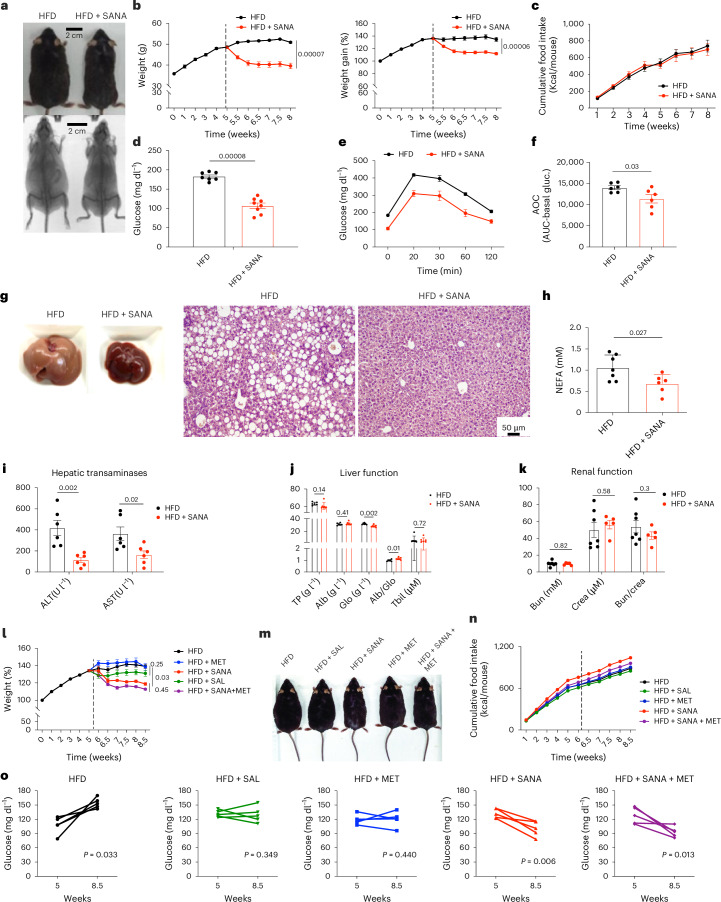
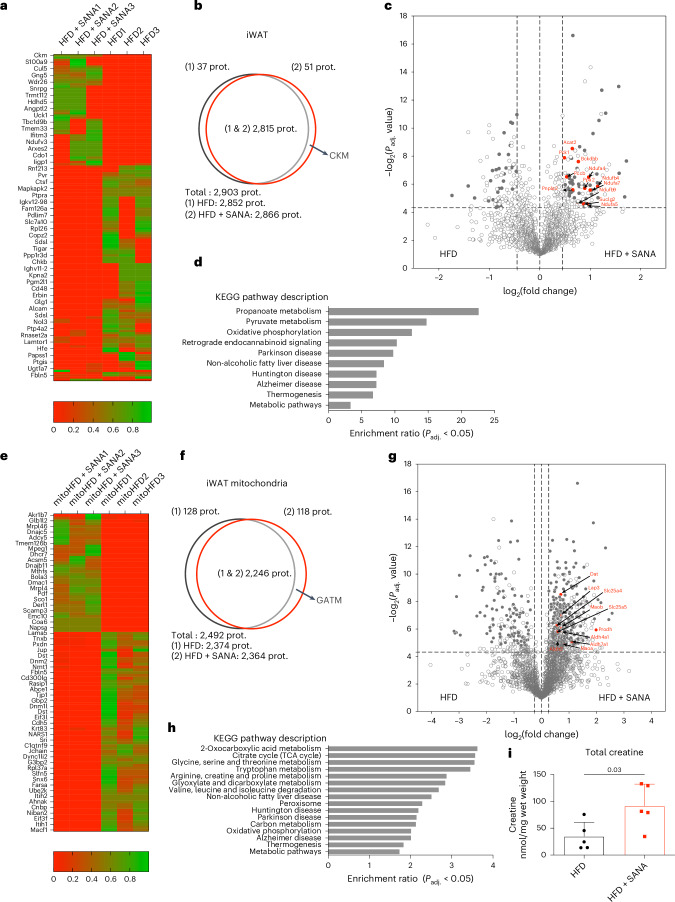
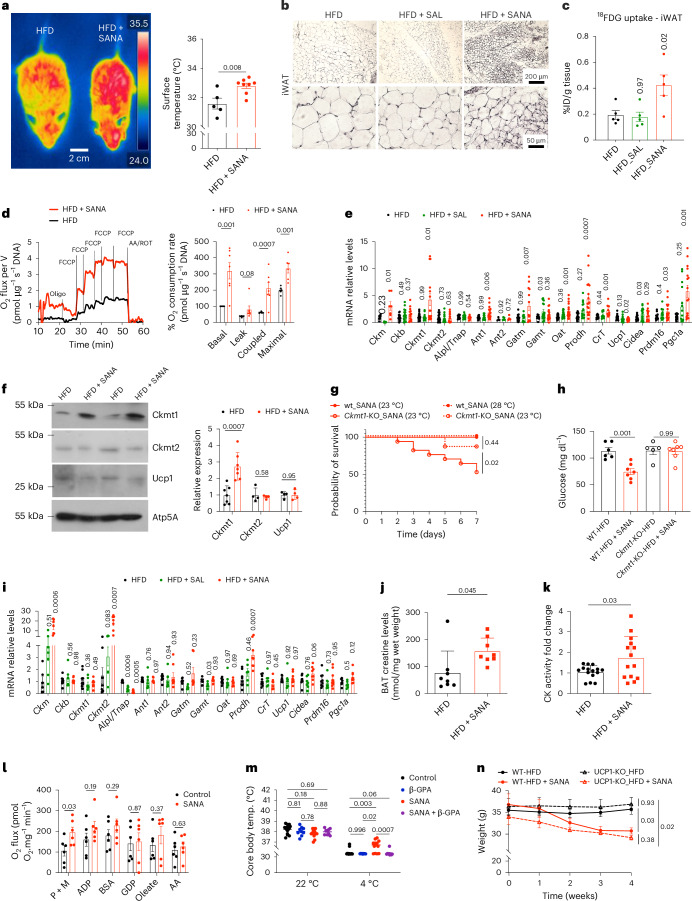
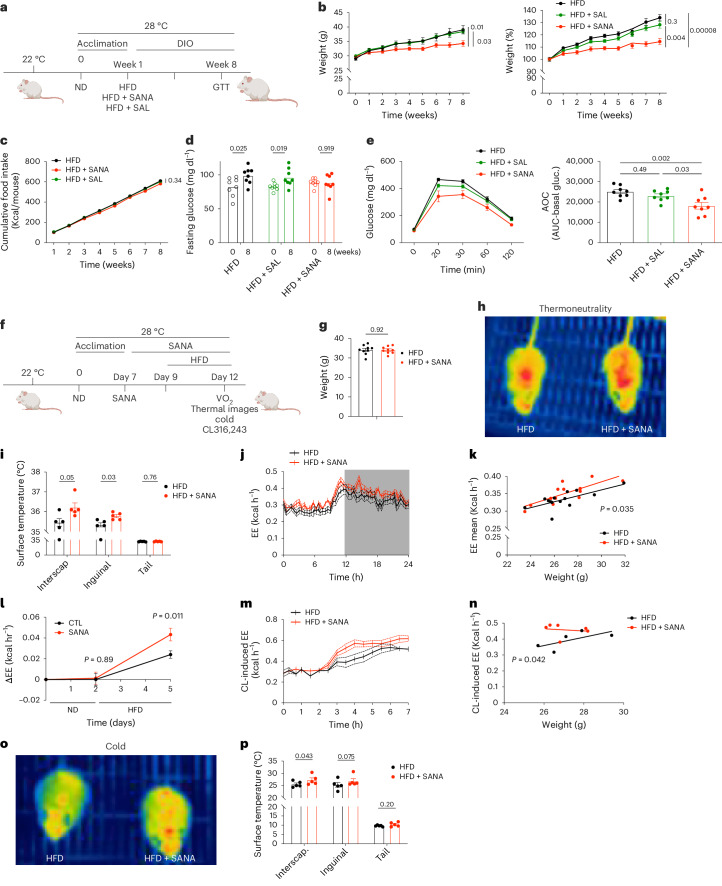
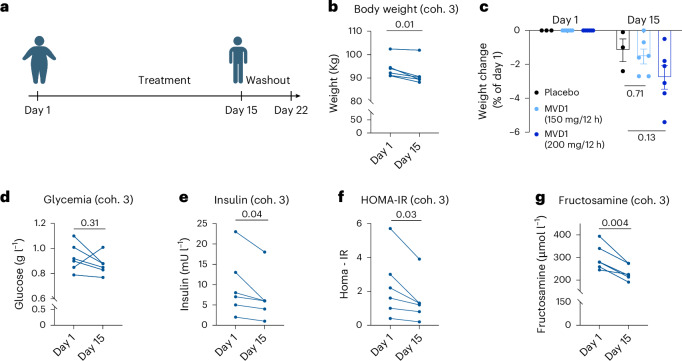
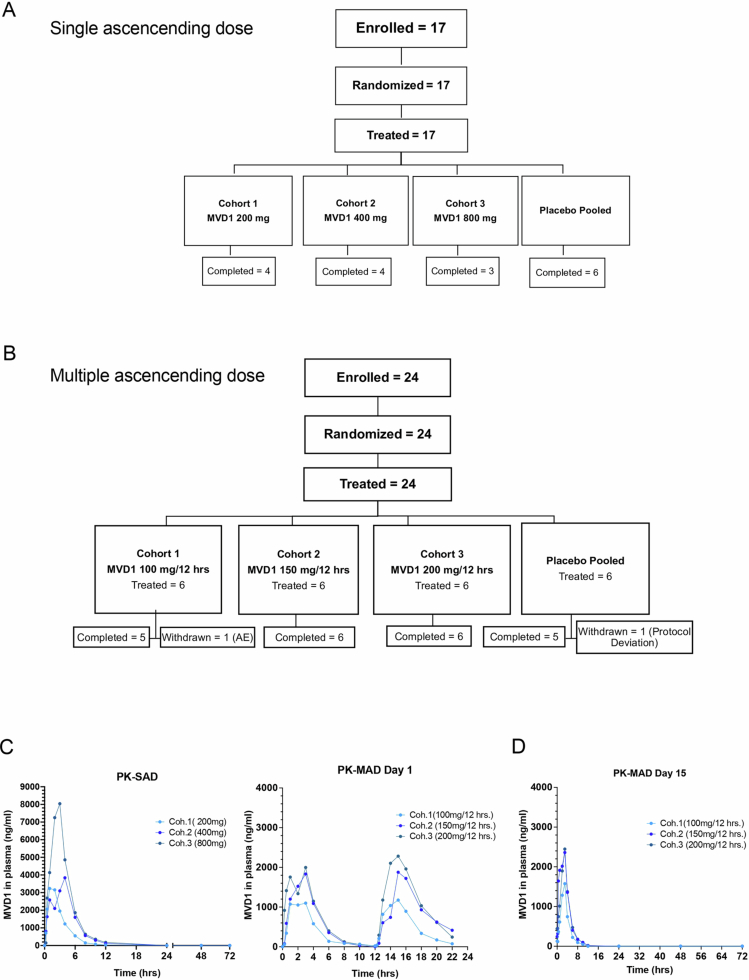
The emergence of glucagon-like peptide-1 agonists represents a notable advancement in the pharmacological treatment of obesity, yet complementary approaches are essential. Through phenotypic drug discovery, we developed promising nitroalkene-containing small molecules for obesity-related metabolic dysfunctions. Here, we present SANA, a nitroalkene derivative of salicylate, demonstrating notable efficacy in preclinical models of diet-induced obesity. SANA reduces liver steatosis and insulin resistance by enhancing mitochondrial respiration and increasing creatine-dependent energy expenditure in adipose tissue, functioning effectively in thermoneutral conditions and independently of uncoupling protein 1 and AMPK activity. Finally, we conducted a randomized, double-blind, placebo-controlled phase 1A/B clinical trial, which consisted of two parts, each with four arms: (A) single ascending doses (200-800 mg) in healthy lean volunteers; (B) multiple ascending doses (200-400 mg per day for 15 days) in healthy volunteers with overweight or obesity. The primary endpoint assessed safety and tolerability. Secondary and exploratory endpoints included pharmacokinetics, tolerability, body weight and metabolic markers. SANA shows good safety and tolerability, and demonstrates beneficial effects on body weight and glucose management within 2 weeks of treatment. Overall, SANA appears to be a first-in-class activator of creatine-dependent energy expenditure and thermogenesis, highlighting its potential as a therapeutic candidate for 'diabesity'. Australian New Zealand Clinical Trials Registry registration: ACTRN12622001519741 .


Conflict of interest statement

Competing interests: G.V.L., C.B., M.P.G. and C.E. hold shares in EOLO USA Inc. E.N.C. acts as a scientific advisor for EOLO USA Inc. K.C., M.P.G., V.P.-T., M.B., L.S., J.H. and M.I. are used by EOLO USA Inc. The remaining authors declare no competing interests.

Figures

Fig. 1
Fig. 1. SANA protects against DIO.
a, Mice fed HFD, HFD + salicylate (SAL) or HFD + SANA (400 mg per kg per day, mixed in HFD, p.o.) for 8 weeks. b, Weight gain. n: HFD = 30; HFD + SAL = 29; HFD + SANA = 30; pooled from three experiments. c, X-ray image (left) and tibia length (right). n = 9 per group. d,e, Weight gain under normal diet (ND), HFD or HFD + SANA (d) or HFD + SAL (e) at different doses administered p.o. n: HFD = 8; HFD + SANA 200 mg per kg per day = 6; HFD + SANA 300 mg per kg per day = 8; HFD + SANA 400 mg per kg per day = 10; ND = 8 in d, and HFD = 11; HFD + SAL 200 mg per kg per day = 5; HFD + SAL 300 mg per kg per day = 9; HFD + SAL 400 mg per kg per day = 10; ND = 8 in e. f, Cumulative food intake. n = 4 per group. g, Stool production (left) and caloric content (right) at week 8. n: HFD = 9; HFD + SAL = 11; HFD + SANA = 11 and HFD = 7; HFD + SAL = 6; HFD + SANA = 6, respectively. h, Digested energy calculated as the percentage of gross energy intake at week 8. n = 6 per group. i, Representative images; arrows indicate perigonadal fat. j, Total fat mass by EchoMRI. n = 8 per group. k, Fat depot quantification: interscapular brown (iScap_BAT), inguinal (i_WAT), subscapular (sScap_WAT) and perigonadal (p_WAT) adipose tissue. n: iScap_BAT: HFD = 10; HFD + SAL = 14; HFD + SANA = 11; i_WAT: HFD = 10; HFD + SAL = 14; HFD + SANA = 12; sScap_WAT: HFD = 10; HFD + SAL = 14; HFD + SANA = 12 and p_WAT: HFD = 10; HFD + SAL = 13; HFD + SANA = 10. l, Total lean mass by EchoMRI. n = 8 per group. m, Mice fed ND or ND + SANA (400 mg per kg per day, p.o.) for 8 weeks. n, Weight at start and end of treatment n: ND = 7; ND + SANA = 8. Data are the mean ± s.e.m. Statistical tests used were two-way analysis of variance (ANOVA) followed by Tukey’s multiple-comparisons test (b, d, e, f and n), repeated-measures one-way ANOVA (c) and one-way ANOVA (g, h, j, k and l). One-way ANOVA was followed by Bonferroni post hoc for multiple comparisons. Source data
Fig. 2
Fig. 2. SANA protects against glucose intolerance and liver steatosis in response to DIO.
ad, Liver’s macroscopic appearance (a); H&E staining (b); liver weight, n: ND = 11; HFD = 10; HFD + SAL = 12; HFD + SANA = 12 (c); and liver alanine transaminases (ALT) and aspartate aminotransferase (AST) in plasma/serum, n: ND = 5; HFD = 9; HFD + SAL = 9; HFD + SANA = 7 (d) in mice fed with ND, HFD, HFD + SAL or HFD + SANA (400 mg per kg per day, p.o.) for 8 weeks. eg, Fasting glucose (e) n = 10 per group; glucose tolerance test (GTT) (f), n: ND = 9; HFD = 10; HFD + SAL = 12; HFD + SANA = 11; and GTT area of the curve (AOC) (g), n: ND = 9; HFD = 9; HFD + SAL = 11; HFD + SANA = 11 at week 8. h, Fasting insulin. n: ND = 17; HFD = 14; HFD + SAL = 12; HFD + SANA = 17. i, Glucose-stimulated insulin secretion (GSIS) at week 8. n: HFD = 7; SAL, = 8; SANA = 8. j,k, Insulin tolerance test (ITT) (j) and ITT AOC (k) at week 8. n: HFD = 16; HFD + SAL = 18; HFD + SANA = 15 (l). Insulin resistance calculated by HOMA-IR. n: HFD = 9; HFD + SAL = 8; HFD + SANA = 9. m, Plasma leptin levels at week 8. n: ND = 16; HFD = 16; HFD + SAL = 13; HFD + SANA = 17. n, Plasma non-esterified fatty acid (NEFA) levels at week 8. n: ND = 10; HFD = 12; HFD + SAL = 9; HFD + SANA = 9. Data are the mean ± s.e.m. Statistical analyses used were one-way ANOVA followed by Bonferroni post hoc for multiple comparisons (ce, g, h, j and ln) and two-way ANOVA followed by Tukey’s multiple-comparisons test (k). Source data
Fig. 3
Fig. 3. Treatment of obese mice with SANA promotes weight loss and amelioration of glucose intolerance and liver damage.
Adult (6-month-old) mice treated with SANA (200 mg per kg per day, p.o.) after 5 weeks of a HFD. a, Representative photograph and X-ray image at treatment end. b, Weight gain and percentage of initial weight. n: HFD = 7; HFD + SANA = 8. c, Cumulative food intake during treatment. n = 2 per group. d, Fasting glucose at week 8. n: HFD = 7; HFD + SANA = 8. e,f, GTT at week 8. n: HFD = 6; HFD + SANA = 7 (e) and GTT AOC n = 6 per group (f). g, Liver macroscopic appearance and H&E staining. h, Plasma free fatty acid levels at week 8. n: HFD = 7; HFD + SANA = 6. ik, Liver ALT and AST plus liver and renal function markers (TP, total protein; ALB, albumin; GLO, total globulins; TBIL, total bilirubin; BUN, blood urea nitrogen) in plasma/serum at week 8. Hepatic transaminases: n = 6 per group; liver function: n: HFD = 6; HFD + SANA = 7; renal function: n: HFD = 7; HFD + SANA = 5. l,m, Percentage of initial weight and representative image of HFD-fed mice treated with SANA or SAL (200 mg per kg per day, p.o.) alone or combined with metformin (MET, 300 mg per kg per day, gavage). n: HFD = 5; HFD + MET = 5; HFD + SANA = 5; HFD + SAL = 4; HFD + SAN + MET = 5. n, Cumulative food intake. n = 2 per group. o, Evolution of fasting glucose. n = 5 per group. Data are the mean ± s.e.m. Statistical analyses used were two-way ANOVA followed by Tukey’s multiple-comparisons test (b, c and l), unpaired two-sided Student’s t-test (d, f and hk) and paired two-sided Student’s t-test (o). Source data
Fig. 4
Fig. 4. Proteomic analysis of whole tissue and isolated mitochondria from iWAT to SANA.
ad, Whole iWAT proteomics performed in mice fed with HFD or HFD + SANA (400 mg per kg per day, p.o.) for 8 weeks. n = 3 per group. a, Heat map displaying unique proteins per row (labels shown every third protein) across biological replicates. b, Venn diagram of proteins exclusively detected in each condition (P < 0.05), including CKM. c, Volcano plot of common proteins with differential abundance (Benjamini–Hochberg q < 0.05); each dot represents a protein detected in at least four of six replicates; darker dots are statistically differential, and red dots are mapped to the enriched biological processes in d. d, WebGestalt pathway over-representation analysis for proteins overexpressed in HFD + SANA versus HFD. eh, Same proteomic analysis conducted on isolated mitochondria from iWAT, highlighting mitochondrial Gatm. n = 3 per group; each sample is pooled from 2–3 mice. i, Total creatine levels in iWAT were measured by mass spectrometry. n = 5 per group. Data are the mean ± s.e.m. Statistical analyses used were Bayesian framework with a Poisson distribution to identify exclusively detected proteins (b and f), multiple unpaired two-sided Student’s t-tests (one per protein) for volcano plots (c and g) and an unpaired two-sided Student’s t-test (i). Source data
Fig. 5
Fig. 5. SANA stimulates mitochondrial respiration, a gene expression signature of creatine-dependent thermogenesis and a UCP1-independent loss of weight.
af,ik, Measurements at 8 weeks of treatment in mice fed with HFD, HFD + SANA or HFD + SAL at 400 mg per kg per day, p.o. a, Thermal images (left), with inguinal surface temperatures quantification (right). n: HFD = 5; HFD + SANA = 8. b, Representative H&E staining of iWAT. c, In vivo 18FDG uptake in iWAT. n = 5 per group. d, Oxygen consumption of adipocytes isolated from iWAT. n = 7 per group. e, Quantitative PCR with reverse transcription (RT–qPCR) analysis of thermogenic markers in iWAT. n: Supplementary Table 1. f, Western blot of iWAT-isolated mitochondria, n = 7 for CKMT1; n = 4 for CKMT2 and UCP1. g, Survival curves for WT and Ckmt1-KO mice treated with HFD + SANA (20 mg per kg per day, s.c.) at 23 °C or 28 °C. n: wt_SANA_23 °C = 6; Ckmt1-KO_SANA_23 °C = 17; wt_SANA_28 °C = 7; Ckmt1-KO_SANA_28 °C = 8. h, Fasting glucose in WT and Ckmt1-KO mice at 28 °C after HFD and SANA or vehicle treatment. n: WT-HFD = 6; WT-HFD + SANA = 7; Ckmt1-KO-HFD = 5; Ckmt1-KO-HFD + SANA = 7. i, RT–qPCR analysis of thermogenic markers in BAT, n: Supplementary Table 1. j, Total creatine levels in BAT measured by mass spectrometry. n = 8 per group. k, Creatine kinase activity in BAT-isolated mitochondria, n: HFD = 15; HFD + SANA = 14. l, Respiration analysis in BAT-isolated mitochondria. n = 6 per group. m, β-GPA treatment (0.4 mg per kg per day, i.p.) in SANA-treated mice for 5 days (20 mg per kg per day, s.c.) before a 3-h cold exposure. n: Control = 14; β-GPA = 9; SANA = 13; SANA + β-GPA = 9. n, Weight gain of UCP1-KO mice treated with SANA (20 mg per kg per day, s.c.) or vehicle daily for 4 weeks. Mice were maintained at thermoneutrality and fed with a HFD 15 weeks before treatment. n = 5 per group. Mitochondrial assays utilized oligomycin (oligo), FCCP (carbonyl cyanide-p-trifluoromethoxyphenylhydrazone), antimycin A (AA), rotenone (ROT), pyruvate (P), malate (M) and fatty acid-free BSA. Data are the mean ± s.e.m. Statistical analyses used were paired two-sided Student’s t-test (a), unpaired two-sided Student’s t-tests (d, f and jl), one-way ANOVA followed by Bonferroni post hoc for multiple comparisons (c, e and I), two-way ANOVA followed by Tukey’s multiple-comparisons test (h, m and n) and log-rank (Mantel–Cox) test (g). Vertical P values indicate multiple comparisons of each experimental condition versus the control condition (HFD in c, e and i). Source data
Fig. 6
Fig. 6. SANA stimulates energy expenditure and protects against obesity under thermoneutral conditions.
a, Diagram of long‐term treatment: Mice were fed HFD, HFD + SAL or HFD + SANA (20 mg per kg per day, s.c.) for 8 weeks. Created with BioRender.com. b, Weight gain and percentage of initial weight. n: HFD = 13; HFD + SAL = 10; HFD + SANA = 11. c, Cumulative food intake. n = 2 per group. d, Fasting glycaemia at weeks 0 and 8. n = 8 per group. e, GTT (left) and GTT AOC (right) at week 8. n = 8 per group. f, Diagram of acute treatment. Mice were given a HFD with or without SANA (20 mg per kg per day, s.c.) at 28 °C. Created with BioRender.com. g, Body weight. n = 9 per group. h, Representative thermal image of HFD and HFD + SANA mice at the end of the acute treatment. i, Quantification of surface temperature from thermal images. n = 5 per group. jl, Energy expenditure (EE) evaluations from the acute treatment. n: HFD = 14; HFD + SANA = 13; data were pooled from two independent experiments. j, EE measured over a 24-h period. k, Regression analysis of EE data from j. l, Individual changes in EE during the acute treatment. m,n, EE evaluations of CL316,243-treated mice at the end of the acute treatment. n: HFD = 5; HFD + SANA = 6 (m) EE measurement. n, Regression analysis of EE from m. o,p, Thermoneutral-to-cold (4 °C) challenge. Representative thermal image after 1 h at 4 °C (o). Surface temperature quantification from images (p). n = 5 per group. Data are the mean ± s.e.m. Statistical analyses used were one-way ANOVA followed by Bonferroni post hoc for multiple comparisons (e), two-way ANOVA followed by Tukey’s multiple-comparisons test (b and c), paired two-sided Student’s t-test (d, i and p), unpaired two-sided Student’s t-test (g and l) and ordinary least squares and ANCOVA for regression analyses (k and n). Source data
Fig. 7
Fig. 7. Study design and main metabolic parameters induced by SANA (under the name of MVD1 during clinical studies) in a randomized, double-blind, placebo-controlled study phase 1A/B, first-in-human clinical trial in healthy volunteers with overweight or obesity.
a, Clinical scheme of trial design for MAD. The complete design for SAD and MAD is described in Extended Data Fig. 8. Created with BioRender.com. b, Analysis of weight evolution in the MAD cohort 3 between day 1 and day 15. n = 6 per group. All remaining data for all cohorts can be found in Extended Data Table 1. c, Analysis of percentage of body weight loss between day 1 and day 15 in placebos and treated volunteers in MAD (cohort 2 and cohort 3). n: Placebo = 3; MVD1 150 mg/12 h = 6; MVD1 200 mg/12 h = 6). Data are presented as the mean ± s.e.m. dg, Analysis of plasma glucose (d), insulin levels (e), HOMA-IR test (f) and fructosamine levels (g), comparing day 1 and day 15 of MAD cohort 3 volunteers treated with MVD1 200 mg/12 h. n = 6. All remaining data for all cohorts can be found in Extended Data Table 1. Statistical analyses used were paired two-sided Student’s t-test (b and dg) and one-way ANOVA followed by Bonferroni post hoc for multiple comparisons (c). Source data
Extended Data Fig. 1
Extended Data Fig. 1. Physicochemical and biological characterization of the canonical nitroalkene effects of SANA.
(a) Synthesis (left) and electrophilic properties (right) of SANA. Spectra of SANA (10 μM) recorded every 60 s after incubation with β-Mercaptoethanol (BME, 100 μM) or reduced glutathione (GSH, 100 μM). (b) Left: cytotoxicity of SANA 24hs treatment in THP-1 macrophages, measured by MTT assay. n = 13 per group Right: dose-response curve fitting yielded a IC50 = 0.17 mM, using an absorbance at 570 nm. n = 6 per group. (c-d) Effect of SANA on NF-κB/p65 subunit translocation into nuclei of THP-1 macrophages. (c) Quantification of nuclear fluorescence intensity (NFI) relative to total fluorescence intensity (TFI). n: Control (DMSO) = 26; LPS-DMSO = 33; LPS-Salycilate=56; LPS-SANA = 55. (d) Representative pictures. Cells were treated for 2 h before activation with LPS (1 μg/mL) for 30 minutes. Control: cells without LPS treatment. Bar = 10 μm. (e-g) SANA inhibition of neutrophil recruitment in Zebrafish. (e) Acute inflammation model assay. Larvae at 3 dpf were pre-treated with DMSO, Ibuprofen, Salycilate or SANA for 2 h. Tail fins were wounded with a scalpel, larvae were maintained with the drugs and neutrophils in the injury were imaged and counted 4 h post transection. (f) Representative pictures. Dotted rectangles indicate the wounded region (ROI) where neutrophils were counted. (g) Quantification of recruited neutrophils after treatment. n: Control (DMSO) = 35; Ibuprofen 20 µM = 17; Salicylate 200 µM = 19; SANA 200 µM = 20. (h) LPS-induced inflammatory model. C57BL/6 J mice were injected IP with SANA (100 mg/kg), Salicylate (100 mg/kg) or vehicle, 1 h before IP injection of LPS (10 mg/kg) or vehicle. (i-j) ELISA quantification of IL-1β in plasma and peritoneal lavage. n: Control=9; LPS = 8; SANA = 9; LPS-SANA = 9; Salicylate=8; LPS-Salicylate=9. Data: mean ± SEM. Statistical analyses: one-way ANOVA followed by Bonferroni post hoc for multiple comparisons (c, i, j). Kruskal-Wallis test (b). Source data
Extended Data Fig. 2
Extended Data Fig. 2. Pharmacokinetics, toxicity, and tissue distribution of SANA.
(a) Pharmacokinetics of SANA in mice. Mice were given a single dose of SANA (400 mg/kg) and plasma concentration was measured by LC-MS/MS over time. n = 3. (b-f) Toxicity effects of SANA. Mice were fed ND and administered with SANA (400 mg/kg/day, PO) for 8 weeks. (b) Liver and kidney macroscopic appearances and (c) Hematoxylin & Eosin liver and kidney staining. (d) ALT and AST in plasma/serum from mice at week 8. n = 11 per group. (e-f) Panel of liver (E) and renal (F) function markers (TP, ALB, GLO, TBIL and BUN). n = 12 per group. (g-j) Biodistribution analysis performed by 11C-SANA (9 MBq/animal) followed by PET-MRI scan. PET-scanning was performed the first 60 minutes after injection. (g) Representative picture of mice injected with 11C-SANA and followed by PET-MRI scans over time that were used to perform the analysis. (h) bladder and stomach, (i) kidney and liver, and j) iWAT, brain, and muscle. (h-j) n = 3. (k) ANCOVA analysis of ambulatory activity of mice treated with HFD or HFD + SANA (400 mg/kg/day, PO) at week 8. n = 8 per group. Data: mean ± SEM. Statistical analyses: unpaired two-sided Student’s t-test (d, e, f). ANCOVA (k). Source data
Extended Data Fig. 3
Extended Data Fig. 3. Effect of SANA formulation, main metabolite and evaluation of AMPK activation.
(a-e) SANA (or SAL) were daily injected SC at 20 mg/kg. (a) Percent of weight on day 0. n = 5 per group. (b) Cumulative food intake. n = 2 per group (c) Basal glucose levels. n: HFD = 7; HFD + SAL = 11; HFD + SANA = 14. (d-e) GTT (d) and GTT AOC (e) at week 6. n: HFD = 4; HFD + SAL = 5; HFD + SANA = 5. (f) Pharmacokinetics of SANA (single dose of 20 mg/kg, SC). SANA in plasma was determined at different time points by HPLC. n = 3. (g) Representative chromatograms of steady state levels of different SANA formulations (400 mg/kg/day, PO and 20 mg/kg/day, SC) in iWAT. Salicylic acid (S.A.) was used as an internal standard. (h-i) Chromatograms of organic extraction of plasma from control mice (H left) and SANA-treated mice (H right). M1 indicates the peak assigned to SANA main metabolite 5-(2-nitroethyl)salicylic acid by MS (i). (j) Percent of initial weight (day 0) of mice fed with HFD and treated with SANA or M1 (20 mg/kg/day, SC) for 8 weeks. n: HFD = 5; HFD + M1 = 5; HFD + SANA = 4. (k) Basal glucose levels at the onset of the experiment (0w) or after 8 weeks (8w) of HFD, HFD + SANA or HFD + M1 (20 mg/kg/day, SC). n = 5 per group. (l-m) Acute AMPK activation by SANA and SAL in vivo and in vitro. (l) Mice were treated with SANA, SAL (200 mg/kg, IP) or vehicle. AMPK activation was determined 1 h later by AMPK phosphorylation (Thr172) and ACC phosphorylation (S80) in the liver. n = 4 per group. (m) AMPK activation was measured in 3T3L1 adipocytes treated with 100 μM of SAL or SANA. A769662 (10 μM) was used as positive control. n = 3 per group. (n-o) Effect of SANA (20 mg/kg/day, SC) in AMPK KO (ɑ1) mice in HFD. n = 7 per group. (n) Weight (left) and food intake (right), after 8 weeks. (o) GTT (left) and GTT AOC (right) at week 8. Data: mean ± SEM. Statistical analyses: two-way ANOVA followed by Tukey’s multiple comparisons test (a, b, k, n, o), one-way ANOVA followed by Bonferroni post hoc for multiple comparisons (c, e, j, l, m). Source data
Extended Data Fig. 4
Extended Data Fig. 4. SANA stimulates creatine-dependent thermogenesis and promotes weight loss independently of UCP1 expression and activation.
(a) 18FDG uptake in different tissues of mice fed with HFD, HFD + SANA or HFD + SAL, 400 mg/kg/day, PO for 8 weeks. n = 5 per group. (b) Differentiated human white adipose cells (TERT-hWA) were incubated with SANA (100 μM), for 24 hours. Left: mitochondrial respiration. n: Control=44; SANA = 48. Right: thermogenic markers measured by qRT-PCR. n = 6 per group. (c) Respiration of adipocytes isolated from mice fed with HFD for 8 weeks. Cells were incubated with SANA 100 μM or vehicle (DMSO) n = 6 per group. (d-e) Respiration of mitochondria isolated from adipocytes (D) or brain (E), incubated with SANA (100 μM) or vehicle. n = 4 per group. (f) Effect of GDP on respiration, calculated from data in Fig. 5l. n = 6 per group. (g) Effect GDP on UCP1 activity of isolated mitochondria from BAT, incubated with SANA (100 µM) or vehicle. n = 3 per group. (h-i) Cumulative food intake (H) and tissue mass (I) of WT and UCP1-KO mice treated with SANA (20 mg/kg/day SC), measured at the end of treatment. n = 5 per group. (j) UCP1 expression in BAT from WT and UCP1-KO. n = 4 per group. (k) Cold challenge. Mice were treated with SANA (20 mg/kg/day, SC) or vehicle. n = 14 per group. (l–m) Effect of SANA on cold response in mice. (L) Expression of thermogenic markers in iWAT measured by qRT-PCR after 6 hours of cold exposure. n: Supplementary Tables. (M) Creatine quantification in iWAT in mice treated as described in L. n = 5 per group. (n-o) Effect of the creatine antagonist β-GPA in mice treated with SANA previous to cold. (N) Weight gain. n: Control=15; β-GPA = 9; SANA = 16; SANA+β-GPA = 10 and (O) cumulative food intake. n: Control=3; β-GPA = 2; SANA = 3; SANA+β-GPA = 2. Data: mean ± SEM. Statistical analyses: one-way ANOVA followed by Bonferroni post hoc for multiple comparisons (A); two-way ANOVA followed by Tukey’s multiple comparisons test (H, I, K); unpaired two-sided Student’s t-test (B -G, L-M). Vertical p-values indicate multiple comparisons of each experimental condition vs the control condition (HFD in A). Source data
Extended Data Fig. 5
Extended Data Fig. 5. Effect of SANA on skeletal and cardiac muscle function.
(a) Electromyogram at 15 and 30 min time points during cold exposure of mice treated daily with SANA (20 mg/kg/day, SC) or vehicle for 5 consecutive days before cold exposure. n = 4 per group. (b) qRT-PCR analysis of creatine kinases expression in gastrocnemius muscle. n: n = 5 for Ckb, Ckm and Ckmt2; n = 4 for Ckmt1 (c) Respiration of gastrocnemius permeabilized fibers from mice treated or not with SANA (20 mg/Kg/day, SC), and after addition of substrates (PM: pyruvate-malate; SUCC: succinate; ADP) and inhibitors (OLIGO: oligomycin and ROT: rotenone). n: Control=8; SANA = 7. (d) Assessment of mitochondrial respiration in differentiated C2C12 myoblasts n = 3 per group. (e) Creatine levels measured by NMR of mice treated with HFD or HFD + SANA (400 mg/kg/day, PO). n = 10 per group. (f) Aerobic muscle capacity measured in the treadmill at the end of treatment. Mice were fed during 22 weeks with HFD and HFD + SANA (or SAL) at 400 mg/kg/day, PO. n = 9 per group. (g) Respiration of permeabilized fibers from heart muscle from mice treated with SANA (20 mg/kg/day, SC). n: Control=5; SANA = 3. (h) Echo Cardiac function assessment in mice in HFD or HFD + SANA (or SAL) at 400 mg/kg/day, PO after 22 weeks of treatment. n = 5 per group. Data: mean ± SEM. Statistical analyses: one-way ANOVA followed by Bonferroni post hoc for multiple comparisons (f, h); two-way ANOVA followed by Tukey’s multiple comparisons test (a); unpaired two-sided Student’s t-test (b, c, d, e, g). Source data
Extended Data Fig. 6
Extended Data Fig. 6. Supporting additional information to CLAMS data of mice under acute HFD and SANA treatment under thermoneutral conditions.
(a) Surface temperature quantification from thermal images of mice fed with ND and treated with SANA under thermoneutral conditions (day 9). n = 9 per condition. (b) Left: EE measurements over a 24-hour period at the end of the acclimation period at thermoneutrality (day 7). Right: regression plot of these data. n: CTL = 14; SANA = 13. (c) Total activity over a 24-hour period during acclimation (day 7). n: CTL = 14; SANA = 13 (d) Left: EE Measurements over a 24-hour period at the end of SANA treatment under ND feeding (day 9). Right: regression plot of these data. n: CTL = 6; SANA = 7 (e) Total activity over a 24 h period at the end of SANA treatment under HFD. n: CTL = 14; SANA = 13. (f) Mice weight at the beginning and end of the acute HFD treatment. n: CTL = 14; SANA = 13. (g) Mice weight after acute single treatment with CL316,243 (1 mg/kg). n: HFD = 5; HFD + SANA = 6. (h) Respiratory exchange ratio (RER) from mice under acute HFD treatment at the end of acclimation period (day 7), at the end of ND + SANA (day 9) and at the end of HFD + SANA (day 12). n: CTL = 14; SANA = 13. Data: mean ± SEM. Statistical analyses: paired two-sided Student’s t-test (A), unpaired two-sided Student’s t-test (G, H), two-way ANOVA followed by Tukey’s multiple comparisons test (f), ANCOVA (b, d). Source data
Extended Data Fig. 7
Extended Data Fig. 7. Effect of SANA isomers (3-SANA, 4-SANA) and analog (E-SANA) on creatine induced thermogenesis.
(a) Chemical structure of synthesized and tested analogs and experimental strategy to evaluate their effect on thermogenesis. Mice were treated with different compounds (20 mg/kg/day, SC) following the same protocol described in Fig. 6f (acute HFD). Created with BioRender.com. (b) Representative thermal images. (c) Quantitation of thermal images corresponding to BAT, iWAT and tail regions at the end of the treatment. n = 8 per group. (d) qRT-PCR analysis of creatine kinases in BAT at the end of the treatment. n: Supplementary Tables. Data: mean ± SEM. Statistical analyses: One way ANOVA followed by Bonferroni post hoc for multiple comparisons (c, d). Expressed p-values indicate multiple comparisons of each experimental condition vs the condition of mice treated with SANA (HFD + SANA in c and d). Source data
Extended Data Fig. 8
Extended Data Fig. 8. Extended clinical information.
(a-b) Clinical trial design for Single Ascending Dose (SAD) (a) and Multiple Ascending Dose (MAD) (b). (c) Pharmacokinetics of MVD1 in SAD and MAD, Day 1. The calculation of the pharmacokinetics parameters is presented in Supplementary Tables. (d) Pharmacokinetics of the last dosage given to volunteers from MAD at day 15 of administration. The calculation of the pharmacokinetics parameters is presented in Supplementary Tables. Source data
Extended Data Fig. 9
Extended Data Fig. 9. Gene expression of creatine kinases during different thermogenic stimuli.
(a) RNAseq expression analysis of all creatine kinases in two clusters of human adipocytes progenitor cells (10.1073/pnas.1906512116). Respective statistical comparisons were set between vehicle-treated differentiated adipocytes (M), and forskolin-treated differentiated adipocytes (F). C corresponds to adipocytes maintained in a non-differentiated state. n = 5 per group in cluster 1-lipogenic adipocytes (Left) and n = 14 per group in cluster 2-thermogenic adipocytes (right,). CKM was not present in the public dataset analyzed. (b) Analysis of creatine kinases and the Alpl phosphatase expression by qRT-PCR in iWAT and BAT from mice fed with ND and maintained at room temperature (22 °C) or after a prolonged cold challenge (48 hours at 4 °C). iWAT: 22 °C n = 5 for Ckm, Ckmt1 and Ckb; n = 4 for Ckmt2 and Alpl; 4 °C n = 7 for Ckm, Ckmt1, Ckmt2 and Ckb; n = 8 for Alpl. BAT: 22 °C n = 4 for Ckm and Ckmt2; n = 5 for Ckmt1, Ckb and Alpl; 4 °C n = 8 for Ckm, Ckmt1, Ckb and Alpl; n = 7 for Ckmt2. Data: mean ± SEM. Statistical analyses: unpaired two-sided Student’s t-test (a,b). Source data

Update of

References

    1. Flegal, K. M., Graubard, B. I., Williamson, D. F. & Gail, M. H. Cause-specific excess deaths associated with underweight, overweight, and obesity. JAMA298, 2028–2037 (2007). - PubMed
    1. Wilding, J. P. H. et al. Once-weekly semaglutide in adults with overweight or obesity. N. Engl. J. Med.384, 989–1002 (2021). - PubMed
    1. Villacorta, L., Gao, Z., Schopfer, F. J., Freeman, B. A. & Chen, Y. E. Nitro-fatty acids in cardiovascular regulation and diseases: characteristics and molecular mechanisms. Front. Biosci.21, 873–889 (2016). - PMC - PubMed
    1. Batthyany, C. et al. Reversible post-translational modification of proteins by nitrated fatty acids in vivo. J. Biol. Chem.281, 20450–20463 (2006). - PMC - PubMed
    1. Kelley, E. E. et al. Fatty acid nitroalkenes ameliorate glucose intolerance and pulmonary hypertension in high-fat diet-induced obesity. Cardiovasc. Res.101, 352–363 (2014). - PMC - PubMed

Publication types