

Determining frailty index thresholds for older people across multiple countries in sub-Saharan Africa
- PMID: 40527965
- PMCID: PMC12174359
- DOI: 10.1038/s43856-025-00952-1
Determining frailty index thresholds for older people across multiple countries in sub-Saharan Africa
Abstract
Background: Despite the increasing attention on frailty as a global public health concern, frailty screening among older people in Sub-Saharan Africa (SSA) continues to rely on instruments and thresholds from high-income countries. These instruments and thresholds may not be useful in SSA due to contextual differences. We explored the development of a frailty threshold for older people in SSA.
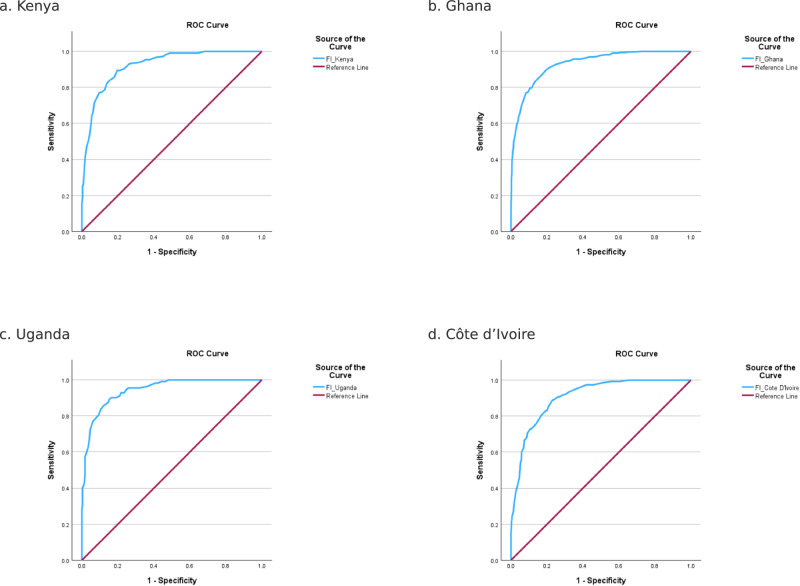
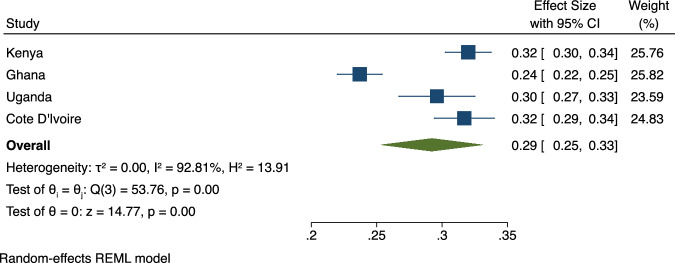
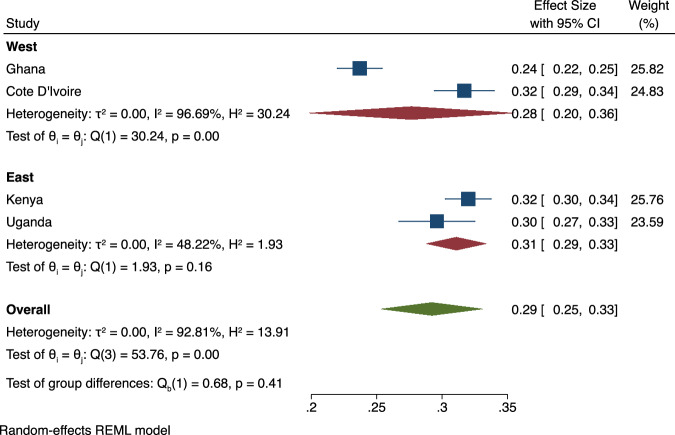
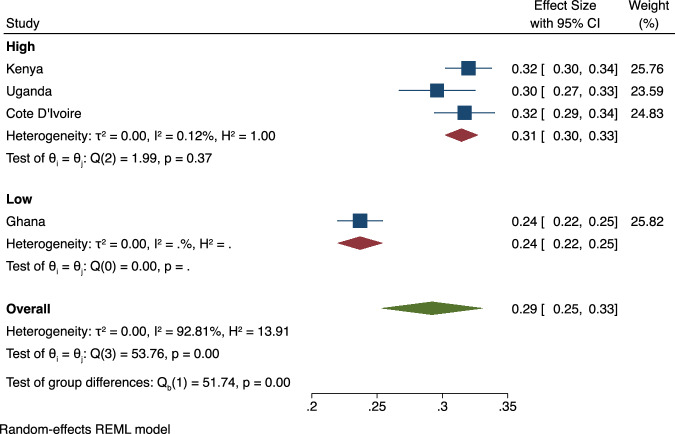
Methods: We utilized pooled cross-sectional data from four SSA countries (Kenya, Ghana, Uganda and Côte d'Ivoire) to determine a frailty index threshold for 5527 older people (50 years and above) using a two-step approach. The mean ages of the participants ranged from 62.13 (SD: 9.60) to 74.00 (SD: 9.40) years. The participants were mostly females across the four countries, ranging from 50.1% in Côte d'Ivoire to 65.3% in Kenya. Country-specific frailty thresholds were developed using the Receiver Operating Characteristics (ROC) method. The primary thresholds were further combined into a single threshold using random effects meta-analysis. Subgroup analyses and meta-regression were conducted to explore potential sources of heterogeneity in the pooled frailty threshold.
Results: Here we show the Area Under the Curves from the ROC analyses ranging between 0.91 (CI: 0.89, 0.93) and 0.94 (CI: 0.92, 0.97), with sensitivities ranging from 0.83 to 0.94 and specificities from 0.72 to 0.87. An overall threshold of 0.29 (95% CI: 0.25, 0.33) was obtained after pooled analysis of the country-specific thresholds.
Conclusions: This work demonstrates that using context-specific data can yield valuable insights into frailty thresholds among older people in SSA, enabling more culturally relevant interventions. Effective frailty screening must account for population-level differences, including demographic, health, and socio-cultural factors.
Plain language summary
Frailty is a common problem which makes older people weak and unable to carry out daily activities. While this has been well researched in high-income countries, there is limited evidence about frailty among older people in Sub-Saharan Africa, where the older population is increasing quickly. Most studies conducted in sub-Saharan Africa rely on thresholds developed and validated in high-income countries, which may not capture the important things that contribute to frailty in Sub-Saharan Africa. We developed a frailty threshold by combining data from four African countries. Our results show that it is possible to develop thresholds that reflect the realities of older people in Sub-Saharan Africa, though attention to each population’s aging profile is still required for effective frailty screening.
© 2025. The Author(s).
Conflict of interest statement
Competing interests: The authors declare no competing interests.
Figures
Similar articles
-
Measuring non-events: infertility estimation using cross-sectional, population-based data from four countries in sub-Saharan Africa.Hum Reprod. 2024 Dec 1;39(12):2848-2860. doi: 10.1093/humrep/deae218. Hum Reprod. 2024. PMID: 39348340
-
Developing a feasible frailty screening instrument for older people in Sub-Saharan Africa: Exploratory and confirmatory factor analysis.Geriatr Gerontol Int. 2025 Jul;25(7):952-959. doi: 10.1111/ggi.70068. Epub 2025 May 12. Geriatr Gerontol Int. 2025. PMID: 40356279
-
Assessing the comparative effects of interventions in COPD: a tutorial on network meta-analysis for clinicians.Respir Res. 2024 Dec 21;25(1):438. doi: 10.1186/s12931-024-03056-x. Respir Res. 2024. PMID: 39709425 Free PMC article. Review.
-
Decomposing socioeconomic and educational inequalities in infant mortality in Sub-Saharan Africa: DHS insights linked to countdown to 2030 and agenda 2063.BMC Public Health. 2025 Jul 17;25(1):2488. doi: 10.1186/s12889-025-23683-3. BMC Public Health. 2025. PMID: 40676638 Free PMC article.
-
Prevalence of ESBL-producing Escherichia coli in sub-Saharan Africa: A meta-analysis using a One Health approach.One Health. 2025 Jun 2;20:101090. doi: 10.1016/j.onehlt.2025.101090. eCollection 2025 Jun. One Health. 2025. PMID: 40529906 Free PMC article. Review.
References
-
- Howlett, S. E., Rutenberg, A. D. & Rockwood, K. The degree of frailty as a translational measure of health in aging. Nat. Aging1, 651–665 (2021). - PubMed
LinkOut - more resources
Full Text Sources
Research Materials
